Table of Contents
![]()
- 1. 10 Multi-Entity Accounting Automation Tips
- 2. Fast close accounting: How to close your books in 3 days or less
- 3. Intercompany reconciliation: 7 steps for accurate financial reporting
- 4. Strategic Scenario Planning: A Practical Guide for Finance Teams
- 5. Incremental Budgeting: A Complete Guide for Finance Teams
- 6. FP&A AI: Complete Guide to Artificial Intelligence in Financial Planning
- 7. Strategic budgeting: A complete guide to aligning finances with long-term goals
- 8. How to Create an Operating Budget (Step-by-Step Guide)
- 9. How to Do Vertical Analysis of a Balance Sheet
- 10. How to Do Sensitivity Analysis in Excel: A Complete Guide
- 11. CFO Reports to the Board of Directors: A Complete Guide
- 12. Cost volume profit analysis: A complete guide for finance teams
- 13. Workflow Automation for Fractional CFOs & Finance Service Firms
- 14. 11 Account Reconciliation Best Practices
- 15. How to build budget vs. actual reporting in spreadsheets
- 16. Automate Your Month End Close Process: A CFO’s 5-Step Playbook
- 17. 8 Must Automate Processes for Fractional CFO & Accounting firms
- 18. 6 Ways for CFO Firms to Provide Better Client Reporting
- 19. 6 Great Excel Report Templates for Fractional CFOs
- 20. How to Perform Price‑Volume‑Mix (PVM) Analysis in Excel — Free Template
- 21. How to Build a 13‑Week Cash‑Flow Forecast in Excel (Free Template)
- 22. How to Calculate Trailing‑12‑Month (TTM) Metrics in Spreadsheets + Free Template
- 23. How to do Scenario Analysis in Spreadsheets
- 24. Best Practices for Consolidating Financial Statements


Board meetings test every CFO… CFO Reports to the board of directors aren’t something for the weak. Behind polished slides lies hours of data wrangling, last-minute fixes, and the pressure to turn complex data into clear strategic insights. Your board needs context, not just numbers—but manual reporting leaves little time for the analysis that matters.
This guide covers what to include in board reports, how to design them for impact, and how automation can free your time for strategic work.
What should be included in CFO Reports to the board of directors
Board directors need specific data to make informed decisions. The right mix of historical performance, current analysis, and forward-looking projections gives them the complete picture.

Core financial statements
Profit and Loss Statement (P&L)
Your P&L shows revenue, expenses, and net income in one view. Include year-over-year comparisons and gross margins so directors can assess how operations are performing. This statement answers the basic question: Are we making money?
Review the SaaS P&L template for formatting examples.
Balance Sheet
The balance sheet captures your financial position at a specific moment. Focus on assets, liabilities, and overall stability. Directors use this to understand what the company owns, what it owes, and how solid its foundation is.

See the QuickBooks balance sheet template for structure examples.
Cash Flow Statement
Track cash inflows and outflows across operating, investing, and financing activities. This statement shows actual liquidity and helps directors understand runway and burn rate—critical for growth-stage companies.

Explore the SaaS cash flow template for formatting guidance.
Statement of Shareholders’ Equity
Show changes in equity over time, including retained earnings and capital structure shifts. This completes the picture of how ownership value has changed.
Performance metrics and analysis
Numbers without context tell an incomplete story. These reports help board members understand the “why” behind results.
Variance reports (budget vs. actual vs. forecast)
These reports compare planned budgets with actual results. Variance analysis explains what happened and what you’re doing about it. When revenue falls 15% short of plan, directors need to know the cause and your response.
Use the QuickBooks budget vs. actual template to track performance gaps.
Year-to-date performance summaries
Cumulative tracking shows progress toward annual goals. Directors want to know: Are we on pace to hit our targets?
Trend analysis over time
Historical patterns reveal growth trajectories. Compare month-over-month, quarter-over-quarter, and year-over-year performance to spot momentum shifts early.
Key performance indicators (KPIs)
Board members need to see the metrics that drive your business:
- Revenue metrics like ARR, MRR, and bookings
- Profitability indicators like EBITDA and gross margin
- Efficiency ratios like customer acquisition cost and lifetime value

The Stripe revenue dashboard tracks LTV, MRR, and other critical SaaS metrics.
Forward-looking information
Boards make decisions about the future. Give them the projections and scenarios they need.
Financial forecasts and projections
Project revenue and expenses for upcoming quarters. Show expected performance ranges so directors can calibrate expectations.
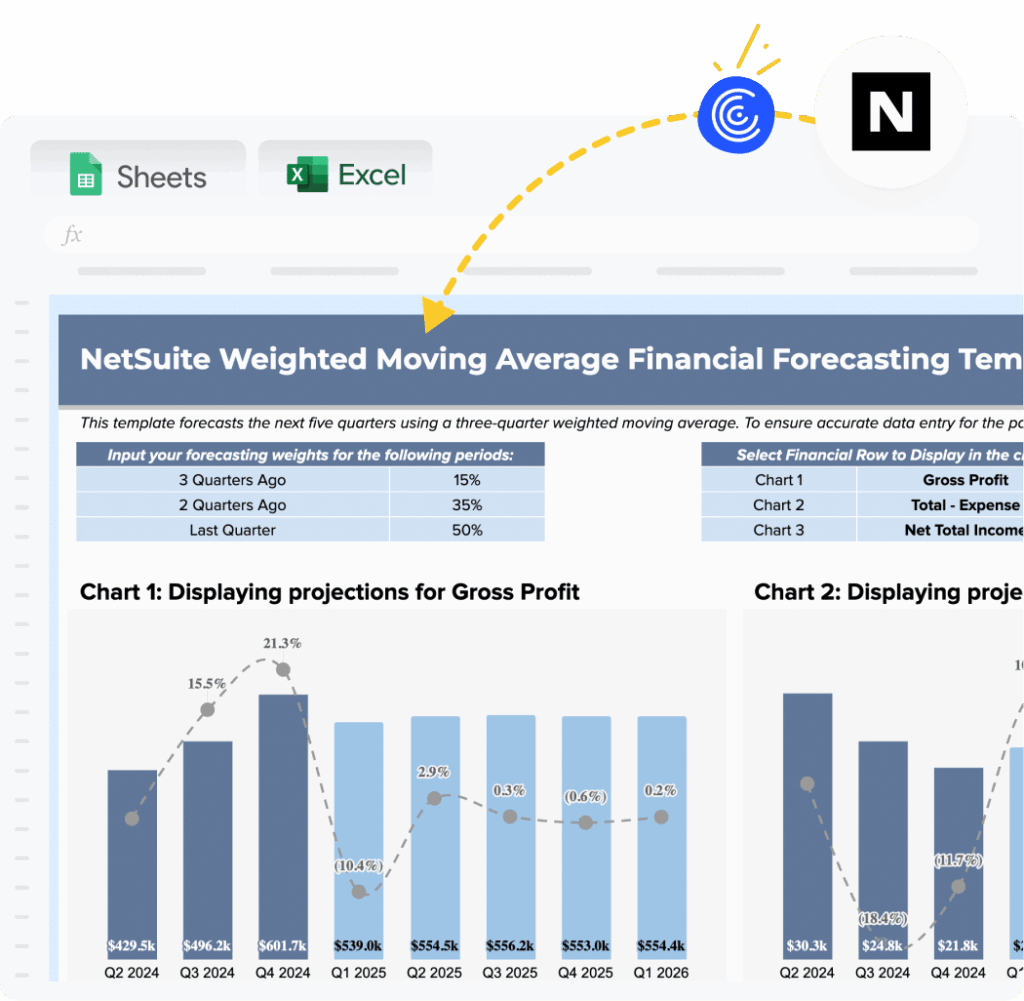
Use the NetSuite financial forecasting template to model net income, working capital changes, and cash flow projections.
Budget outlook for upcoming periods
Share resource allocation plans and investment priorities. Directors want to understand where capital is going.
Scenario planning and sensitivity analysis
Present best case, base case, and worst case scenarios. What-if analysis shows how changing key assumptions affects results—vital for strategic planning.

The QuickBooks what-if scenario analysis template lets you model revenue, COGS, and profit scenarios using live data.
Risk assessments and mitigation strategies
Identify financial risks, operational risks, and compliance issues that could affect performance. Directors appreciate transparency about what could go wrong.
Strategic context
Context transforms data into insight. Board members need to understand market conditions, competitive positioning, and macroeconomic factors affecting results.
Cross-functional insights matter here: How does your sales pipeline affect revenue forecasts? What returns do product investments promise? Include marketing spend efficiency, operational metrics affecting margins, and HR data on headcount planning.
Explain why variances occurred and what actions you’re taking. Show how results connect to strategic objectives.
Designing effective board reports
How you present information matters as much as what you present. These principles help CFOs create reports that drive strategic discussion.
1. Lead with strategy, not just numbers
Board directors focus on strategic oversight, not month-end close processes. Connect financial performance to strategic implications and show what decisions need to be made.
Start presentations with key strategic messages. Use financial data to support those points, not the other way around. Skip the calculations and get to the conclusion—directors don’t need to see your work.
2. Know your audience
Board composition varies widely. Not everyone speaks finance fluently. Define technical terms in plain language and avoid jargon. Provide context for metrics and use real-world examples.
For instance, explain depreciation as “how much of an asset is consumed each year” rather than using technical terminology. Your audit committee needs different detail than your compensation committee.
3. Use visual storytelling
Visual storytelling transforms raw data into clear graphics. Use bar charts for comparisons, line graphs for trends, and heat maps to highlight variances.
Dashboards consolidate key metrics in one view. Color coding draws attention to critical issues. Tools like Coefficient help with quick dashboard creation from the finance dashboard gallery, providing real-time visualization directly from business systems.
Keep graphics simple with one clear message per visualization. Show $2 million rather than $2,095,782.16.
4. Incorporate multiple perspectives
Effective board reports integrate cross-functional insights:
- Sales pipeline data informs revenue forecasts
- Customer success metrics affect retention revenue
- Product development investments have expected returns
This provides complete context and shows your understanding of the entire business.
5. Keep it relevant and action-oriented
Board members have limited time. Focus on material items affecting business trajectory. Highlight issues requiring board input. Flag emerging risks before they become critical.
Include specific recommendations when appropriate. Identify decisions needed from the board and provide clear next steps with owners assigned. Every report should answer: “What does this mean for our business, and what should we do about it?”
6. Demonstrate problem-solving capabilities
Boards want to know that leadership has plans to address problems. Identify issues transparently and provide root cause analysis. Present solution options with pros and cons. Recommend a specific course of action.
Acknowledge variances, show corrective actions underway, and present realistic timelines for improvement.
How to build trust and strong board relationships as a CFO
The numbers matter, but relationships determine how effectively you work with your board. Trust takes time to build and seconds to lose.
1. Prioritize transparency
Share both good news and bad news promptly. Provide complete context, including risks and uncertainties. Admit when you don’t know something and commit to finding out.
Board members can handle bad news but not surprises. Transparent reporting builds credibility and lets the board help solve problems early.
2. Emphasize clear communication
Use plain language instead of finance jargon. Structure presentations logically: context, data, implications, recommendations.
Tell a coherent narrative connecting data points. Anticipate questions and address them proactively. Provide executive summaries for time-constrained directors. Focus on outcomes, not process.
3. Deliver consistency and accuracy
Use the same metrics and definitions period over period. Maintain consistent reporting formats. Report on schedule without delays.
Verify data before presentation and have supporting documentation ready. Use automated data connections to reduce manual mistakes. Consistent excellence builds credibility over time.
4. Engage beyond formal meetings
Meet one-on-one with board members between formal sessions. Provide informal updates on significant developments. Respond promptly to questions.
Invite board input on strategic financial decisions. Attend board committee meetings. Don’t wait for board meetings to share important updates—keep your Audit Committee chair particularly well-informed.
5. Follow through on feedback
Take detailed notes during meetings on questions and requests. Create action item lists with owners and deadlines.
Provide written responses to questions you couldn’t answer in meetings. Update the board on progress for previously discussed initiatives. Show how board feedback influenced decisions.
Reference previous board discussions in current presentations and report on outcomes of board-approved initiatives.
How to use automation for your CFO Reports to the board of directors
Traditional board reporting often consumes 40+ collective hours before each meeting. The process requires coordination across multiple team members, data validation, narrative construction, and slide formatting.
Modern financial automation tools eliminate manual data collection and reduce errors. Tools like Coefficient transform board reporting by connecting spreadsheets directly to live business data from NetSuite, QuickBooks, Salesforce, and dozens of other sources.
Reports auto-refresh on schedule—hourly, daily, or weekly. Direct data pipelines eliminate manual exports and copy-paste work, freeing finance teams to focus on analysis rather than data gathering.
Key benefits:
- Save several hours per week on manual reporting tasks
- Reduce errors from manual data handling
Speed up month-end close
Enable real-time decision-making with current data
Create always up-to-date dashboards for board access
How Cyrq Energy transformed board reporting

Cyrq Energy operates geothermal power plants throughout the Western United States. Backed by a leading infrastructure financial sponsor, the company manages long-term power purchase agreements with fewer than 20 people in their corporate office.
The challenge
Cyrq’s lean finance team needed to deliver complex financial reports to their infrastructure sponsor while managing data from multiple power plants. Their existing tools presented two painful options: expensive enterprise solutions or basic tools that forced all data manipulation into Excel.
“More ‘bare bones’ solutions, while cheap and easy to get started, are only capable of accessing NetSuite’s record-level data and forced us to do our data cleaning/manipulation in Excel. This slowed refresh times down and made troubleshooting/tying out painful,” explained Sam Sholeff, Director of Finance at Cyrq Energy.
The solution
Coefficient provided direct NetSuite-to-Excel connectivity. The team does 80% of data cleaning in NetSuite before export, using the system’s powerful query capabilities. Coefficient connects to NetSuite saved searches, SuiteQL, and custom fields—beyond just base datasets.
“Coefficient is competitive because it accesses more than just the base dataset in NetSuite. Our team can do 80% of our data cleaning/filtering in our ERP system and call those results to Excel,” said Sholeff.
The results
Cyrq Energy achieved remarkable outcomes:
- Recreated reports in days that previously took months with other database query tools
Saved over $50,000 annually by avoiding higher costs of similar connectivity packages - Accelerated monthly close with streamlined data extraction
Automated financial statements with direct pipelines from NetSuite to shareholder reporting packages
“Our spreadsheets are now faster, more accurate, and easier to update,” noted Sholeff.
The team now plans to expand Coefficient usage to everyone using ERP data for reports—including supply chain and operations teams.
Watch: Expert tips for CFO reporting automation
Start automating your CFO Reports to the board of directors
CFO Reports to the board of directors represents one of your most important responsibilities. The right approach combines comprehensive financial data, strategic context, clear communication, and efficient processes. Board members need to see not just what happened, but why it matters and what comes next.
Automation tools free your team from administrative tasks while improving accuracy and timeliness. Real-time data connections mean your reports stay current without constant manual updates.
Strong board relationships built on transparency, consistency, and clear communication amplify the impact of well-designed reports. When you combine thorough preparation with automated workflows, you create space for the strategic discussions that truly move your business forward.
Get started with Coefficient today.