


Table of Contents
![]()
- 1. 10 Multi-Entity Accounting Automation Tips
- 2. Fast close accounting: How to close your books in 3 days or less
- 3. Intercompany reconciliation: 7 steps for accurate financial reporting
- 4. Strategic Scenario Planning: A Practical Guide for Finance Teams
- 5. Incremental Budgeting: A Complete Guide for Finance Teams
- 6. FP&A AI: Complete Guide to Artificial Intelligence in Financial Planning
- 7. Strategic budgeting: A complete guide to aligning finances with long-term goals
- 8. How to Create an Operating Budget (Step-by-Step Guide)
-
9. How to Do Vertical Analysis of a Balance Sheet
- What is vertical analysis of a balance sheet?
- Vertical analysis formula for balance sheet
- How to perform vertical analysis on a balance sheet (step-by-step)
- What to look for in vertical analysis results
- Vertical analysis vs. horizontal analysis
- How to automate vertical analysis in Excel
- How to use vertical analysis to compare companies
- Limitations of vertical analysis
- Start analyzing your balance sheet today
- 10. How to Do Sensitivity Analysis in Excel: A Complete Guide
- 11. CFO Reports to the Board of Directors: A Complete Guide
- 12. Cost volume profit analysis: A complete guide for finance teams
- 13. Workflow Automation for Fractional CFOs & Finance Service Firms
- 14. 11 Account Reconciliation Best Practices
- 15. How to build budget vs. actual reporting in spreadsheets
- 16. Automate Your Month End Close Process: A CFO’s 5-Step Playbook
- 17. 8 Must Automate Processes for Fractional CFO & Accounting firms
- 18. 6 Ways for CFO Firms to Provide Better Client Reporting
- 19. 6 Great Excel Report Templates for Fractional CFOs
- 20. How to Perform Price‑Volume‑Mix (PVM) Analysis in Excel — Free Template
- 21. How to Build a 13‑Week Cash‑Flow Forecast in Excel (Free Template)
- 22. How to Calculate Trailing‑12‑Month (TTM) Metrics in Spreadsheets + Free Template
- 23. How to do Scenario Analysis in Spreadsheets
- 24. Best Practices for Consolidating Financial Statements


Balance sheets show your company’s financial position. But comparing absolute dollar amounts across companies or time periods can be misleading. A $100,000 cash balance looks different at a $500,000 company than at a $5 million company.
Vertical analysis solves this by converting every line item into a percentage of total assets. This creates a common size balance sheet where you can compare financial structures regardless of company size. Here, you’ll learn the exact formula, step-by-step process, and how to interpret the results.
What is vertical analysis of a balance sheet?
Vertical analysis shows each line item on the balance sheet as a percentage of total assets. Instead of looking at raw numbers, you examine the proportion each account represents.
The term “vertical” refers to analyzing line items up and down within a single statement for one period. Total assets always equal 100%, and every other account—cash, inventory, debt, equity—is expressed as a percentage of that total. This method is also called common size analysis.
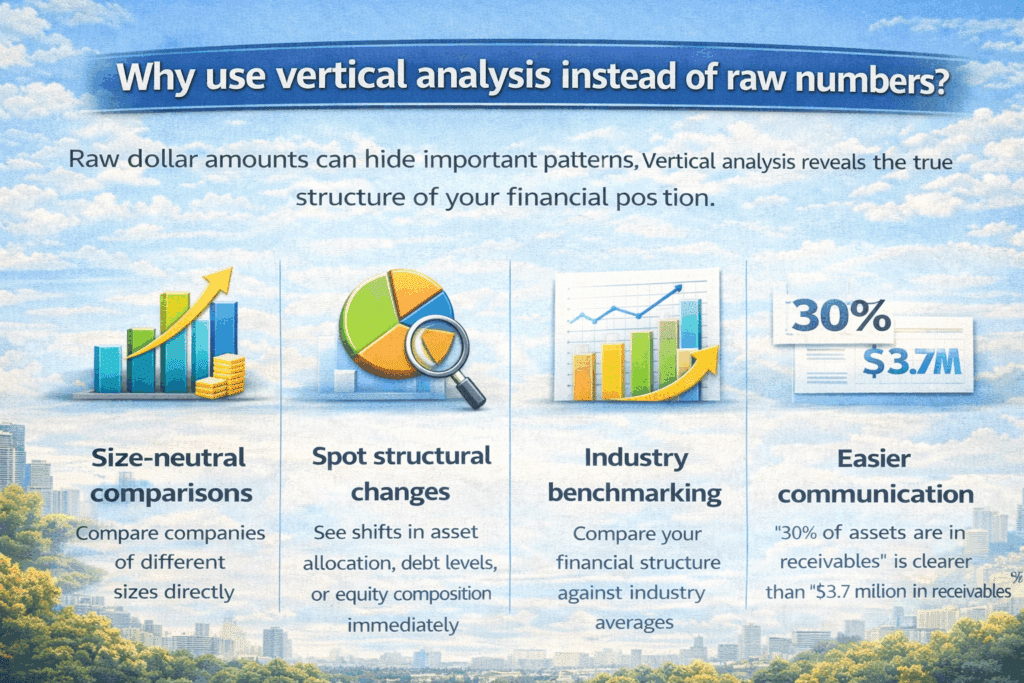
Why use vertical analysis instead of raw numbers?
Raw dollar amounts can hide important patterns. Vertical analysis reveals the true structure of your financial position.
- Size-neutral comparisons — Compare companies of different sizes directly
- Spot structural changes — See shifts in asset allocation, debt levels, or equity composition immediately
- Industry benchmarking — Compare your financial structure against industry averages
- Easier communication — “30% of assets are in receivables” is clearer than “$3.7 million in receivables”
Vertical analysis formula for balance sheet
The formula is simple. Every calculation uses the same approach:
Vertical Analysis % = (Line Item / Total Assets) × 100
Total assets always equals 100%. Every other line item becomes a percentage of that base figure.
Example: A company with $500,000 in total assets
Line Item | Dollar Amount | Calculation | Percentage |
|---|---|---|---|
Cash | $50,000 | $50,000 / $500,000 × 100 | 10% |
Inventory | $100,000 | $100,000 / $500,000 × 100 | 20% |
Fixed Assets | $275,000 | $275,000 / $500,000 × 100 | 55% |
The asset percentages sum to 100%. Liability and equity percentages also sum to 100%.
How to perform vertical analysis on a balance sheet (step-by-step)
Step 1: Prepare your balance sheet data
Start with a complete, accurate balance sheet. Include all standard sections:
- Current Assets — Cash, Accounts Receivable, Inventory, Prepaid Expenses
- Non-Current Assets — Fixed Assets/PP&E, Intangible Assets, Long-term Investments
- Current Liabilities — Accounts Payable, Accrued Expenses, Short-term Debt
- Long-term Liabilities — Long-term Debt, Deferred Tax Liabilities
- Shareholders’ Equity — Common Stock, Retained Earnings, Additional Paid-in Capital
Instead of manually exporting balance sheet data from QuickBooks, Xero, or NetSuite, use Coefficient to pull live data directly into Excel or Google Sheets. This removes manual data entry errors and keeps your analysis current.
Step 2: Identify the base figure
The base figure for balance sheet vertical analysis is Total Assets. This becomes your denominator for all calculations.
Total Assets = Total Liabilities + Total Equity. This is the fundamental accounting equation. When you divide both sides by Total Assets, you create a standardized view where all accounts are shown as percentages.
Verify your balance sheet balances before starting. Assets must equal Liabilities + Equity.
Step 3: Calculate percentages for assets
Divide each asset line item by Total Assets and multiply by 100.
Start with Current Assets. Calculate the percentage for each line: Cash, AR, Inventory, Prepaid. Then move to Non-Current Assets and calculate Fixed Assets, Intangibles, and Long-term Investments percentages.
Excel formula tip: Use cell referencing like =B4/$B$15*100 where B4 is the line item and $B$15 is Total Assets. The dollar signs create an absolute reference so Total Assets stays fixed when copying the formula down.
Step 4: Calculate percentages for liabilities and equity
Apply the same formula to liabilities and equity sections. Still use Total Assets as the denominator.
Calculate Current Liabilities percentages (AP, Accrued Expenses, Current Portion of Debt), then Long-term Liabilities percentages, then Equity section percentages.
Critical verification: Total Liabilities % + Total Equity % must equal 100%. Always use Total Assets as the base for the entire balance sheet to maintain consistency.
Step 5: Format and review your analysis
Proper formatting makes your vertical analysis easier to read.
- Create three columns: Account Name, Dollar Amount, and Percentage
Use consistent decimal places (typically one decimal: 15.3%)
Bold section totals and indent line items
Add subtotal percentages for major sections
Review checklist: Do all asset percentages sum to 100%? Do liabilities + equity percentages sum to 100%? Are there any negative percentages or percentages over 100%?
Step 6: Interpret the results
The real value comes from interpreting what the percentages reveal.
Asset structure metrics:
- Current Assets % of Total Assets indicates liquidity
- Fixed Assets % shows capital intensity (high for manufacturing, low for services)
- Receivables % above 30% may signal collection issues
Debt vs. equity structure:
- Total Liabilities % indicates financial leverage
- Equity % above 50% indicates conservative financing
- Equity % below 30% may indicate high leverage risk
What to look for in vertical analysis results
Asset composition and liquidity profile
Your asset structure reveals liquidity and operational characteristics. High Current Assets (50-70% of total) indicate a liquid, flexible position common in service businesses. Low Current Assets (20-30% of total) suggest capital-intensive operations typical in manufacturing or real estate.
Key thresholds to watch:
- Cash 5-15% — Healthy liquidity cushion
- Accounts Receivable 10-20% — Reasonable for B2B companies
- Inventory 15-25% — Normal for product companies; higher may indicate slow-moving stock
Capital structure and financial leverage
Your debt-to-equity mix reveals financial risk. Total Liabilities at 30-50% of assets indicates moderate, balanced leverage. Total Liabilities above 60% signals higher risk. Total Equity above 60% indicates conservative financing.
Debt composition matters too. If current liabilities represent 20%+ of assets while long-term debt is minimal, the company may be relying on riskier short-term financing.
Year-over-year structural changes
Comparing vertical analysis across multiple periods reveals strategic shifts. Changes of 3-5 percentage points or more in major line items warrant investigation. Small fluctuations (1-2 points) are normal.
Watch for: declining cash percentage, increasing receivables percentage (collection problems?), rising inventory percentage (slow sales?), and climbing debt percentage (assess debt service capacity).
Vertical analysis vs. horizontal analysis
Horizontal analysis examines financial data across multiple time periods to identify trends and growth rates. Instead of showing each item as a percentage of a base figure, it calculates the percentage change from period to period.
The key distinction: Vertical analysis reads down a single statement (one period). Horizontal analysis reads across multiple periods (time series).
Aspect | Vertical Analysis | Horizontal Analysis |
|---|---|---|
Time frame | Single period snapshot | Multiple periods compared |
Base figure | Total Assets (100%) | Base year or prior period |
Calculation | Line Item ÷ Total Assets × 100 | (Current – Prior) ÷ Prior × 100 |
Question answered | “What % of assets is Cash?” | “How much did Cash grow YoY?” |
Best for | Comparing different-sized companies | Tracking performance over time |
Most analysts use both methods together. Vertical analysis shows current structure. Horizontal analysis shows how that structure is changing.
How to automate vertical analysis in Excel
Method 1: Excel formulas with absolute references
Set up your spreadsheet once and formulas handle the rest.
- Create three columns: Account, Amount, and Percentage
- Enter Total Assets in a fixed cell (e.g., B20)
- In the percentage column, enter: =B4/$B$20*100
- Copy the formula down to all line item
- Add a SUM formula to verify asset percentages total 100%
Once set up, you only need to update the Amount column and percentages auto-calculate.
Method 2: Coefficient for automated balance sheet import

The most powerful automation removes manual data entry entirely.
Coefficient connects your spreadsheets directly to QuickBooks, Xero, NetSuite, or other ERP systems. Install the free add-in, connect your accounting system, and import live balance sheet data. Set up percentage columns with formulas that reference the imported data, then schedule auto-refresh hourly, daily, or weekly.
Key advantages:
- Zero manual exports — No more downloading CSVs
- Removes transcription errors — Data flows directly from source
- Real-time analysis — Schedule refreshes to keep analysis current
Method 3: Excel tables for multi-period analysis
For analyzing multiple periods, Excel tables offer advanced options. Select your balance sheet data > Insert > Table. Excel automatically expands formulas to new rows. Use structured references for cleaner formulas: =[@Amount]/[Total Assets].
How to use vertical analysis to compare companies
Vertical analysis removes the size factor so a $10 million company and a $1 billion company can be compared directly.
Comparison process:
- Select comparable companies — Choose 2-5 companies in the same industry
- Obtain balance sheets for the same period — Different fiscal year-ends introduce seasonal distortions
- Perform vertical analysis on each — Use respective Total Assets as base figures
- Create comparison table — Columns for each company plus industry average
Key differences to analyze:
- Asset intensity — Higher Fixed Assets % indicates capital intensity
- Liquidity position — Compare Current Assets % and Cash %
- Leverage profile — Compare Total Liabilities %
Best practices: Account for industry norms (manufacturing naturally has higher Fixed Assets % than services). Look for outliers—if one company differs by 10+ percentage points, investigate why. Use 3-5 peers plus industry averages for context.
Limitations of vertical analysis
- No time or trend information. Vertical analysis provides a static snapshot. A company with 10% cash might seem healthy, but if cash was 25% last year, that’s significant deterioration. Supplement with horizontal analysis.
- Lacks absolute size context. Two companies might both show 15% cash, but one has $15 million while the other has $150,000. Review dollar amounts alongside percentages.
- Industry variations. What’s “normal” varies dramatically. A software company with 70% Fixed Assets looks alarming, but that’s standard for a utility. Always benchmark against same-industry peers.
- Doesn’t reflect performance. Vertical analysis shows structure, not efficiency or profitability. High receivables percentage could indicate strong sales or poor collections—it can’t distinguish.
- Seasonal timing issues. A retailer’s inventory percentage spikes before holidays and drops after. Use the same period for all comparisons.
Start analyzing your balance sheet today
Vertical analysis converts raw numbers into percentages that reveal financial structure, enable size-neutral comparisons, and highlight changes in asset allocation or debt levels over time.
The formula is simple: divide each line item by Total Assets and multiply by 100. Watch for asset composition patterns, capital structure risks, and year-over-year structural shifts.
Get started with Coefficient to pull live balance sheet data directly into your spreadsheets and keep your analysis current without manual exports.
