Table of Contents
![]()
- 1. 10 Multi-Entity Accounting Automation Tips
- 2. Fast close accounting: How to close your books in 3 days or less
- 3. Intercompany reconciliation: 7 steps for accurate financial reporting
- 4. Strategic Scenario Planning: A Practical Guide for Finance Teams
- 5. Incremental Budgeting: A Complete Guide for Finance Teams
- 6. FP&A AI: Complete Guide to Artificial Intelligence in Financial Planning
- 7. Strategic budgeting: A complete guide to aligning finances with long-term goals
- 8. How to Create an Operating Budget (Step-by-Step Guide)
- 9. How to Do Vertical Analysis of a Balance Sheet
- 10. How to Do Sensitivity Analysis in Excel: A Complete Guide
- 11. CFO Reports to the Board of Directors: A Complete Guide
- 12. Cost volume profit analysis: A complete guide for finance teams
- 13. Workflow Automation for Fractional CFOs & Finance Service Firms
- 14. 11 Account Reconciliation Best Practices
-
15. How to build budget vs. actual reporting in spreadsheets
- What is budget vs. actual reporting variance analysis?
- Gather budget and actual reporting data
- Set up your chart of accounts mapping
- Calculate budget vs actual reporting variance amounts and percentages
- Build the variance dashboard
- Interpret the variances
- Drill down by department or class
- Add prior year comparisons
- Automate refresh and alerts with Coefficient
- Turn variance into action
- FAQs
- 16. Automate Your Month End Close Process: A CFO’s 5-Step Playbook
- 17. 8 Must Automate Processes for Fractional CFO & Accounting firms
- 18. 6 Ways for CFO Firms to Provide Better Client Reporting
- 19. 6 Great Excel Report Templates for Fractional CFOs
- 20. How to Perform Price‑Volume‑Mix (PVM) Analysis in Excel — Free Template
- 21. How to Build a 13‑Week Cash‑Flow Forecast in Excel (Free Template)
- 22. How to Calculate Trailing‑12‑Month (TTM) Metrics in Spreadsheets + Free Template
- 23. How to do Scenario Analysis in Spreadsheets
- 24. Best Practices for Consolidating Financial Statements


Revenue hit $2.3M last month. You budgeted $2.5M. Is that a problem?
Depends. Maybe sales fell short across the board. Or maybe one department overspent while another came in under budget. The top-line variance hides what actually happened.
Budget vs. actual reporting reveals the details behind your numbers. This guide shows you how to build variance analysis that updates itself.
Download the Budget vs. Actual Report Template before you follow along.

What is budget vs. actual reporting variance analysis?
Budget vs actual reporting compares planned financial targets against real results. The difference between budget and actual—the variance—tells you where performance matched expectations and where it didn’t.
Instead of seeing just “expenses over budget by $50K,” you’ll know exactly:
- Which accounts drove the overage
- Whether the variance is improving or getting worse
- How significant the miss is as a percentage of plan
This granular view transforms vague budget discussions into specific action items about spending, revenue, and operational adjustments.
Gather budget and actual reporting data
Traditional analysis starts with export hell. Log into QuickBooks. Download a P&L report. Switch to Excel. Copy and paste. Now do the same for your budget data. Repeat monthly.
Coefficient connectors eliminate this manual process entirely. Pull actual results and budget data directly into your spreadsheet from QuickBooks—no downloads required.
The template expects this data structure:
- Account name or category
- Budget amount by period
- Actual amount by period
- Account type (revenue, expense, etc.)
Set up your chart of accounts mapping
The template’s data structure groups accounts into meaningful categories for analysis. Think “Marketing Expenses,” “Payroll Costs,” and “Software Subscriptions” instead of analyzing 200 individual GL codes.
This grouping step matters. Executives don’t want variance explanations for account #6240-Marketing-Digital-Ads. They want to understand how Marketing vs. Sales spending drove overall results.
Calculate budget vs actual reporting variance amounts and percentages
The formulas behind variance analysis are straightforward, but the template handles all calculations automatically:
Dollar Variance:
Actual Amount – Budget Amount
Percentage Variance:
(Actual – Budget) / Budget × 100
Year-to-Date Variance:
Sum of Actual YTD – Sum of Budget YTD
The template contains these formulas pre-built. Simply connect your data, and watch the variance calculations populate automatically. No need to build complex Excel formulas or worry about calculation errors during month-end close.
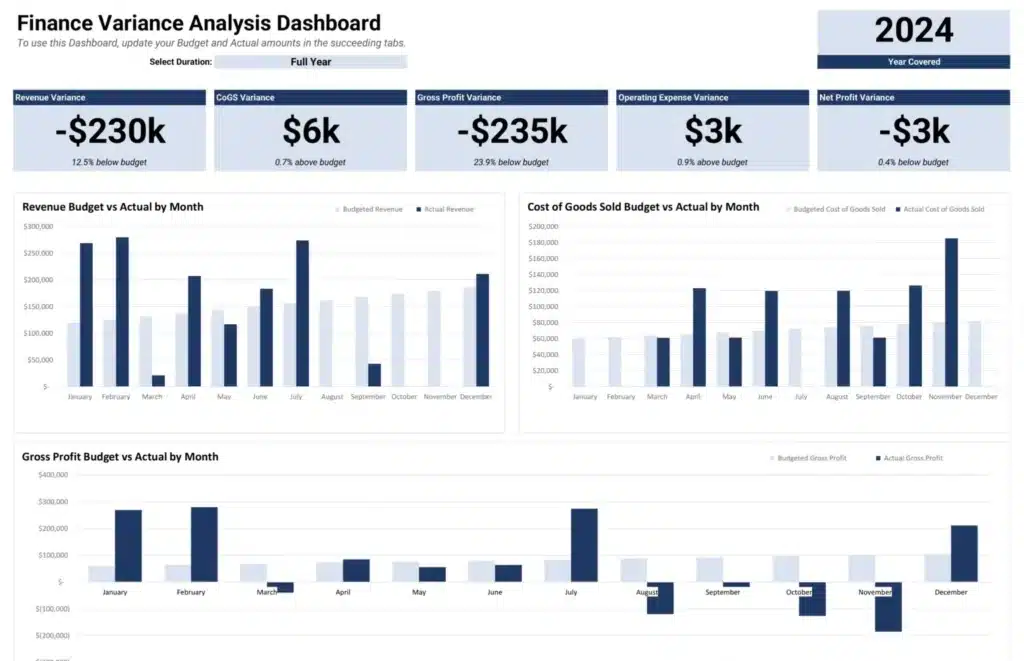
Build the variance dashboard
The template includes visualizations that split total variance into component parts. You’ll see which accounts drove favorable results and which pushed you off plan.
This dashboard design follows financial reporting best practices:
- Variance bars show magnitude of each account’s impact
- Color coding highlights positive vs. negative variances
- Cumulative charts reveal trends across periods
Visualization options
Choose visualization types based on your audience:
- Bar charts work best for comparing variances across accounts
- Waterfall charts help executives see how pieces add to total variance
- Trend lines show whether performance is improving or declining
Coefficient keeps these visuals live as source data refreshes. No more rebuilding charts every month or fixing broken references when accounts change.
Interpret the variances
Raw variance numbers tell only part of the story. Here’s how to read the signals:
Revenue under budget, expenses on track: Sales problem, not spending problem. Investigate why revenue fell short—fewer deals, lower prices, delayed closes. Don’t cut expenses reflexively if the spending generated expected activity.
Revenue on budget, expenses over: Cost control issue. Dig into which expense categories drove the overage. Separate discretionary spending you can cut from fixed costs you can’t.
Both revenue and expenses under budget: Execution miss. You planned to do more than you did. Investigate whether this reflects market conditions, capacity issues, or overly aggressive budgeting.
Large percentage variance on small dollar amount: Context matters. A 50% variance on a $1,000 line item is $500. A 5% variance on a $100,000 line item is $5,000. Focus attention on material amounts.
Drill down by department or class
Add QuickBooks class or location dimensions to isolate specific business units. This analysis reveals which departments drive your variance patterns.
Coefficient automatically pulls class, location, and department dimensions from your accounting system. No manual field mapping required. Filter your variance analysis by department or compare location performance with a single click.
Add prior year comparisons
Layer additional time periods to see Actual vs Budget vs Last Year patterns. Did this month’s expense variance follow seasonal patterns from prior years? How does current revenue compare to the same period last year?
Coefficient imports multiple time periods in one refresh. Build three-way variance analysis without managing separate data imports or version control headaches.
Use these formulas for prior year comparison:
Year-over-Year Change:
(Current Year Actual – Prior Year Actual) / Prior Year Actual × 100
Budget vs Prior Year:
Budget – Prior Year Actual
This shows whether your budget was realistic based on historical performance.
Automate refresh and alerts with Coefficient
Schedule monthly data pulls from QuickBooks. Set Slack or email alerts when variances exceed acceptable thresholds.
For finance teams managing monthly close processes, this automation transforms variance analysis from a manual exercise into an ongoing monitoring system. Your reports update automatically without any manual work.
Example alert conditions:
- Expense variance exceeds 10% of budget
- Revenue falls below 90% of plan
- Any account variance exceeds $25,000
- YTD variance trends negative for three consecutive months
Turn variance into action
Budget vs. actual analysis transforms basic “over/under budget” reports into actionable financial intelligence. Understanding which accounts drive variance—and whether the pattern is improving—enables targeted business decisions.
The template eliminates hours of manual data gathering while providing professional-grade analysis capabilities. Whether you’re a CFO preparing board presentations or a controller managing monthly close, automated variance analysis delivers the insights leadership needs.
Ready to see where your budget stands? Get started with our free template and connect your QuickBooks data for variance analysis that refreshes on your schedule.
FAQs
How do you calculate budget vs actual variance?
Variance equals Actual minus Budget. For percentage variance, divide the dollar variance by budget and multiply by 100. Positive variance on revenue means you exceeded plan. Positive variance on expenses means you overspent.
What is a good budget variance percentage?
Most organizations target variances within 5-10% of budget. Acceptable thresholds depend on your industry, account type, and business stage. Revenue accounts often have tighter tolerances than discretionary expense categories.
How often should you review budget vs actual reports?
Monthly reviews catch problems early enough to course-correct. Weekly reviews make sense for fast-moving expense categories or during critical business periods. Quarterly reviews work for stable, predictable accounts.
Can QuickBooks generate budget vs actual reports?
Yes, QuickBooks offers a built-in Budget vs Actual report. However, it lacks custom variance calculations, multi-period comparisons, and flexible visualization options. The Coefficient template extends QuickBooks reporting with automated analysis capabilities.