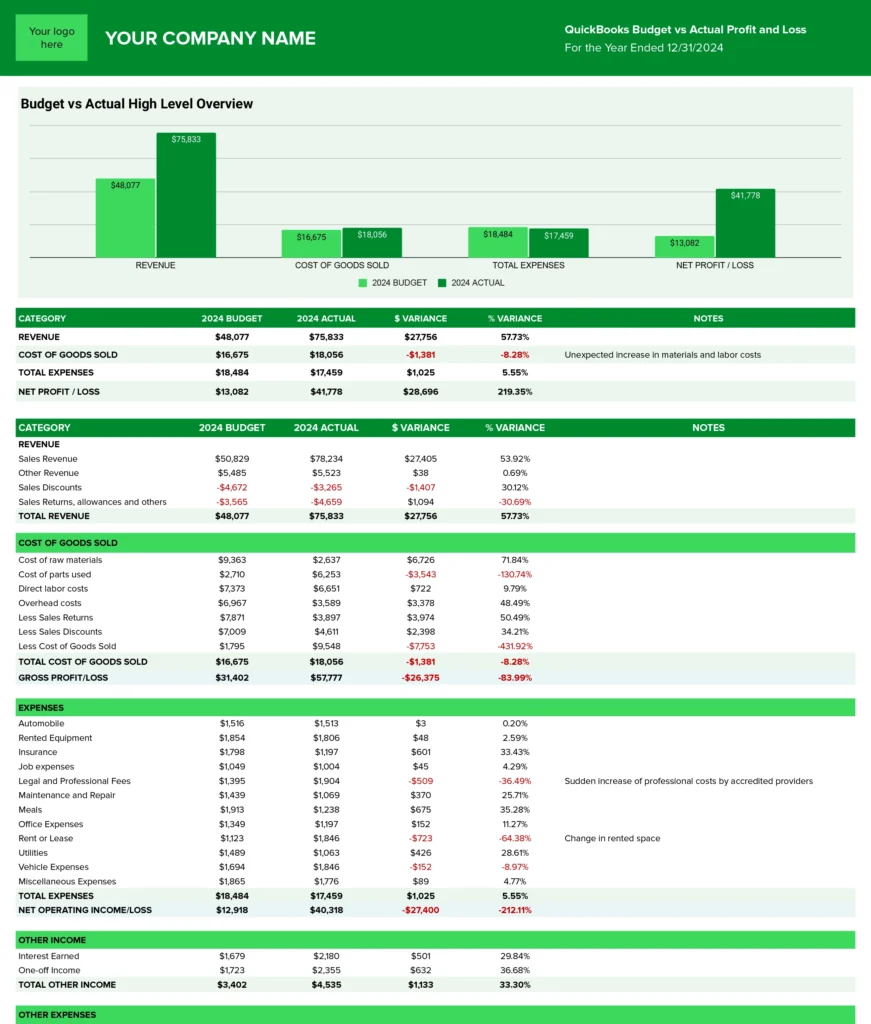
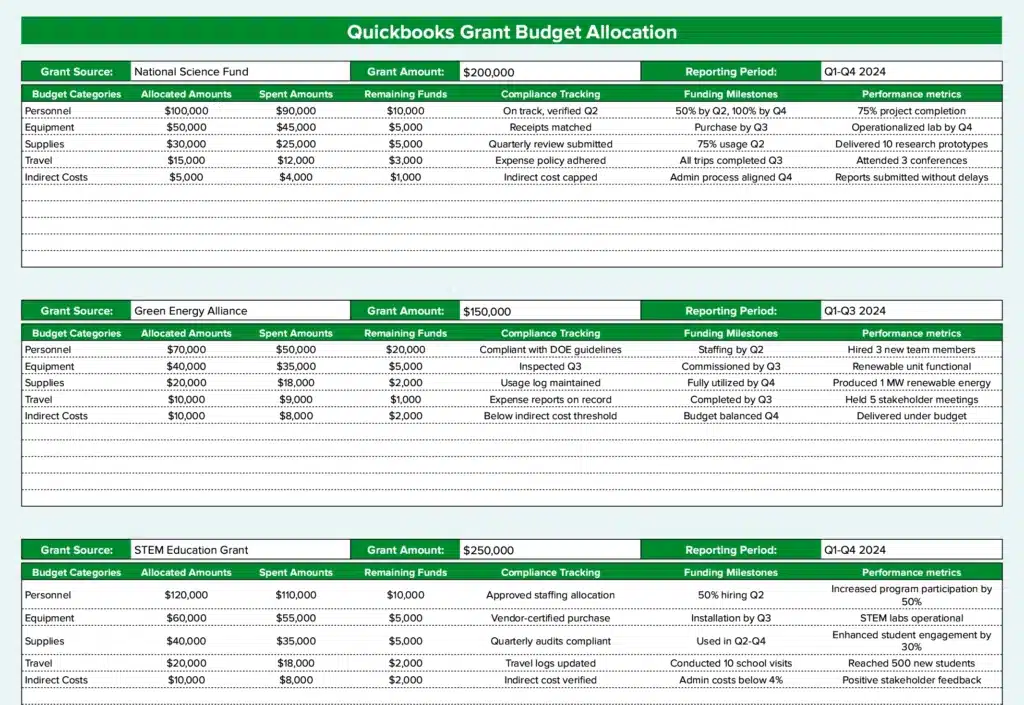
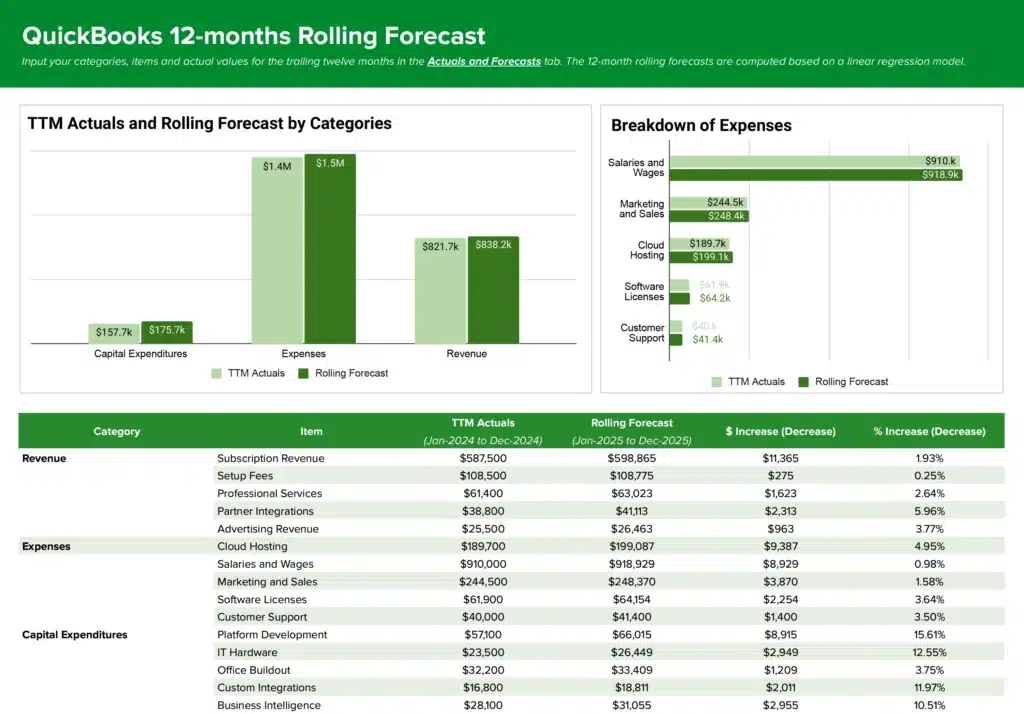
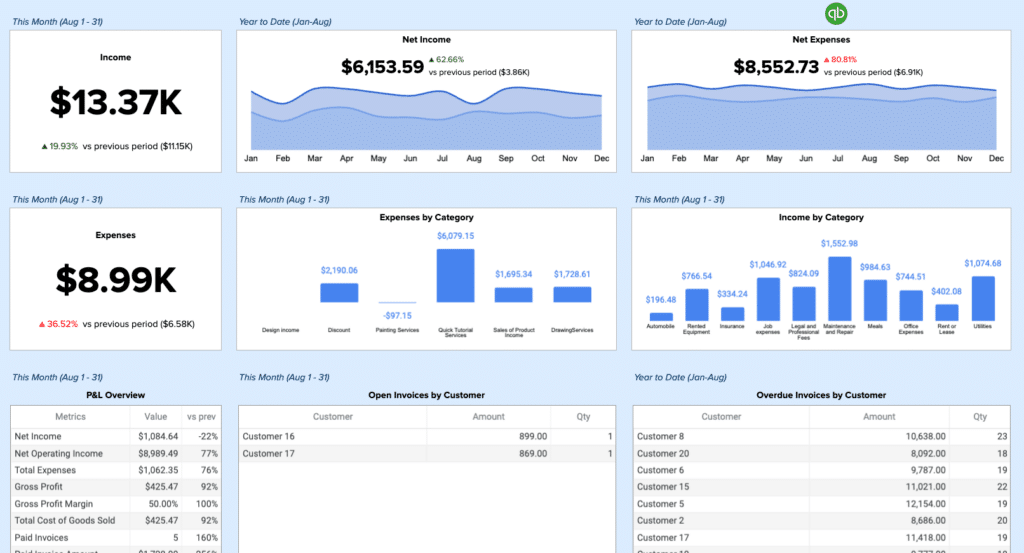
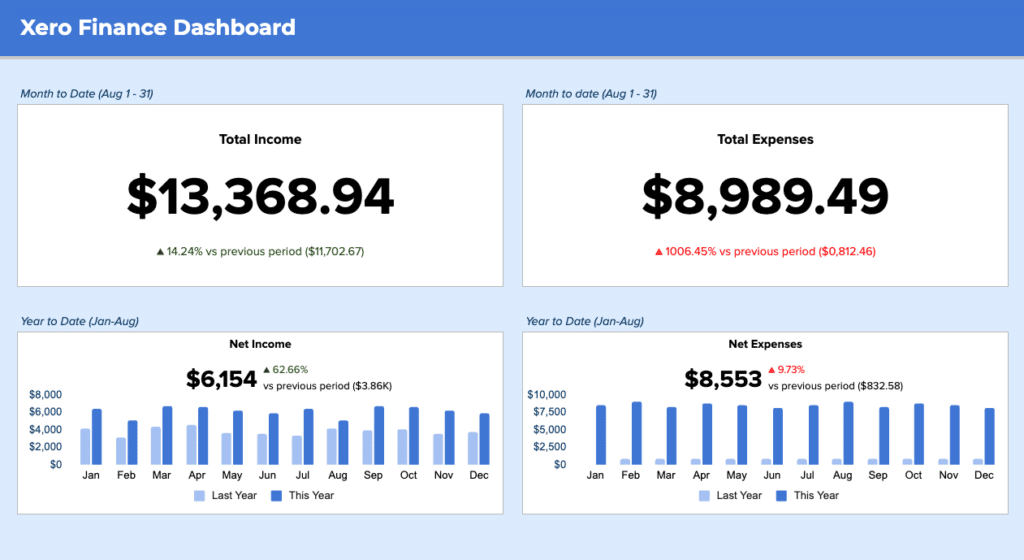
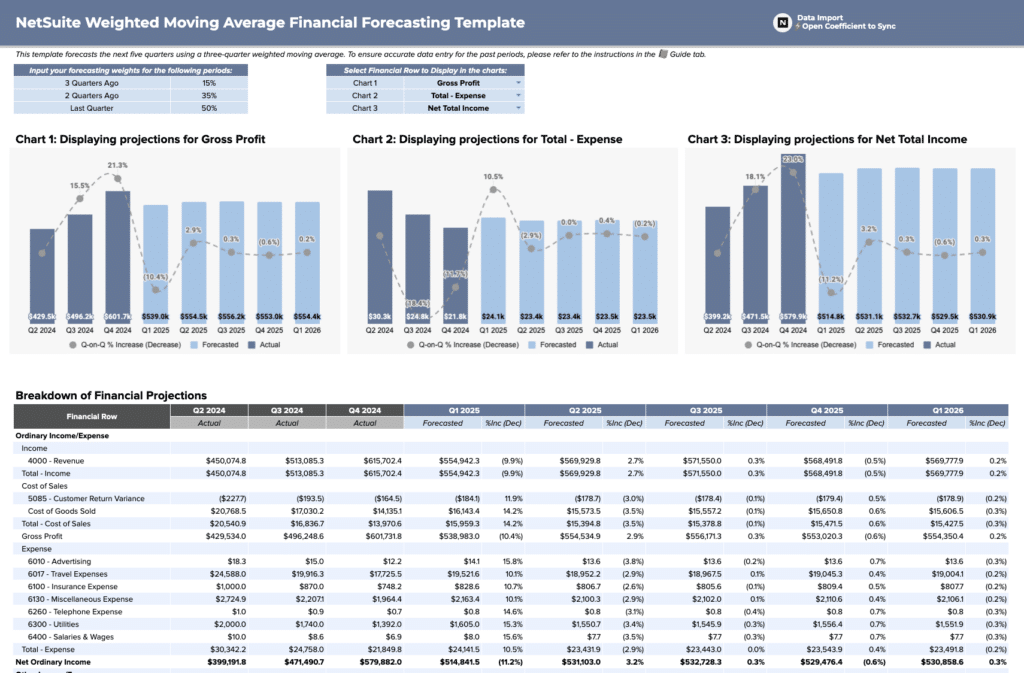
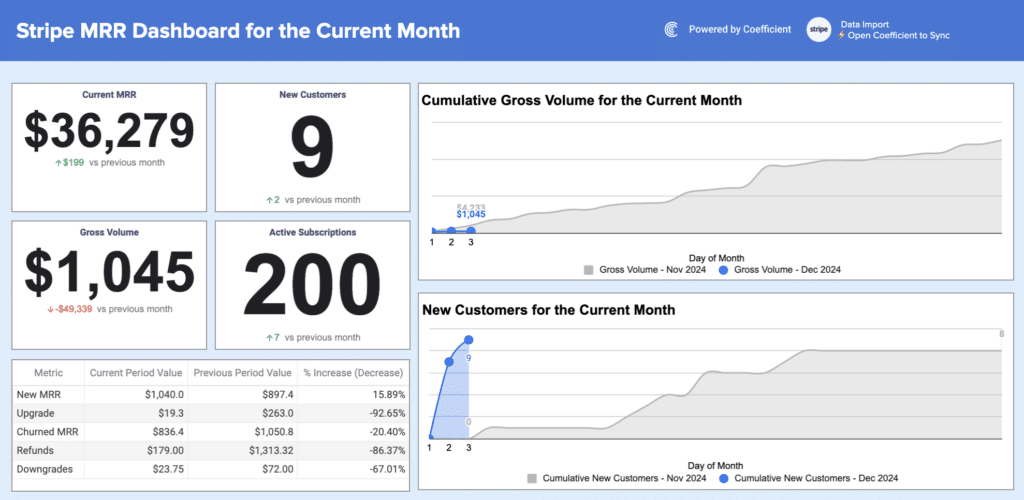
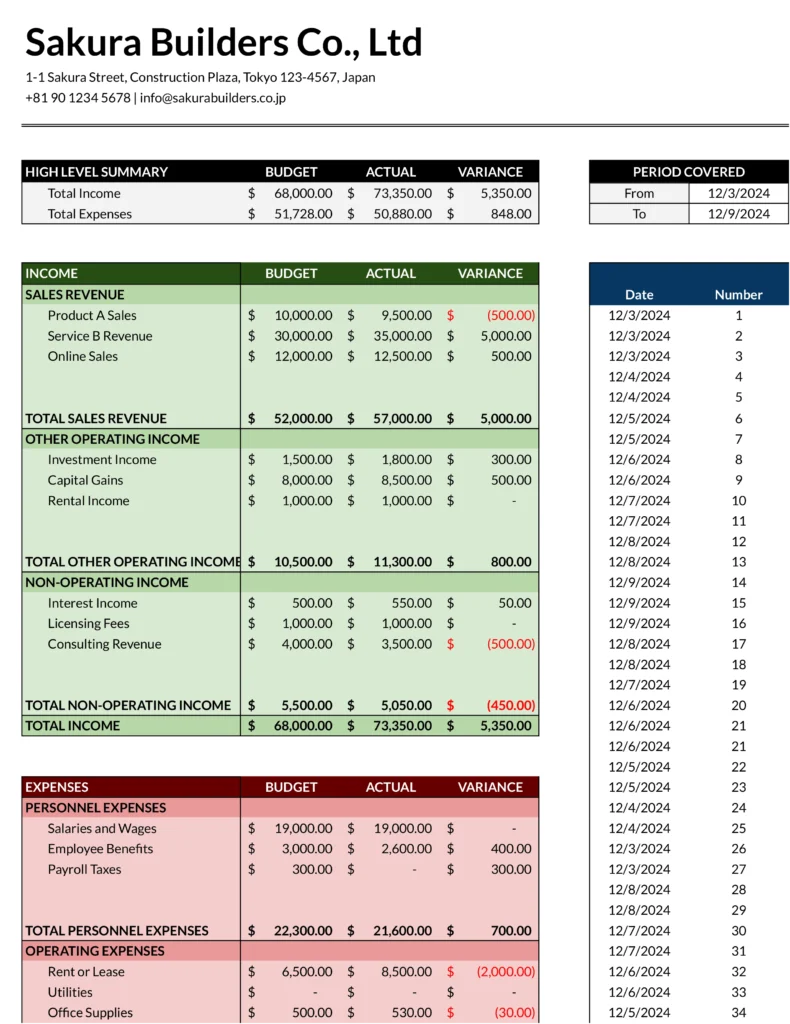
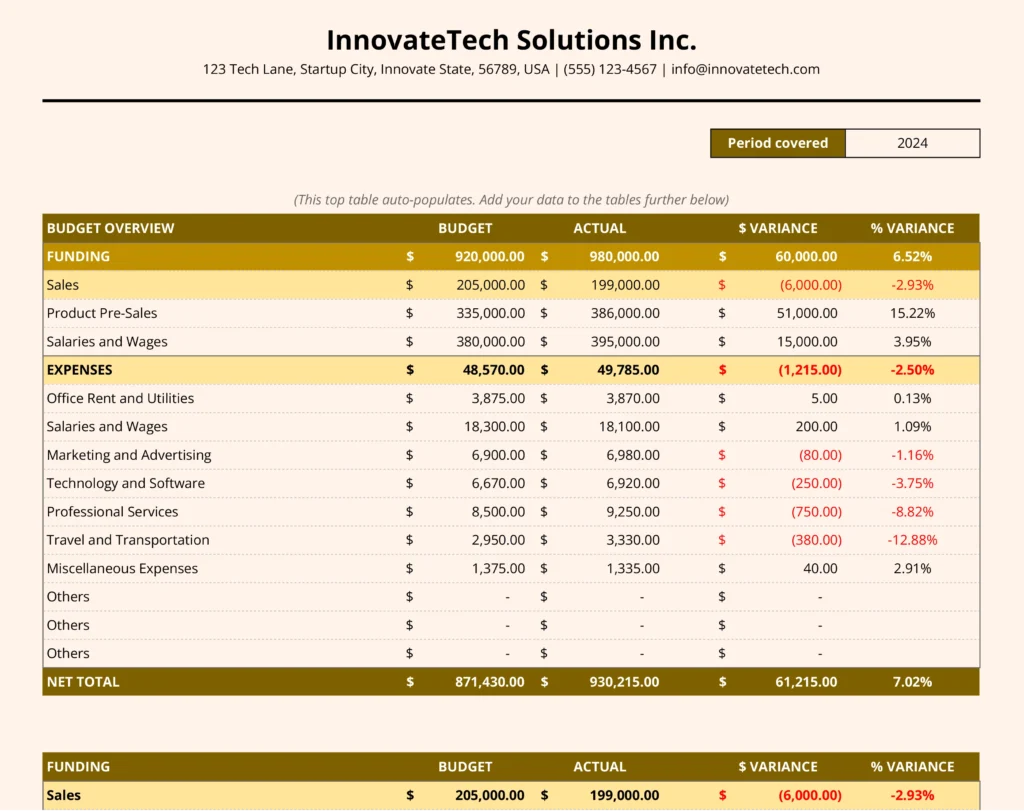
Comparing budgets to actual financial results can be time-consuming and error-prone. Coefficient’s free Budget vs. Actual Report template for QuickBooks simplifies this process, providing real-time data and automated updates to help you make informed financial decisions quickly.
What is a Budget vs. Actual Report?
A Budget vs. Actual Report is a financial tool that compares planned budgets with actual financial results. This report highlights variances between expected and real-world performance, allowing businesses to:
- Identify discrepancies in revenue and expenses
- Understand the reasons behind budget variations
- Make data-driven adjustments to financial strategies
- Improve future budget forecasting accuracy
By regularly reviewing this report, companies can stay on top of their financial health and make timely decisions to keep their business on track.
Who is the Budget vs. Actual Report Template Built For?
This template is designed for:
- Financial managers and CFOs
- Small to medium-sized business owners
- Accounting professionals
- Budget analysts
- Project managers overseeing financial aspects
Anyone responsible for monitoring financial performance and making budget-related decisions will find this template invaluable.
What is the Primary Use Case for the Budget vs. Actual Report Template?
The main purpose of this template is to provide a clear, real-time comparison between budgeted and actual financial figures. It helps users:
- Quickly identify variances in revenue and expenses
- Analyze the reasons behind these variances
- Make informed decisions to address discrepancies
- Adjust future budgets based on historical performance
- Communicate financial status to stakeholders effectively
Benefits of Using the QuickBooks Budget vs. Actual Report Template
- Real-time data updates: The template automatically syncs with your QuickBooks data, ensuring you always have the most current information.
- Time-saving automation: Eliminate manual data entry and reduce the risk of errors with automated report generation.
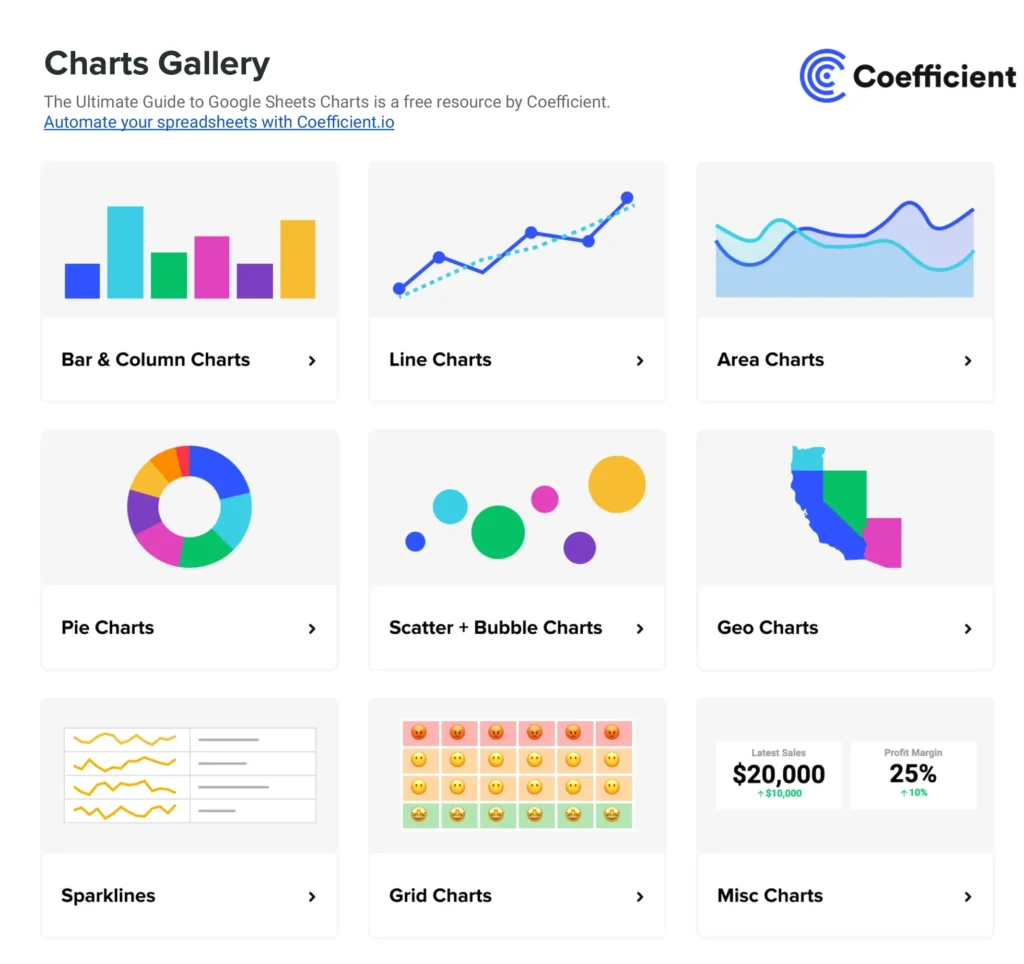
- Customizable visualizations: Create charts and graphs that make it easy to understand and present financial data.
- Improved decision-making: Gain quick insights into your financial performance to make timely, informed choices.
- Enhanced forecasting: Use historical data to refine future budget projections and improve financial planning.
Metrics Tracked in the Report
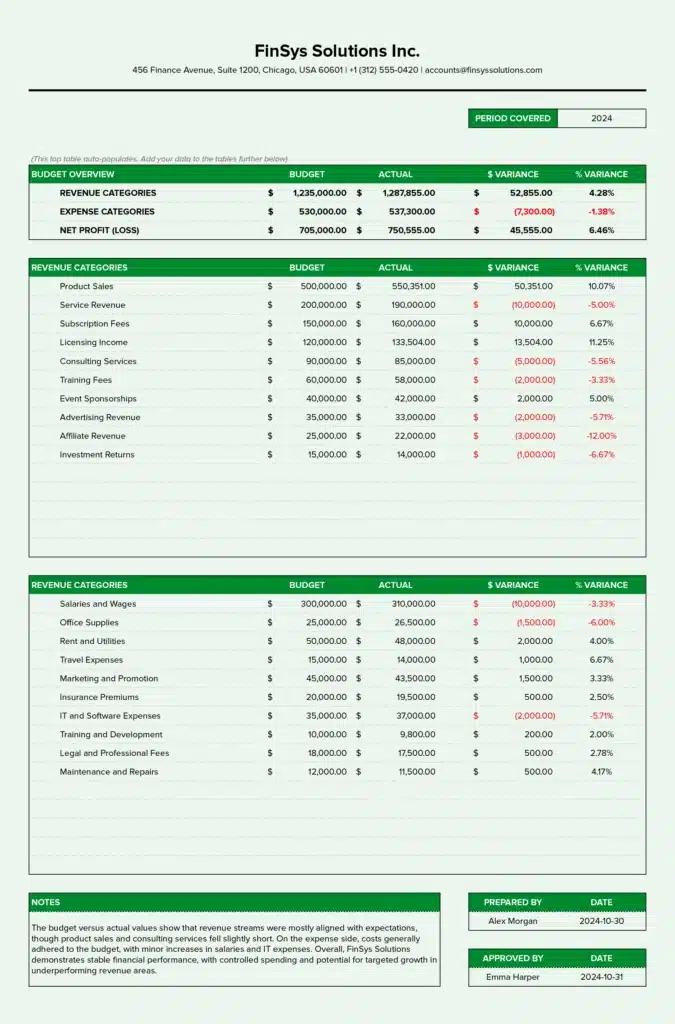
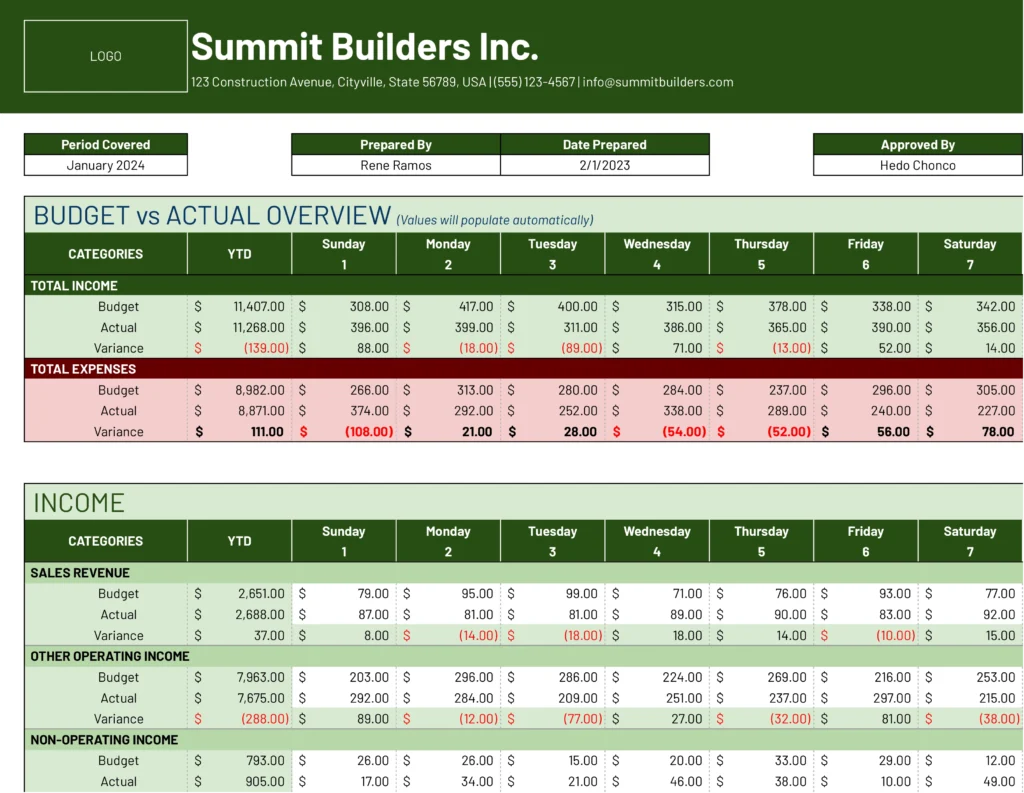
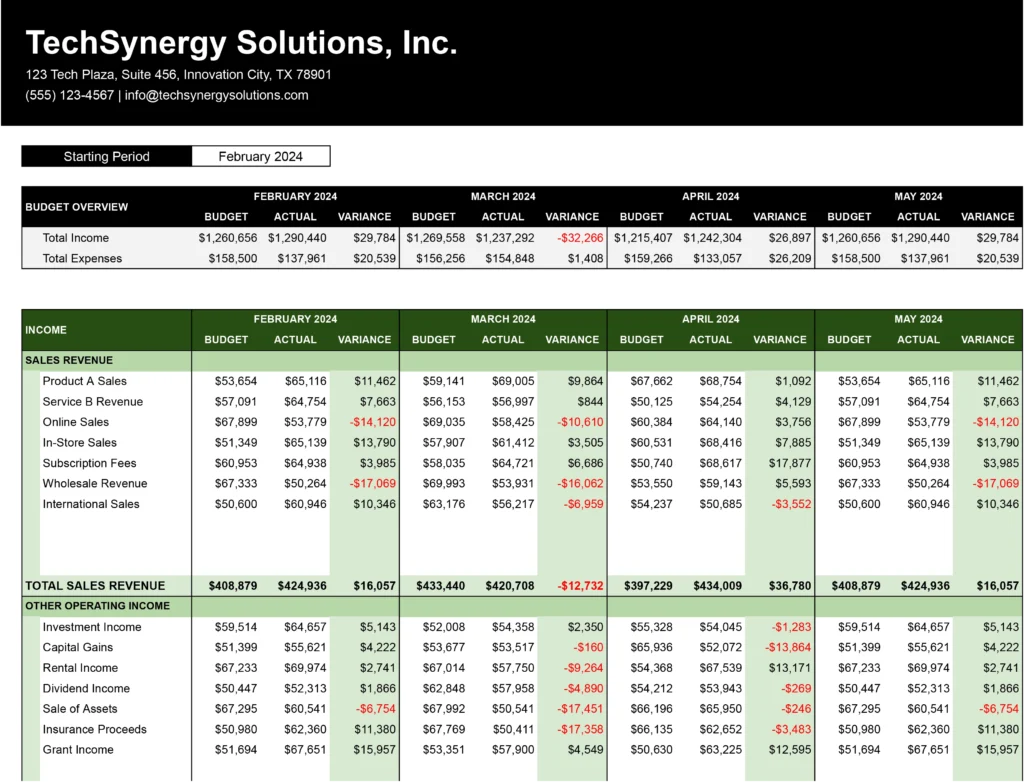
- Budget Categories (Revenue and Expenses by type)
- Budgeted Amount
- Actual Amount
- Variance Amount
- Variance Percentage
- Cumulative Budget vs. Actual
- Graphical Representations (Charts/Graphs)
- Notes/Explanations for Variances
More Metrics to Track and Analyze on Google Sheets
With Coefficient’s QuickBooks integration, you can pull additional data into your Google Sheets, including:
- Profit & Loss by Class
- Expenses by Vendor
- Profit & Loss by Month & Class
- Consolidated P&L
- Profit & Loss – Month-over-Month Growth
- Live Accounts Payable Dashboard
- Live Accounts Receivable Dashboard
You can also:
- Connect to multiple companies
- Choose from various report types
- Drill down into specific data points
- Automatically consolidate reports
- Sort data by Department or Location
