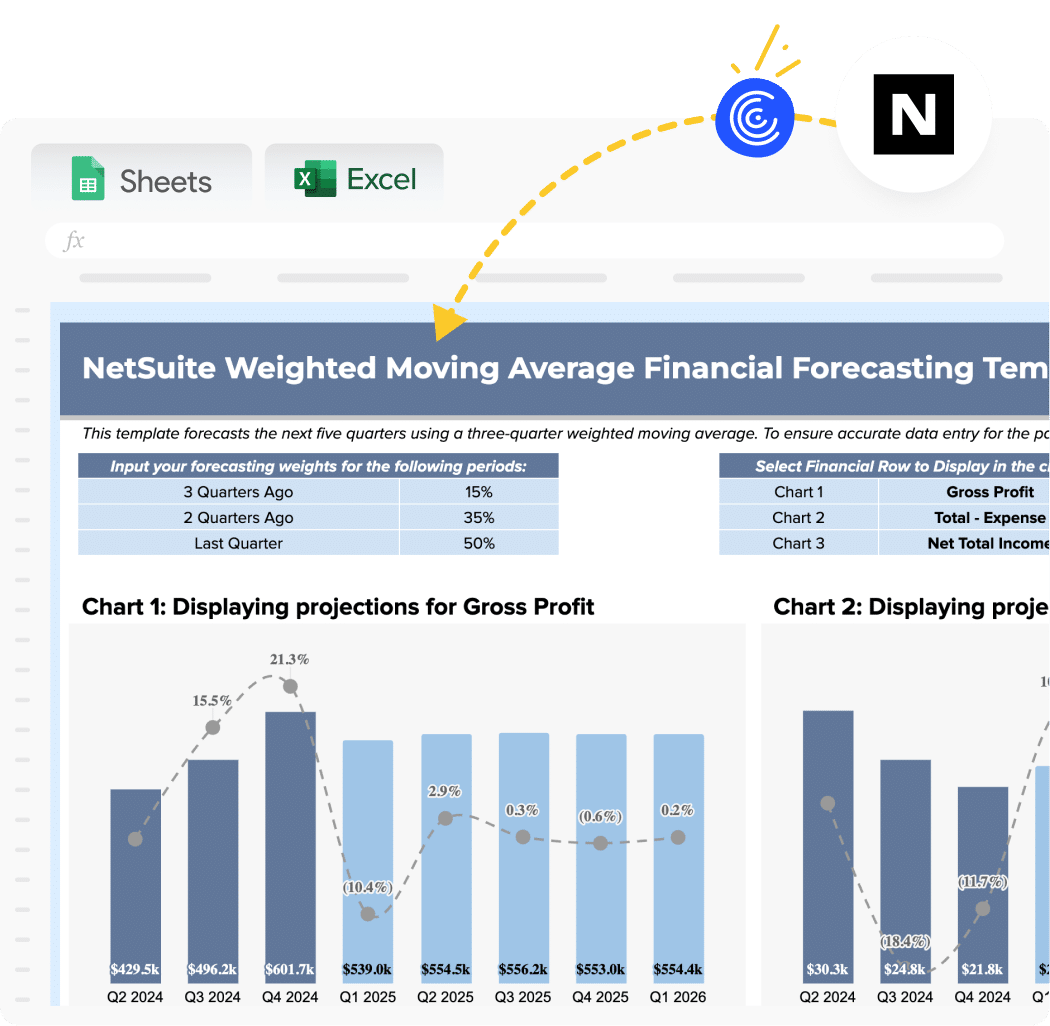

Financial forecasting in NetSuite can be complex and time-consuming. Coefficient’s free NetSuite financial forecasting template simplifies the process, allowing you to make data-driven decisions with real-time insights.
Metrics tracked in the template
- Net Income – Track your bottom-line profitability projections
- Changes in Working Capital – Monitor liquidity and operational efficiency
- Depreciation and Amortization – Account for non-cash expenses in forecasts
- Accounts Receivable – Project incoming cash from customer payments
- Accounts Payable – Forecast outgoing obligations to vendors
- Deferred Taxes – Plan for future tax liabilities
- Cash From Sale Of Capital Assets – Track cash inflows from asset disposals
- Cash Paid for Purchase Of Capital Assets – Monitor capital expenditure forecasts
- Increases in All Other Long-Term Assets – Project long-term investment growth
How to use the NetSuite forecasting template
Getting started with the template is straightforward. No complex setup or technical expertise required.
Step 1: Get the template. Copy the template to your Google Sheets account. The pre-built structure includes all necessary formulas and formatting.
Step 2: Install Coefficient. Add the Coefficient add-on to your Google Sheets. Find it in the Google Workspace Marketplace and authorize the installation.
Step 3: Connect your NetSuite account. Launch Coefficient and connect to NetSuite through the sidebar. Your admin will complete the one-time OAuth setup to enable secure data access.
Step 4: Import your financial data. Select the data sources you need from NetSuite. The template pulls from your general ledger, income statements, and cash flow reports automatically.
Step 5: Configure automatic refresh schedules. Set up hourly, daily, or weekly data refreshes. Your forecasts update with current NetSuite data without manual intervention.
Step 6: Customize for your business needs. Adjust forecast periods, add custom metrics, or modify visualizations to match your reporting requirements.
Who is this template built for?
- Finance teams managing monthly close processes. CFOs and finance managers who need accurate projections for board meetings and strategic planning sessions. The template eliminates hours of manual consolidation work.
- FP&A analysts building executive dashboards. Financial planning teams that require real-time visibility into forecast accuracy. Track actuals against projections without rebuilding reports each cycle.
- Controllers preparing cash flow projections. Accounting leaders who need to monitor working capital and liquidity positions. The template provides instant visibility into cash position forecasts.
- Small business owners making growth decisions. Entrepreneurs who need professional-grade financial forecasting without enterprise software costs. Get institutional-quality analysis in familiar spreadsheet tools.
- Department heads managing budgets. Operations and sales leaders who need to understand financial constraints and opportunities. Share forecasts across teams without complex report distribution systems.
Benefits of using this template
Time-saving automation. Eliminate the need for manual data collection and consolidation, freeing up your finance team to focus on analysis and strategic planning.
Real-time data integration. The template syncs directly with your NetSuite account, ensuring your forecasts are always based on the most up-to-date financial information.
Improved accuracy. By leveraging NetSuite’s robust financial data and Coefficient’s powerful analytics, you can create more precise forecasts and reduce errors associated with manual data entry.
Enhanced collaboration. Share real-time forecasts with stakeholders across your organization, fostering better communication and alignment on financial goals.
Customizable insights. Tailor the template to your specific business needs, allowing you to focus on the metrics that matter most to your organization.
More metrics tracked
With Coefficient’s NetSuite integration, you can expand your financial analysis beyond the template’s core metrics. Here are additional data points you can pull and analyze:
- Revenue by product line or service category
- Gross profit margins
- Operating expenses breakdown
- Customer acquisition costs
- Customer lifetime value
- Inventory turnover ratio
- Days sales outstanding (DSO)
- Return on investment (ROI) for various projects or initiatives
What is financial forecasting?
A financial forecasting report is a strategic tool that projects an organization’s future financial performance based on historical data, market trends, and economic factors. It typically includes predictions for key financial metrics such as revenue, expenses, cash flow, and profitability. This report helps businesses make informed decisions, set realistic goals, and identify potential challenges or opportunities in advance.
Financial forecasting is crucial for businesses of all sizes, as it provides a roadmap for financial planning, budgeting, and resource allocation. By using a NetSuite financial forecasting template, companies can leverage their existing financial data to create accurate, timely projections that drive strategic decision-making.