Connect Salesforce to Google Sheets and keep your pipeline in view
Coefficient pulls your Salesforce reports into Google Sheets and refreshes them on a schedule, so your pipeline numbers are current every time you open the sheet.
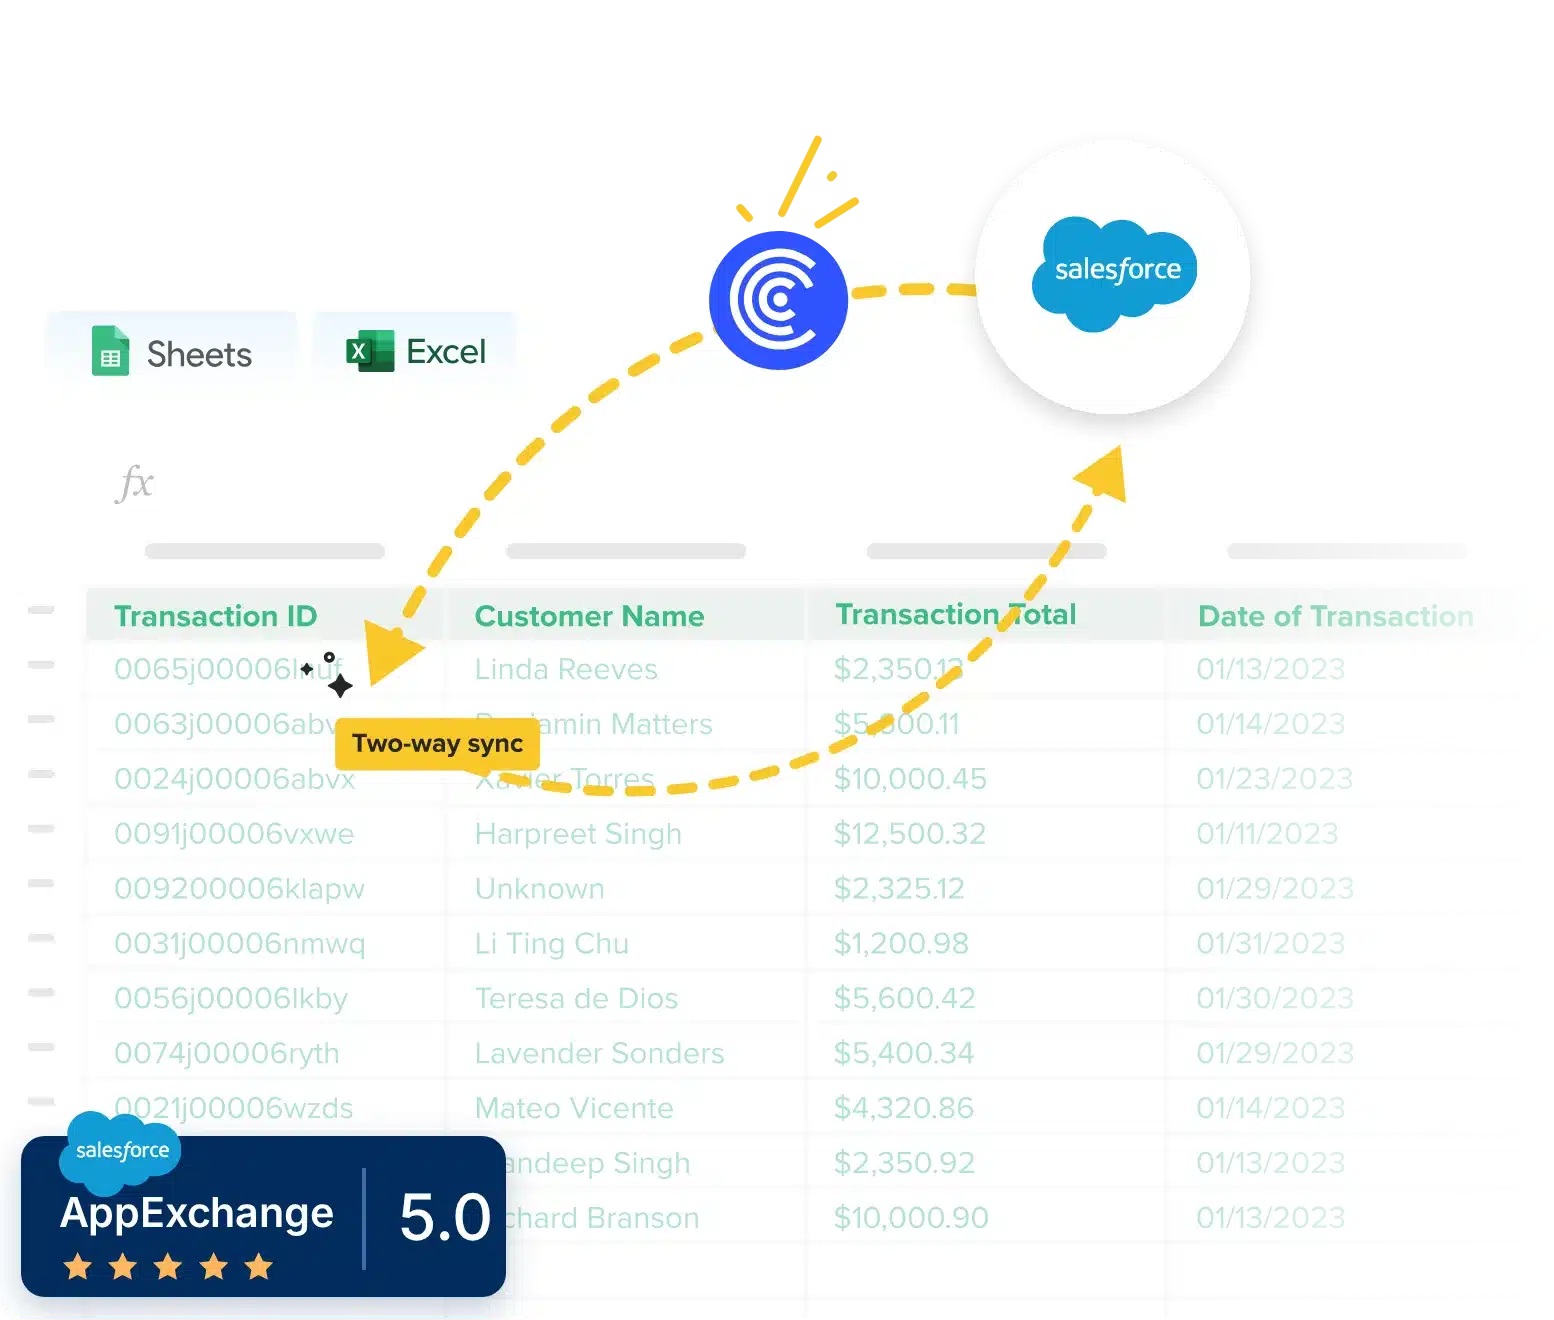

Trusted by 700,000+ users


How to connect Salesforce to Google Sheets
Your Salesforce admin installs Coefficient in your org once. After that, each teammate signs in with their own Salesforce login and imports reports into Google Sheets.
1. Install Coefficient

Install the Coefficient add-on from Google Workspace Marketplace and open it from the Extensions menu in Google Sheets.

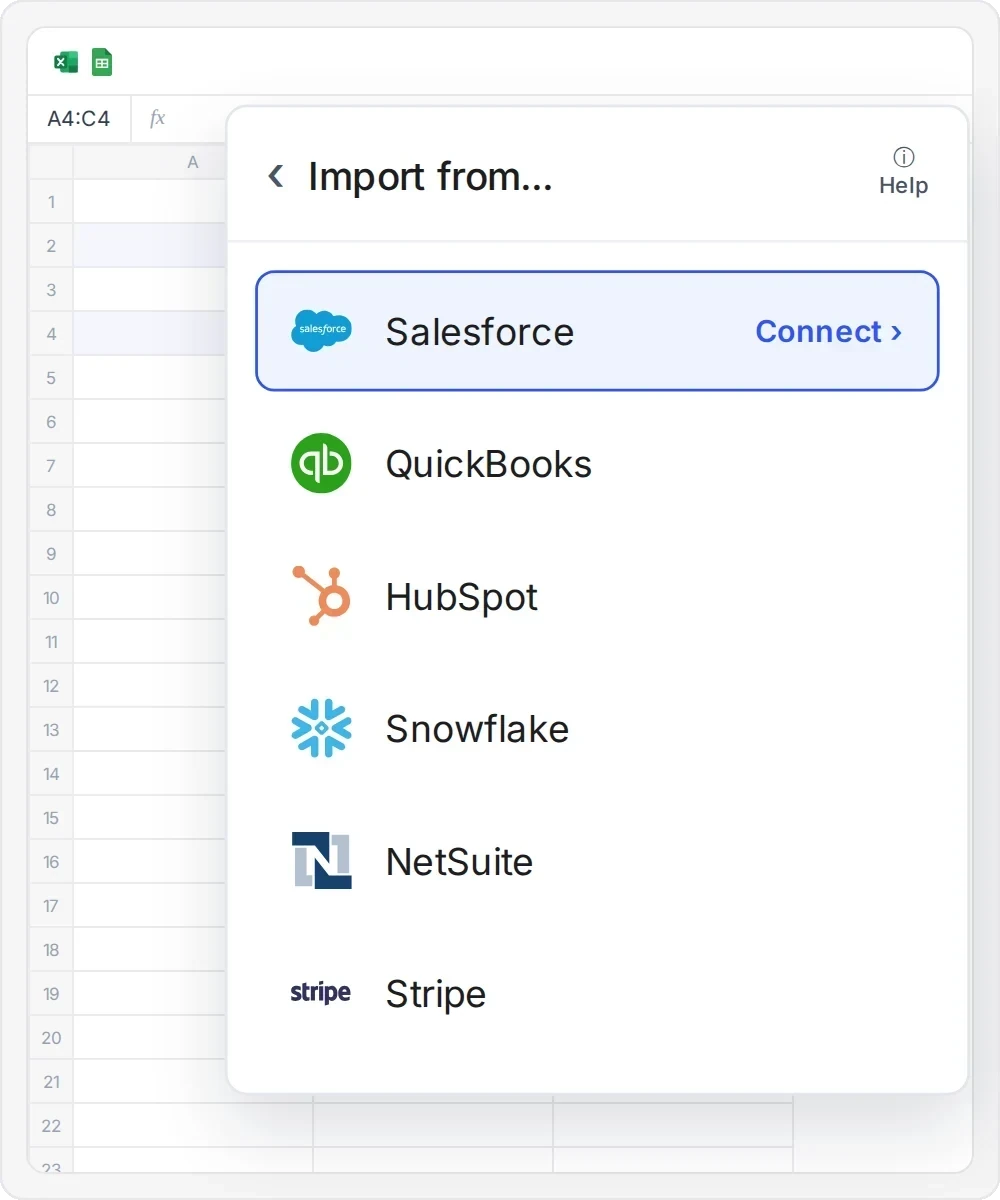
2. Connect Salesforce
Your Salesforce admin installs the Coefficient connected app once. Then your team signs in and starts importing. See the admin setup.
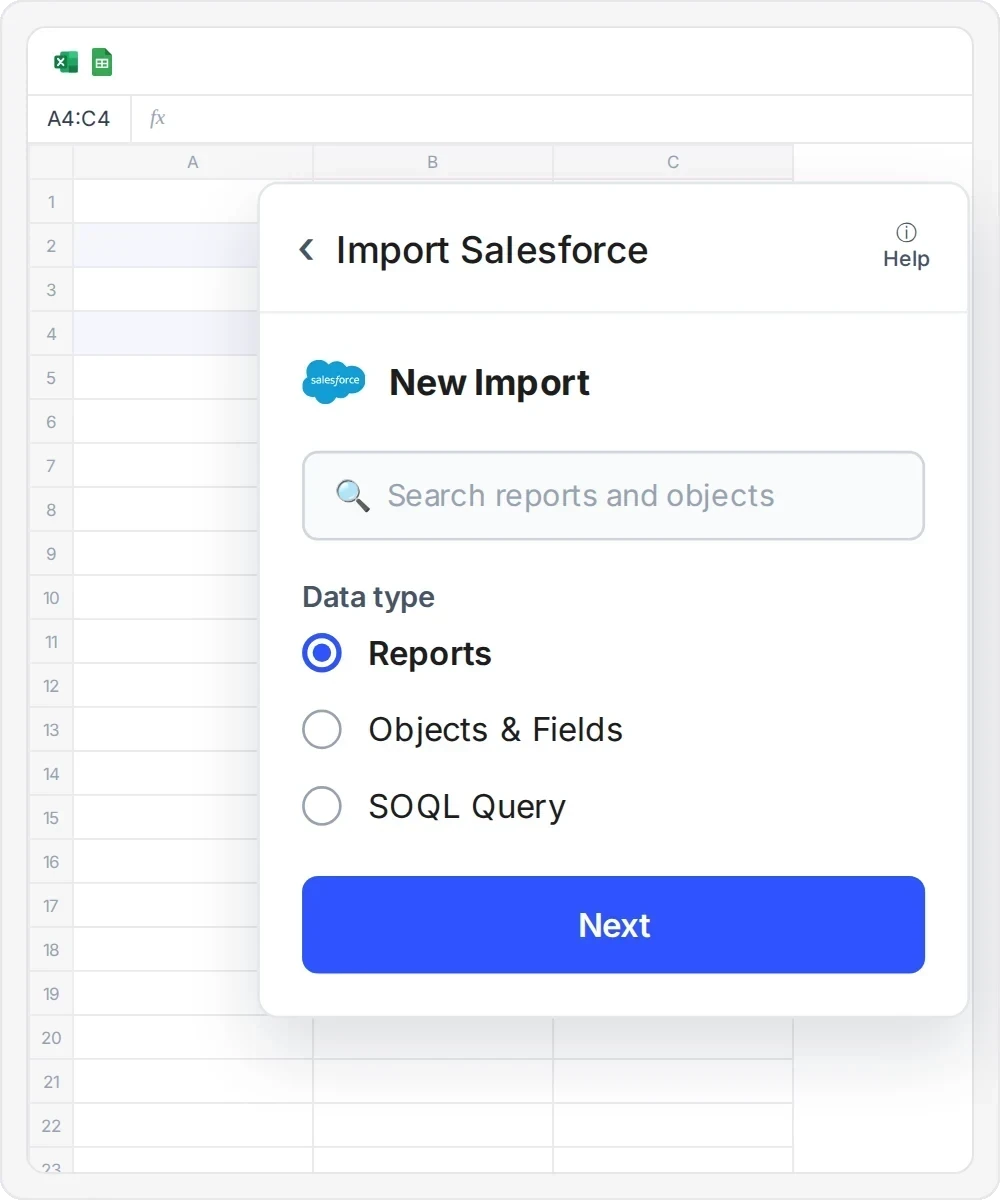
3. Choose your data
Pick a report, select objects and fields, or write your own SOQL query.
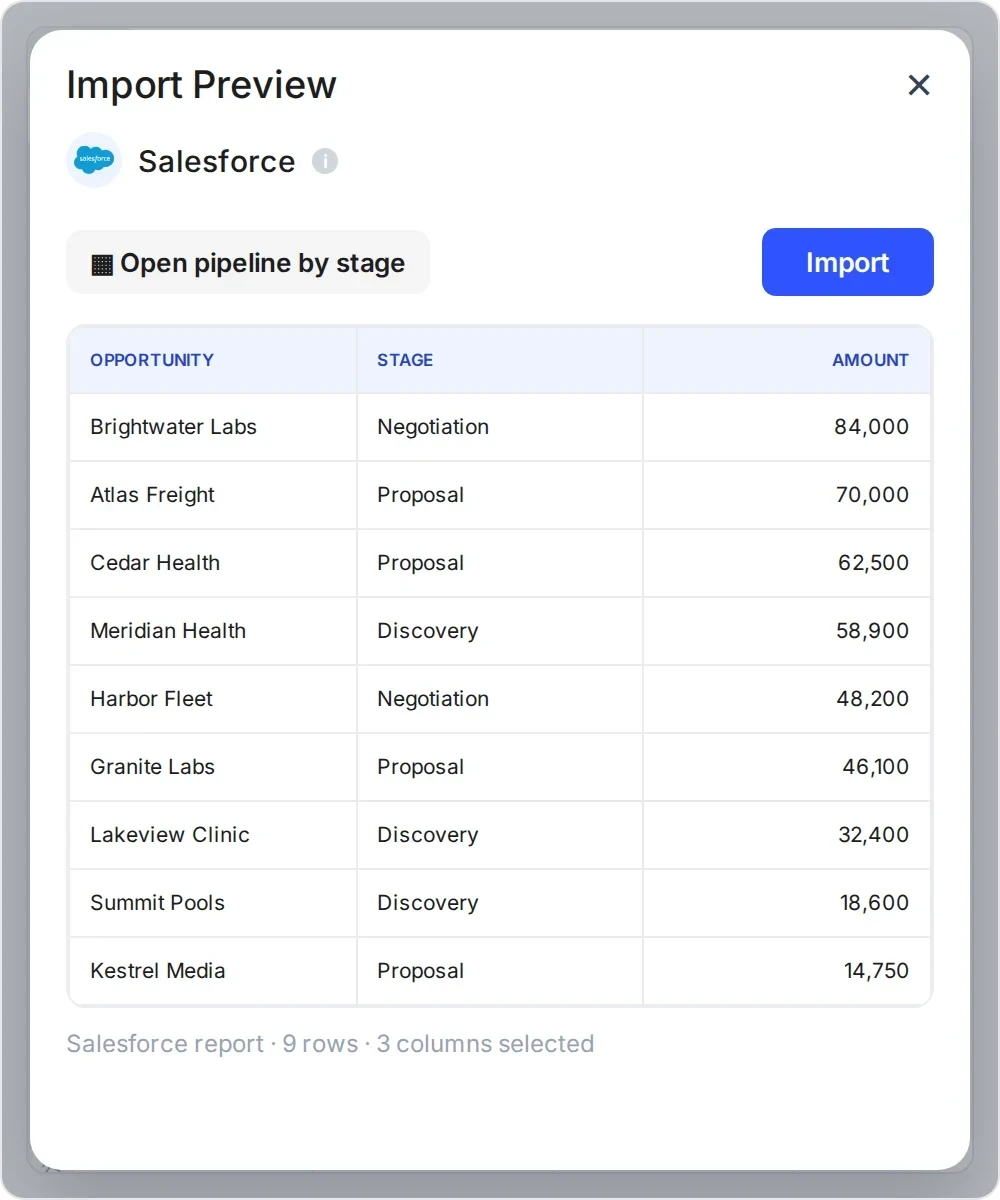
4. Preview and import
Check the preview, then import the results into your sheet.
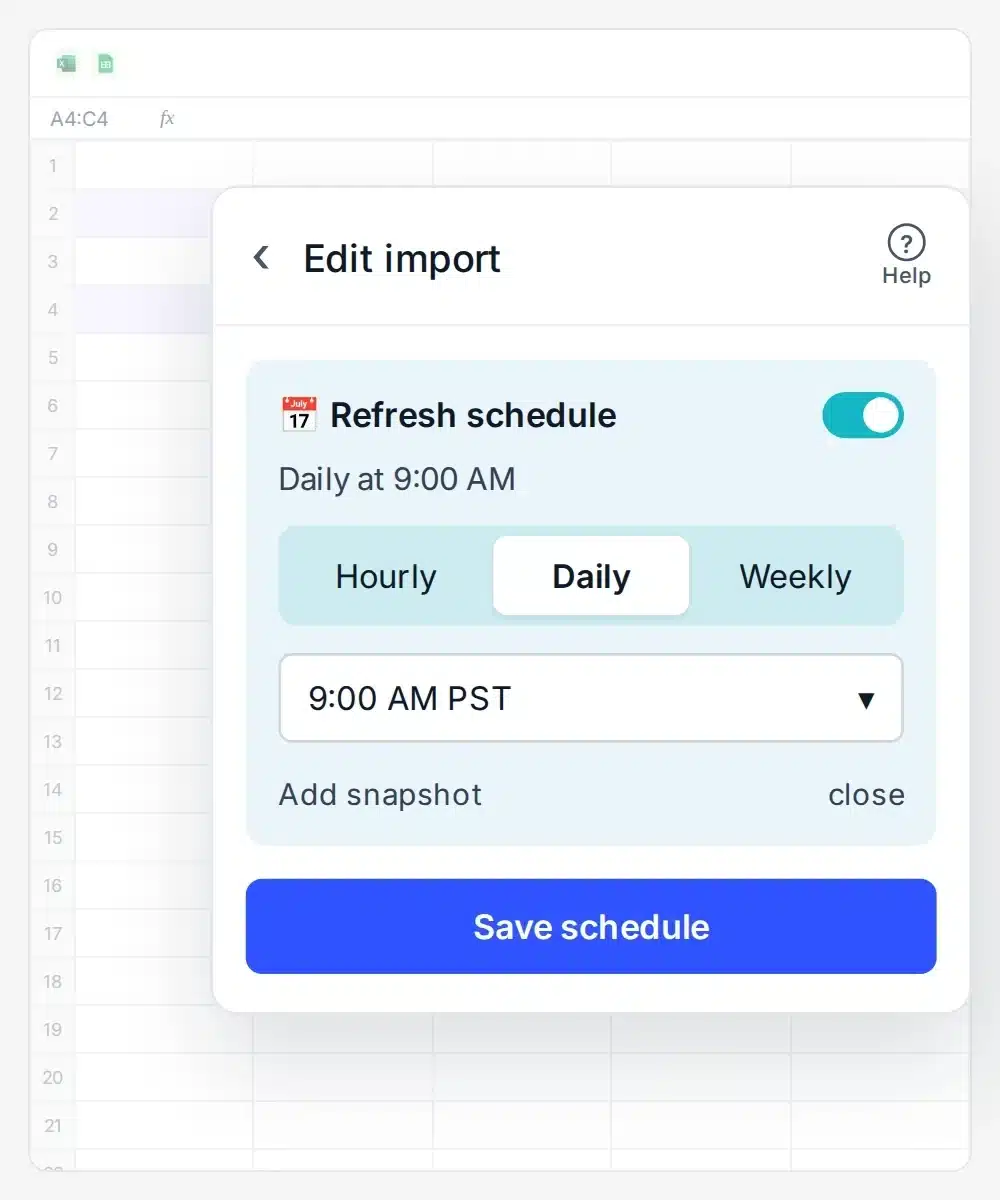
5. Schedule auto-refresh
Set the import to refresh hourly, daily or weekly, or refresh it yourself whenever you need the latest numbers.
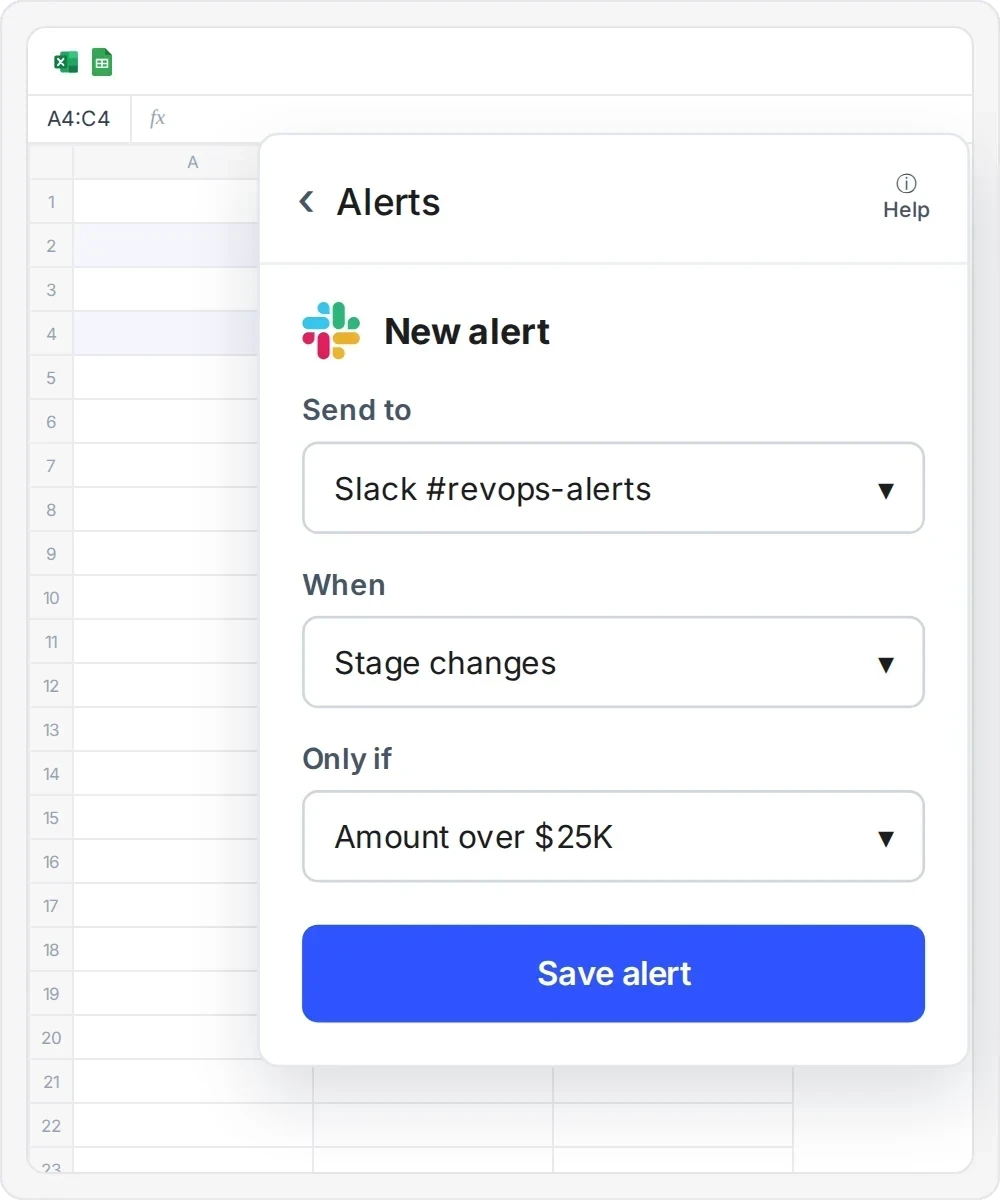
6. Set up alerts
Get Slack or email alerts when key numbers change. Monitor pipeline targets, commissions and more.
Ways to import Salesforce data into Google Sheets
Pick a report, choose objects and fields, or write your own SOQL
 Sheets
 Excel
Same imports in Google Sheets and Excel
Sales Pipeline
Open deals by stage, owner and close date.Lead Source
Leads and conversions by channel.Opportunity by Rep
Deal count and value per rep.Closed Won vs. Closed Lost
Win and loss trends by period.Sales Forecast
Commit and best case by quarter.Customer Lifetime Value
Revenue per account over time.Accounts by Industry
Account mix across industries.Top Accounts by Revenue
Your biggest accounts, ranked.Campaign Performance
Responses and pipeline by campaign.
Account
Firmographics, owners and hierarchy.Opportunity
Every deal field, standard and custom.Lead
Source, status and conversion.Contact
People, roles and account links.Campaign
Budget, status and dates.Campaign Member
Who responded to each campaign.Task and Event
Calls, emails, meetings and to-dos.User
Reps, roles and managers.Custom Objects
Any object your team built.
Custom SOQL queries
Your own query with the fields and filters you need.Salesforce formulas
=salesforce_search and =salesforce_report_search in any cell.

Salesforce is not the greatest at historical reporting. But seeing how a pipeline has changed week-over-week is super easy to do in Coefficient.

Historical snapshots
See what your Salesforce pipeline looked like last quarter
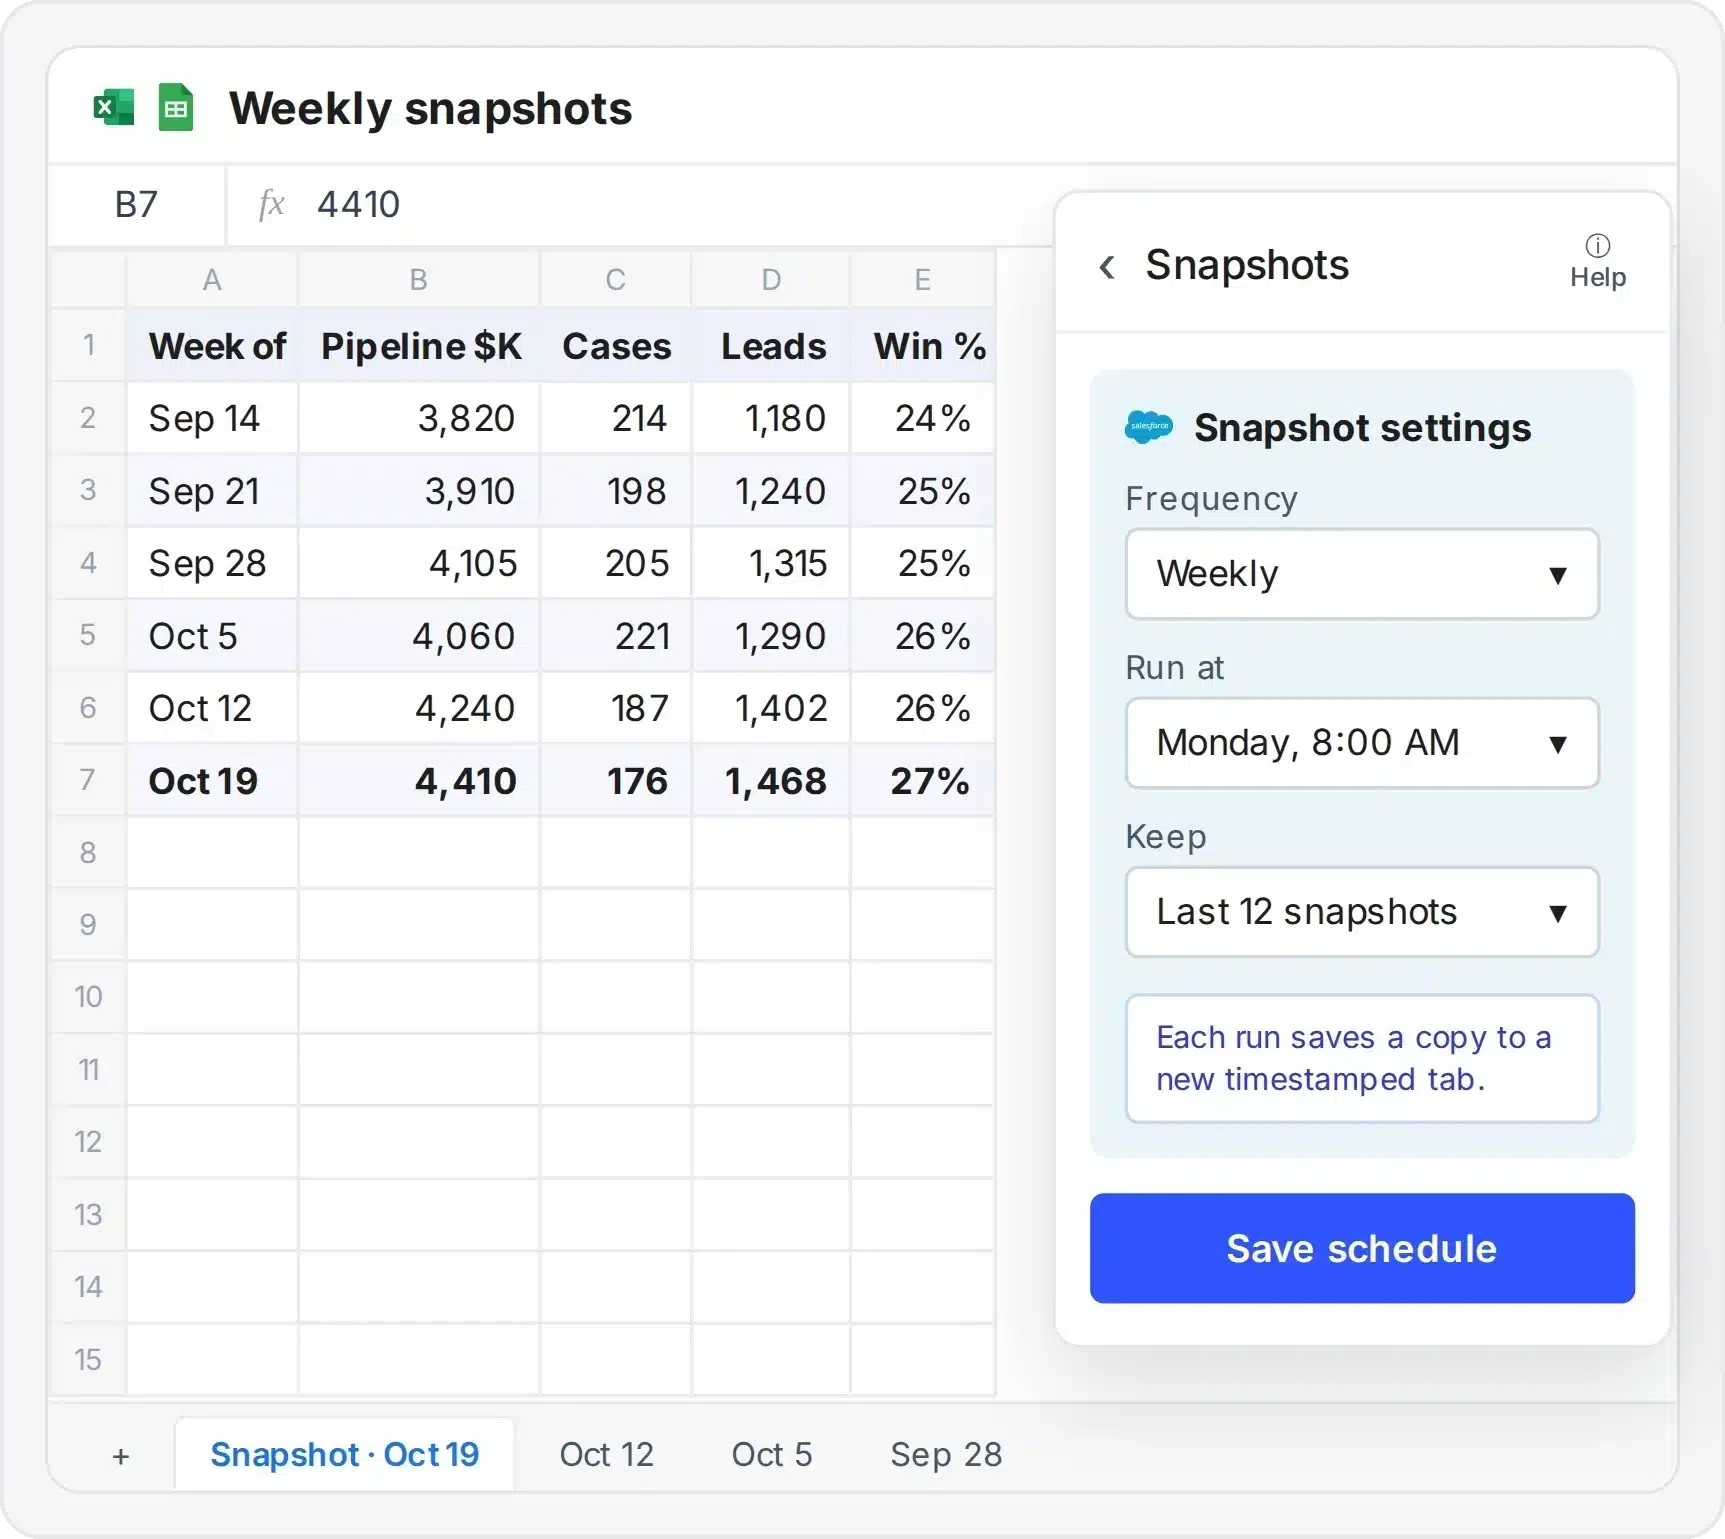
- Save each refresh to a new dated tab
- Compare deal stages and close dates week over week
- Track how deals moved, not just where they are now
Two-way sync
Update Salesforce records from Google Sheets
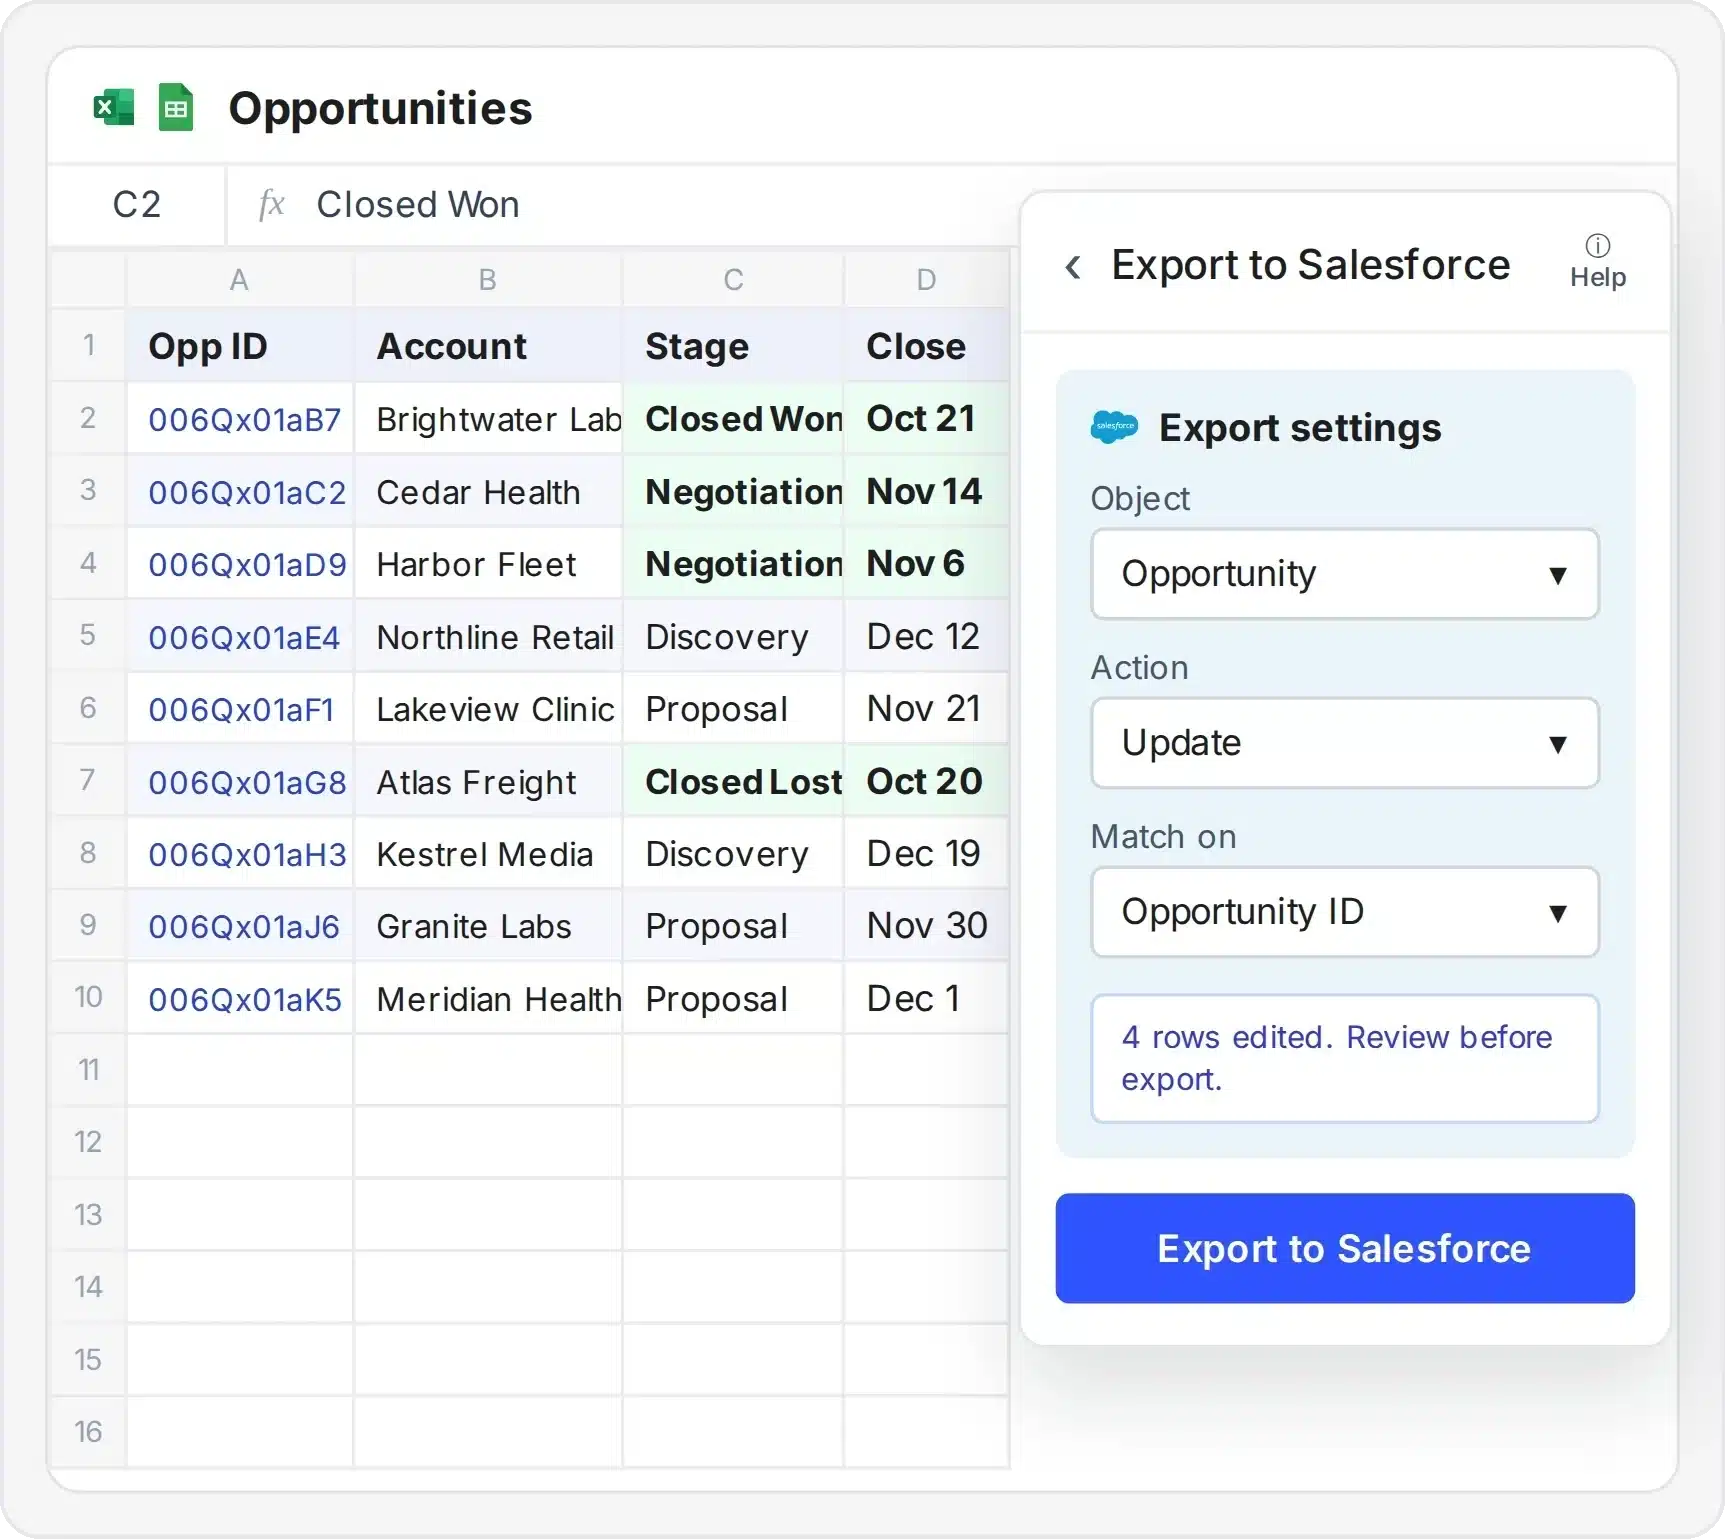
- Push out close dates on every slipped deal
- Insert new records or delete duplicates in bulk
- Review pending changes before anything is sent
Salesforce formulas
Pull Salesforce data with a formula, like a VLOOKUP
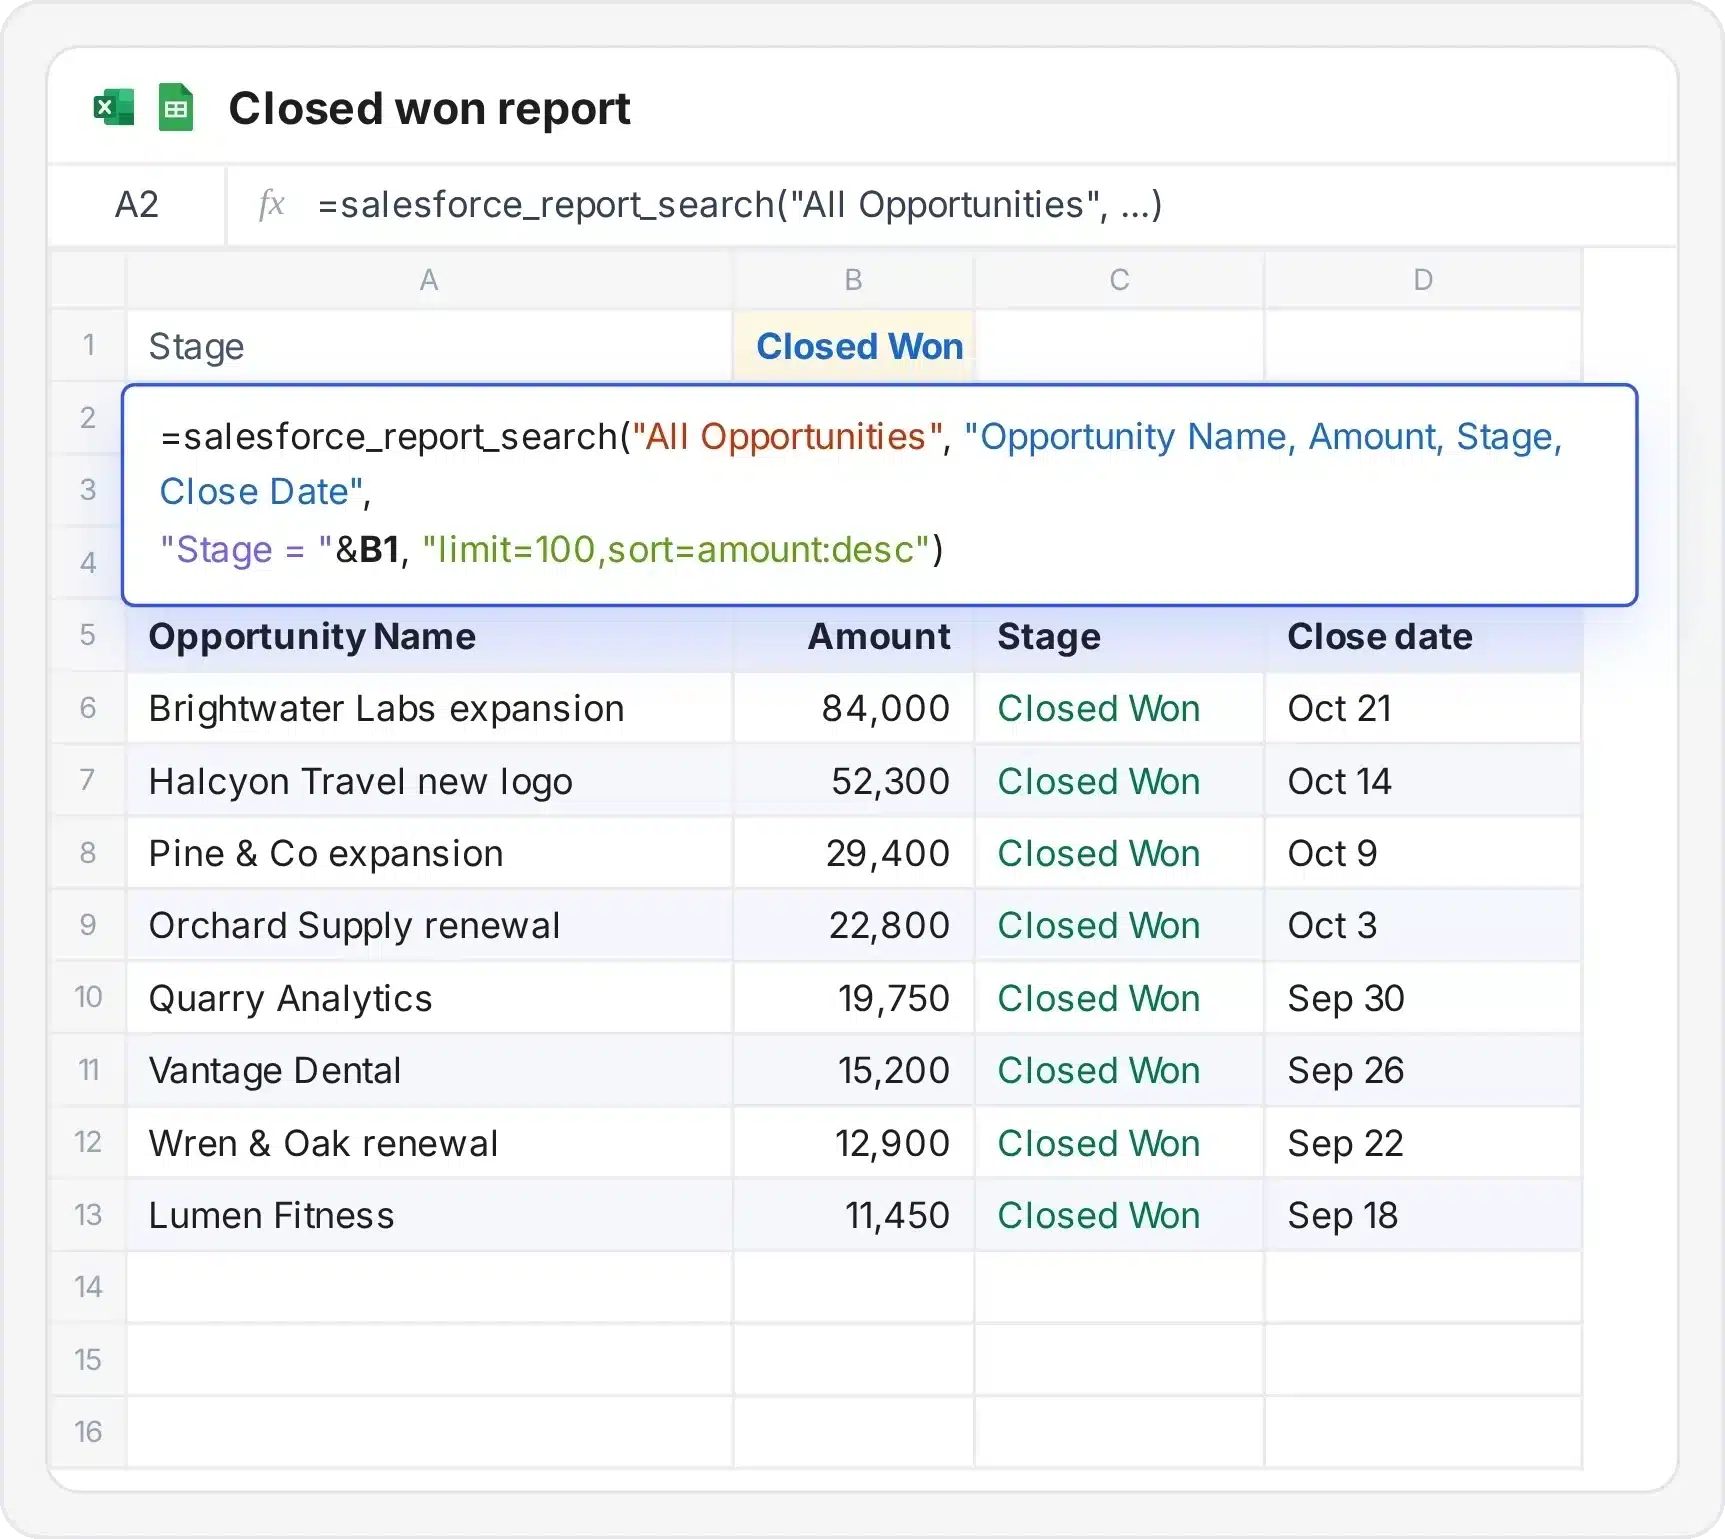
- Type a formula and get matching Salesforce records
- Point it at a saved report to bring in every row
- Change the lookup cell and the results update
AI Dashboards
Turn your Salesforce data into a live dashboard
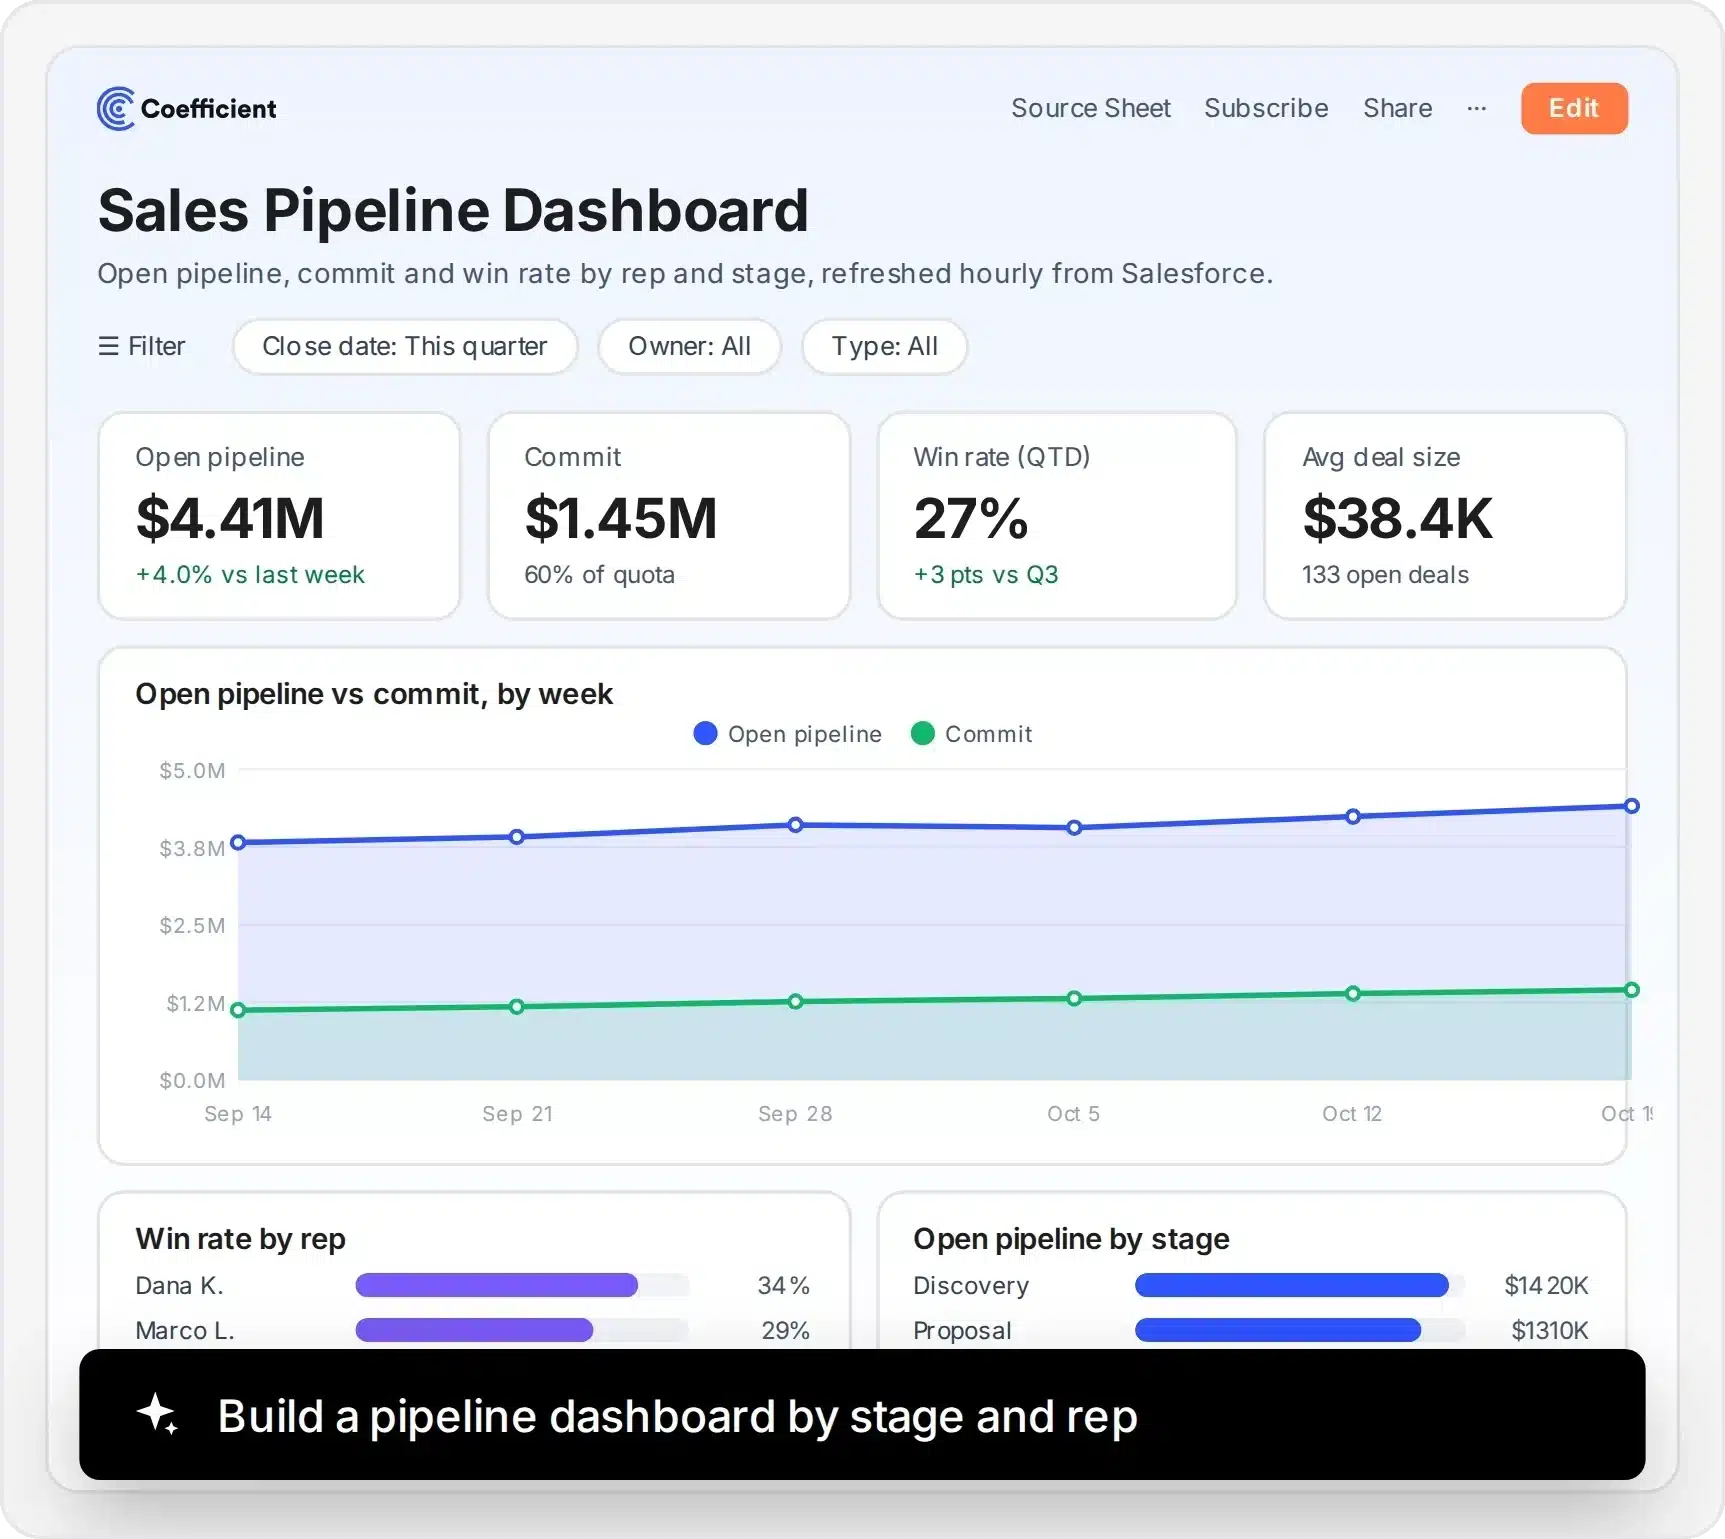
- Describe the dashboard and AI builds it from your sheet
- Share a live link, no Salesforce login needed
- Get Slack, Teams or email alerts when numbers change
150+ integrations
Blend Salesforce with 150+ other data sources

- Put Stripe payments next to closed-won deals
- See Google Ads spend next to the pipeline it created
- No ETL job or engineer needed to connect them
What RevOps teams build with Salesforce and Coefficient
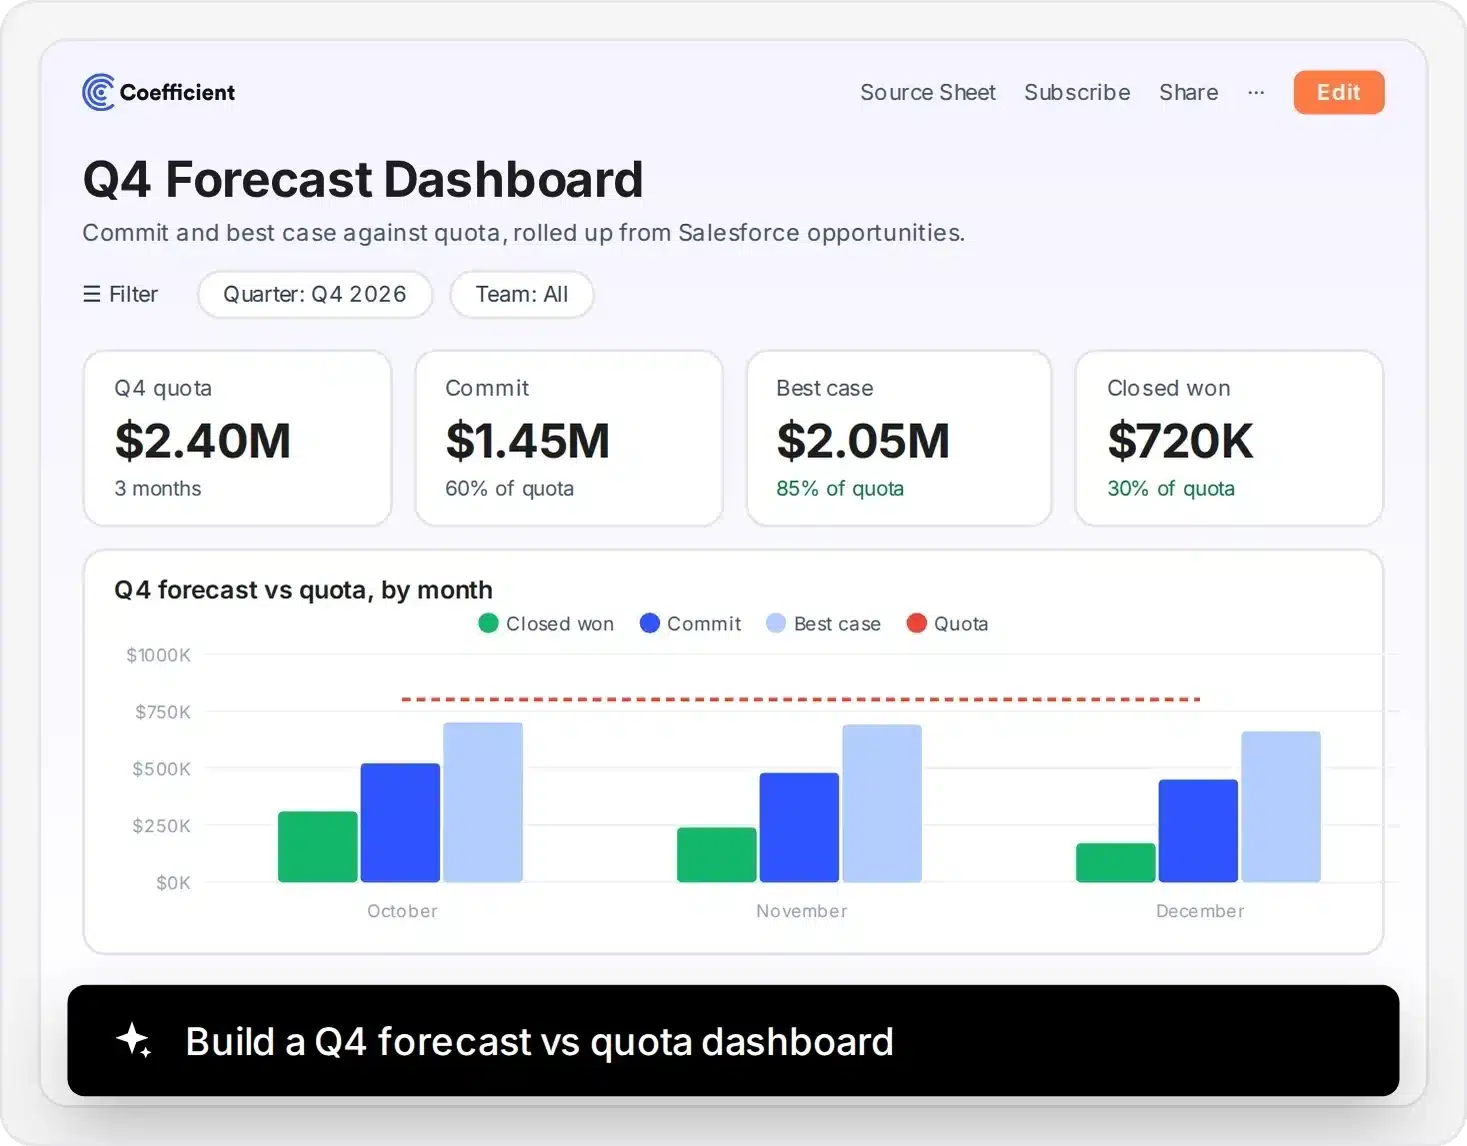
Q4 forecast dashboard
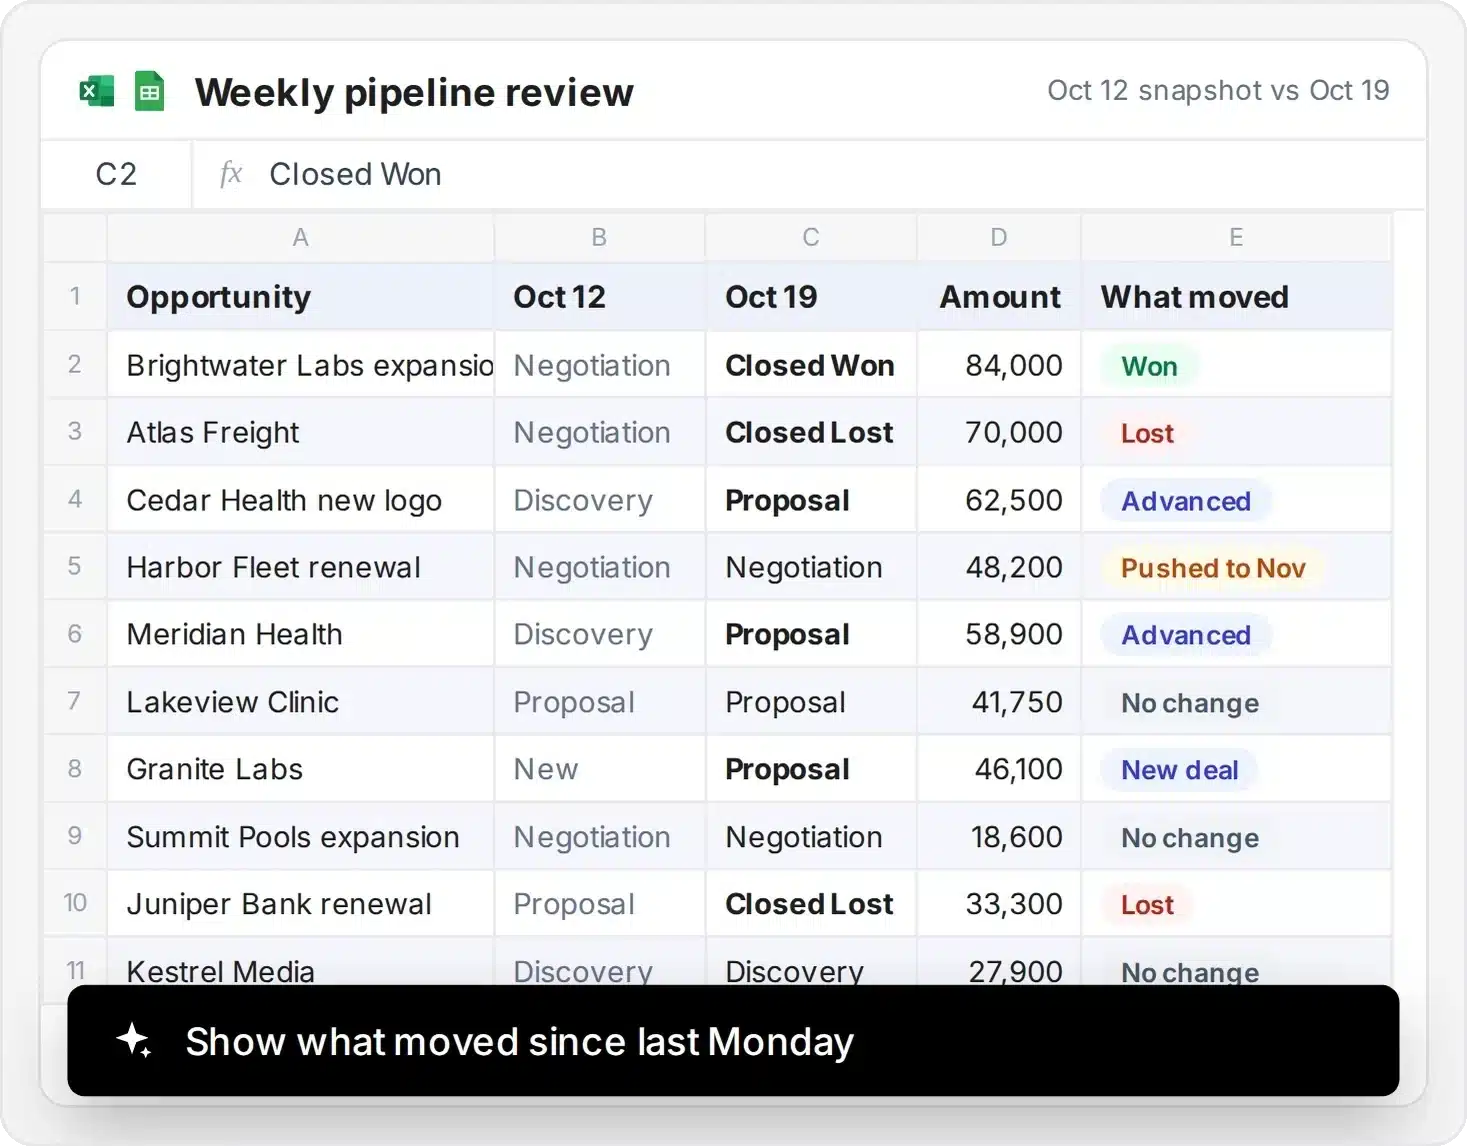
Weekly pipeline reviews
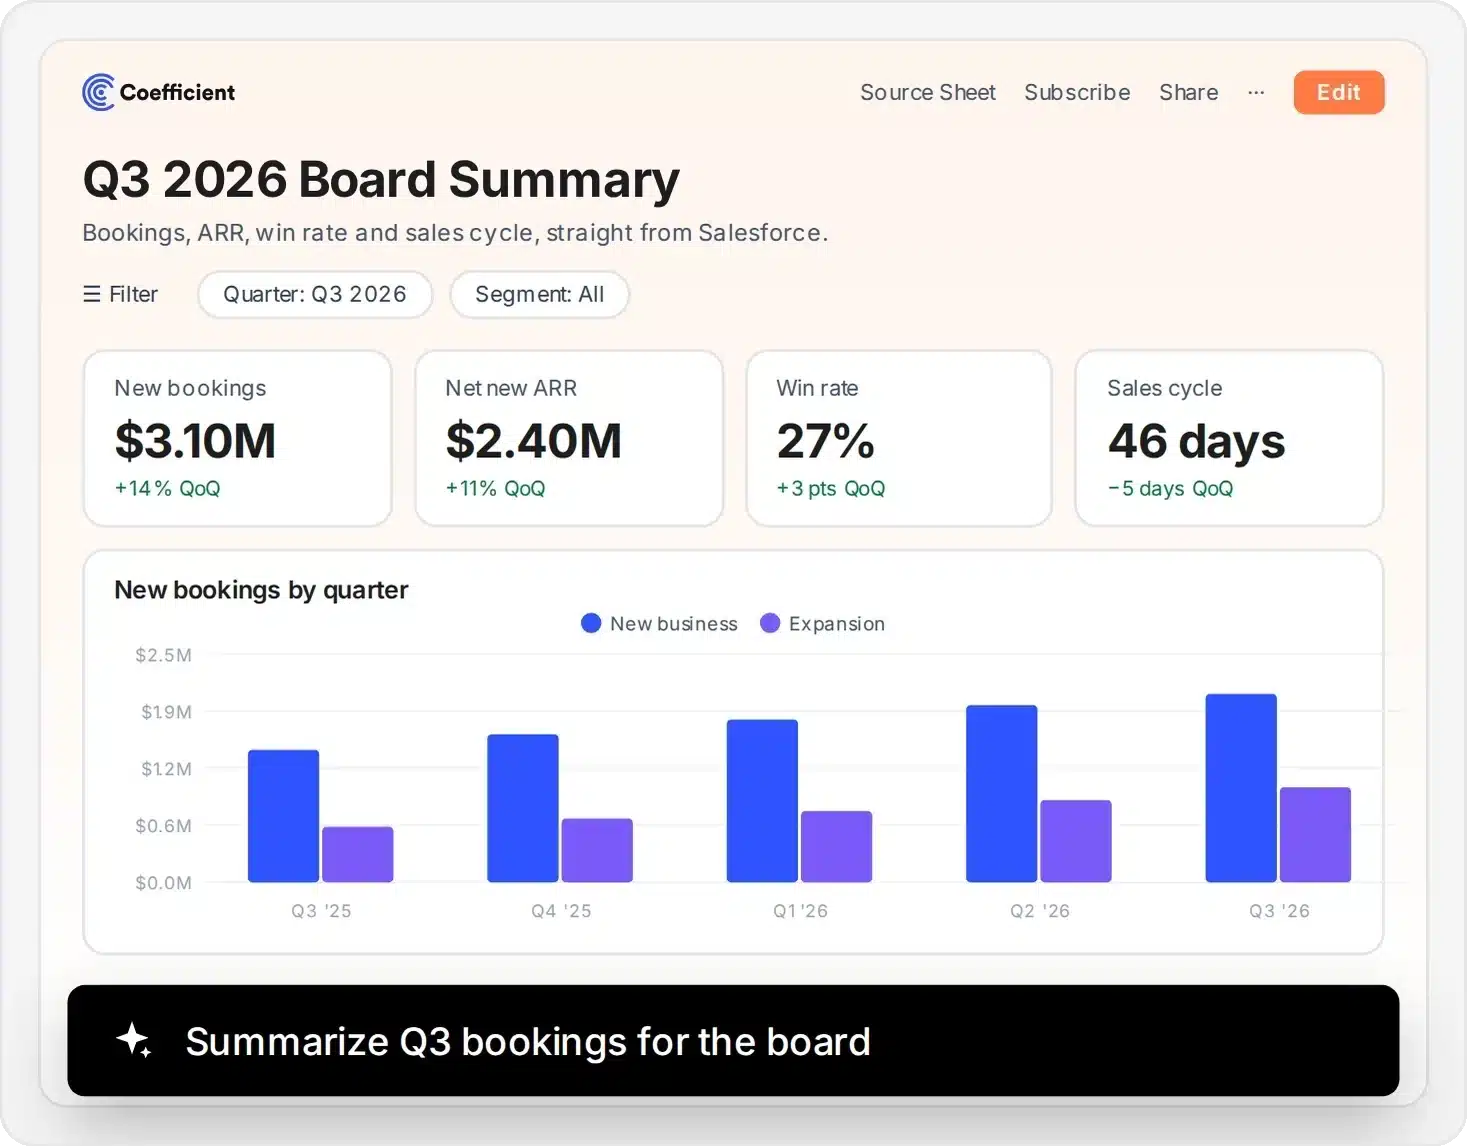
Board summary dashboard
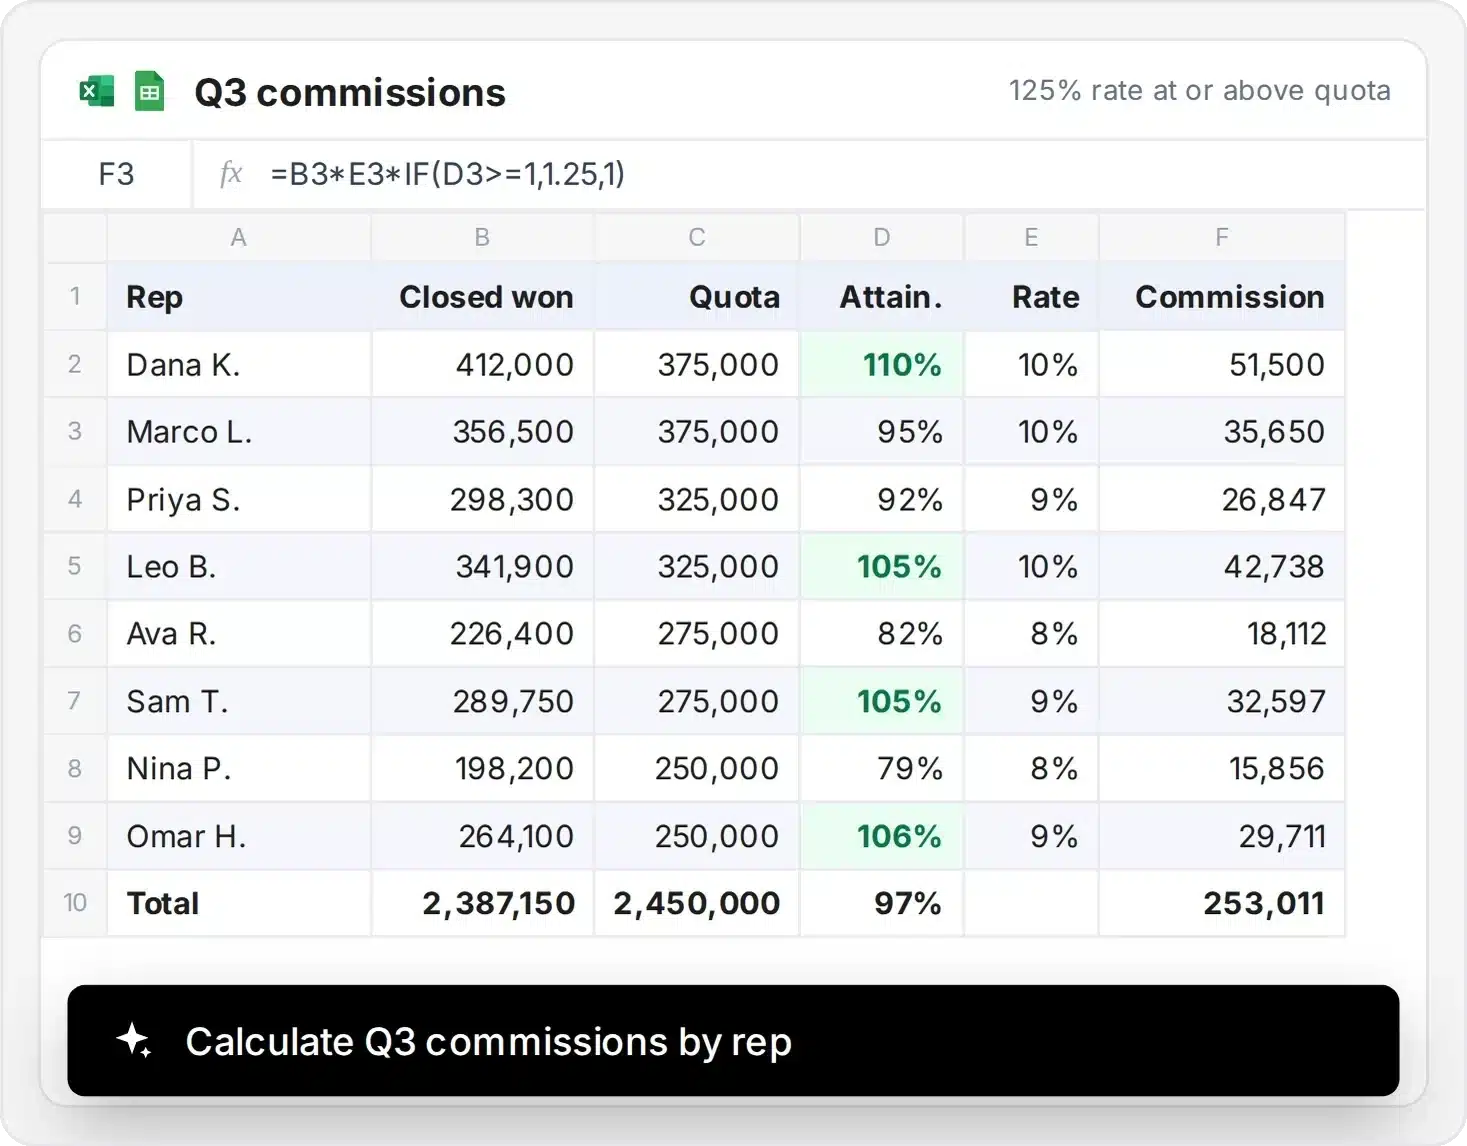
Commission calculations
AI Sheets Assistant
Clean your Salesforce data with the AI Sheets Assistant
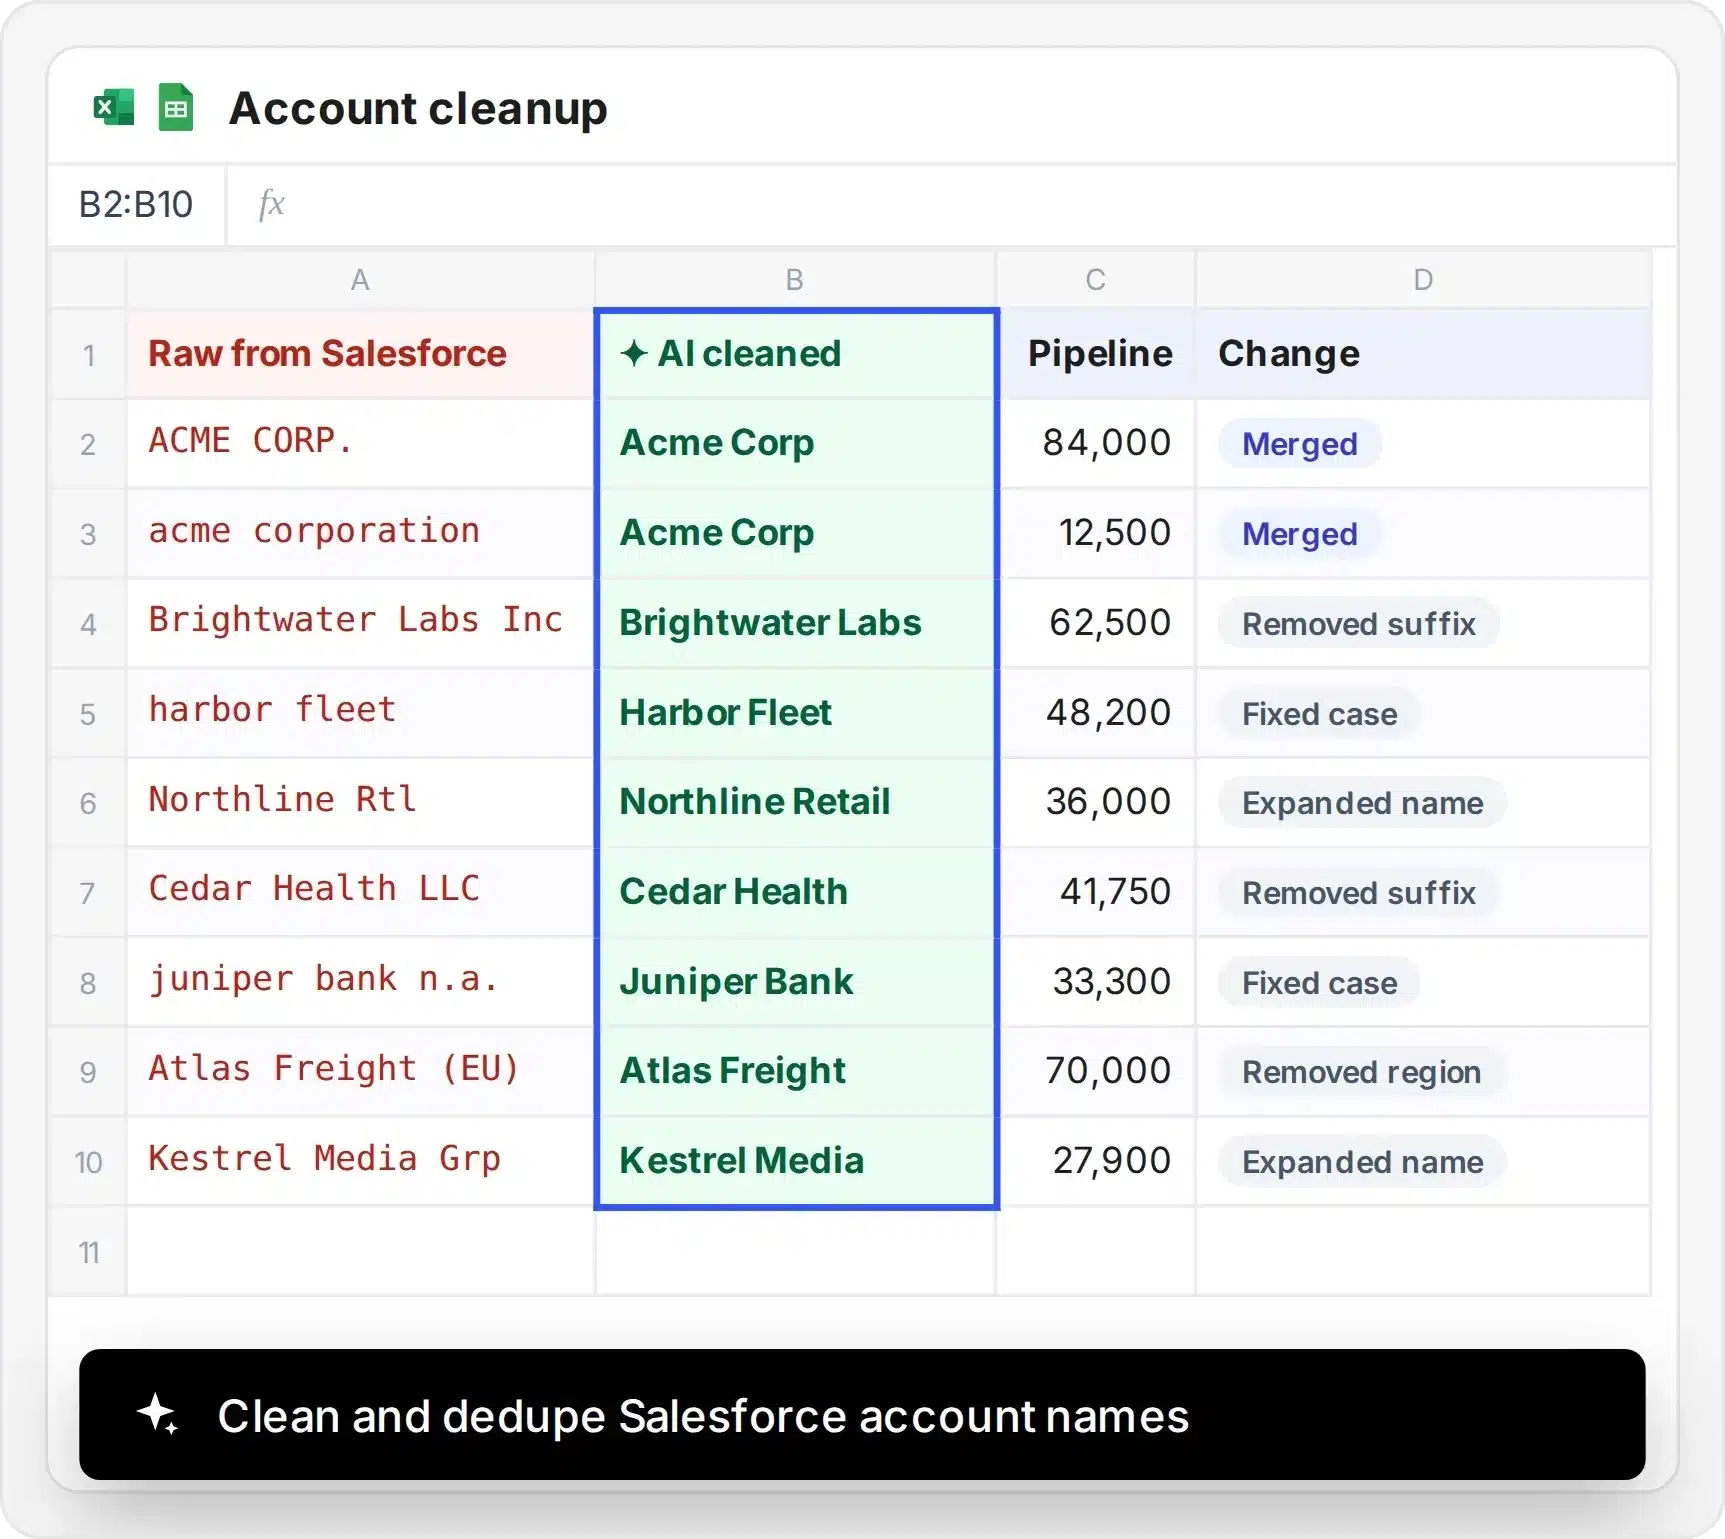
- Standardize account names and field values
- Dedupe accounts with one prompt
- Create pivots and formulas from plain English
Coefficient vs. Google’s Salesforce connector vs. Data Loader
Compare import, refresh, writeback and history for Salesforce reporting in Google Sheets.
| Coefficient | Data connector for Salesforce | Salesforce Data Loader | |
|---|---|---|---|
| Get Salesforce data into a sheet | Reports, objects, SOQL or a formula. | Reports and SOQL queries. | Export objects to CSV with SOQL. |
| Keep reports up to date | Hourly, daily or weekly, or on demand. | Refresh every 4, 8 or 24 hours. | Manual exports, or the command-line version. |
| Send edits back to Salesforce | Update, insert, upsert or delete from the sheet. | Update, insert and delete from the sheet. | Insert, update, upsert and delete from CSV files. |
| Track pipeline history | Scheduled snapshots to timestamped tabs. | Not available. | Not available. |
| Combine with other business data | HubSpot, Gong and 150+ sources in the same sheet. | Salesforce only. | Salesforce only. |
| Get alerts when numbers change | Slack or email alerts from your sheet. | Not available. | Not available. |
| Use it in Excel too | Yes, the same connector works in both. | Google Sheets only. | CSV files for any spreadsheet. |
| Pricing | Free plan with basic features. Paid plans start from $49/mo. | Free. | Free with Salesforce. |
What customers say about Coefficient

Before you hit 100M ARR, don’t spend on BI tools. Get your data in a good place with Coefficient and use their dashboards for executive reporting.

We initially turned to Coefficient for live reporting from Salesforce in Sheets. It didn’t take long to discover its power.

Coefficient automated our data transfers between spreadsheets and Salesforce, saving our team 20+ hours a week.

Start with a Salesforce reporting template
Choose a Google Sheets template, connect your Salesforce data and make the report your own.
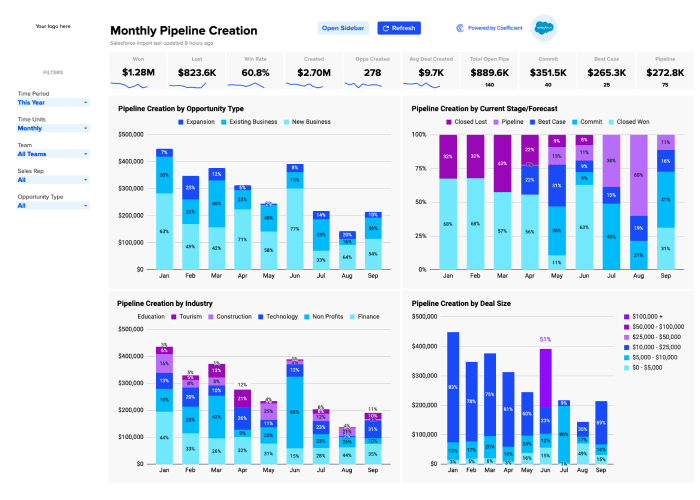
Salesforce pipeline dashboard
Track pipeline creation and break it down by your sales segments.
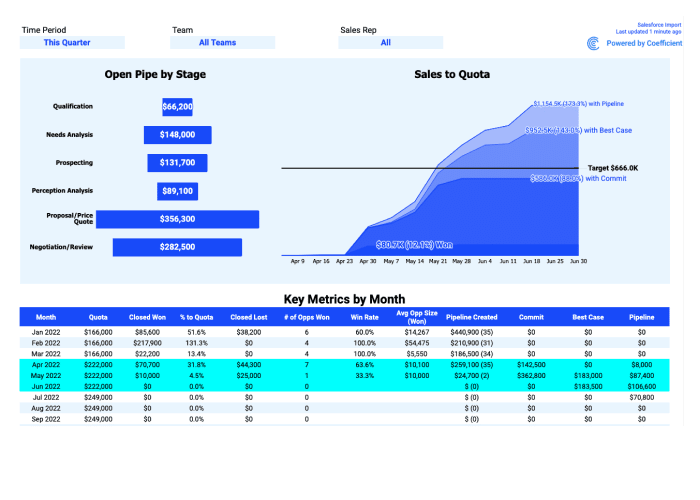
Salesforce sales opportunity dashboard
Compare open pipeline and sales performance with your targets.

Salesforce commission tracking
Calculate commissions from sales data and the rules your team uses.
Connect with the right access. Share with care.
Security, compliance, and control - without the enterprise sales cycle.
SSO & access control
Your identity provider. Your rules.
- SSO: Okta, Azure AD, Google Workspace, OneLogin
- Roles: Admin, Editor, Viewer
- Permissions: Control who accesses which data sources

Coefficient Salesforce connector capabilities at a glance
Import Salesforce reports, objects and SOQL results into Google Sheets.
| What Coefficient supports | |
|---|---|
| Reports | Any Salesforce report your account can run |
| Objects and fields | Standard and custom objects, with the fields you choose |
| Custom SOQL | Your own SOQL query results |
| Salesforce formulas | =salesforce_search and =salesforce_report_search in any cell |
| Scheduled refresh | Hourly, daily or weekly, with no manual exports |
| Two-way sync | Update, insert, upsert or delete records from the sheet |
| Historical snapshots | Save any import to a timestamped tab on a schedule |
| Alerts | Slack or email alerts when sheet values change |
| Team reporting | Share the sheet and dashboard, no Salesforce login needed |
| Cost | Free plan with basic features. Paid plans start from $49/mo |
Salesforce Google Sheets integration FAQs
About Salesforce
Salesforce helps teams manage accounts, customer relationships and sales opportunities. Coefficient connects that CRM data to Google Sheets and Excel so your team can report in the spreadsheets it already uses.


Put live Salesforce data in Google Sheets
No credit card required.
