
Table of Contents
![]()
- 1. 10 Multi-Entity Accounting Automation Tips
- 2. Fast close accounting: How to close your books in 3 days or less
- 3. Intercompany reconciliation: 7 steps for accurate financial reporting
- 4. Strategic Scenario Planning: A Practical Guide for Finance Teams
- 5. Incremental Budgeting: A Complete Guide for Finance Teams
- 6. FP&A AI: Complete Guide to Artificial Intelligence in Financial Planning
- 7. Strategic budgeting: A complete guide to aligning finances with long-term goals
- 8. How to Create an Operating Budget (Step-by-Step Guide)
- 9. How to Do Vertical Analysis of a Balance Sheet
- 10. How to Do Sensitivity Analysis in Excel: A Complete Guide
- 11. CFO Reports to the Board of Directors: A Complete Guide
- 12. Cost volume profit analysis: A complete guide for finance teams
- 13. Workflow Automation for Fractional CFOs & Finance Service Firms
- 14. 11 Account Reconciliation Best Practices
- 15. How to build budget vs. actual reporting in spreadsheets
- 16. Automate Your Month End Close Process: A CFO’s 5-Step Playbook
- 17. 8 Must Automate Processes for Fractional CFO & Accounting firms
- 18. 6 Ways for CFO Firms to Provide Better Client Reporting
- 19. 6 Great Excel Report Templates for Fractional CFOs
- 20. How to Perform Price‑Volume‑Mix (PVM) Analysis in Excel — Free Template
- 21. How to Build a 13‑Week Cash‑Flow Forecast in Excel (Free Template)
- 22. How to Calculate Trailing‑12‑Month (TTM) Metrics in Spreadsheets + Free Template
- 23. How to do Scenario Analysis in Spreadsheets
- 24. Best Practices for Consolidating Financial Statements


The month end close process.
For many finance professionals, those words trigger a familiar sense of dread – long hours spent manually exporting reports, copying and pasting data into spreadsheets, and wrestling with formulas. It’s a tedious, repetitive process that eats up valuable time that could be spent on strategic analysis.
What if you could automate the entire workflow and reclaim a full day of work every month?
That’s exactly what Allison James, a fractional CFO, AI-enthusiast, and Coefficient power user, did. She built an automated month end close process she coined her “Month End Reporting Engine” in Google Sheets that transformed her process and shaved 8 hours off of her month.
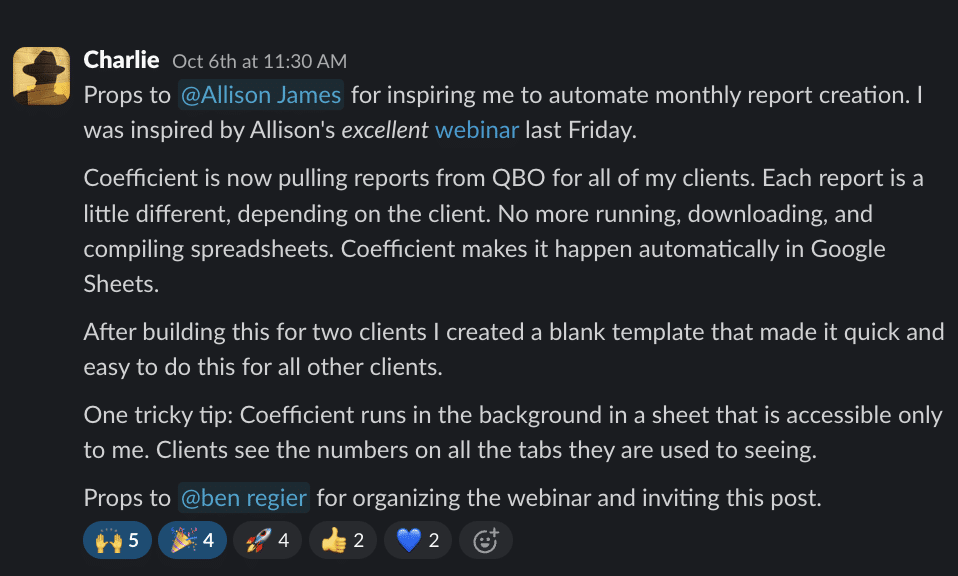
Here’s her step-by-step playbook in writing – a quick read that lays out her exact steps. The same could also be built in Excel. Want to see the full walkthrough? You can watch Allison’s demo at the bottom of this post. It’ll likely inspire you to do the same thing Charlie did.
The Automated Month End Close Process Stack
The Goal: To create a flexible, customizable, and automated reporting system using simple, accessible tools. The tools you already use and love. This means no extra learning curve and no crazy enterprise expense.
The Tools:
- QuickBooks: The source of financial data.
- Google Sheets: The foundation for the reporting engine.
- Coefficient (free trial + free plan available): The bridge to sync live data from QuickBooks to Google Sheets (or Excel). And create automated Slack / email alerts.
- ChatGPT/Gemini: The AI assistant for generating formulas and scripts. Alternatively, could use Coefficient for the same without needing to leave your spreadsheet.
Steal Allison’s Playbook
Follow along with Allison’s playbook recording or skip down to the written step-by-step build guide below.
The Playbook Build: 5-Step Month End Close Process
Step 1: Establish Your Framework
Before building, map out your month end close process. Allison uses a simple, four-stage framework:
- Raw Data: The initial data import from your source system.
- Matching: The logic that cleans and maps raw data to the correct accounts.
- Summary: The client-facing dashboards and reports.
- Alerts: The automated notifications for key events or variances.
Step 2: Automate The Raw Data Imports Required for Your Month End Close Process
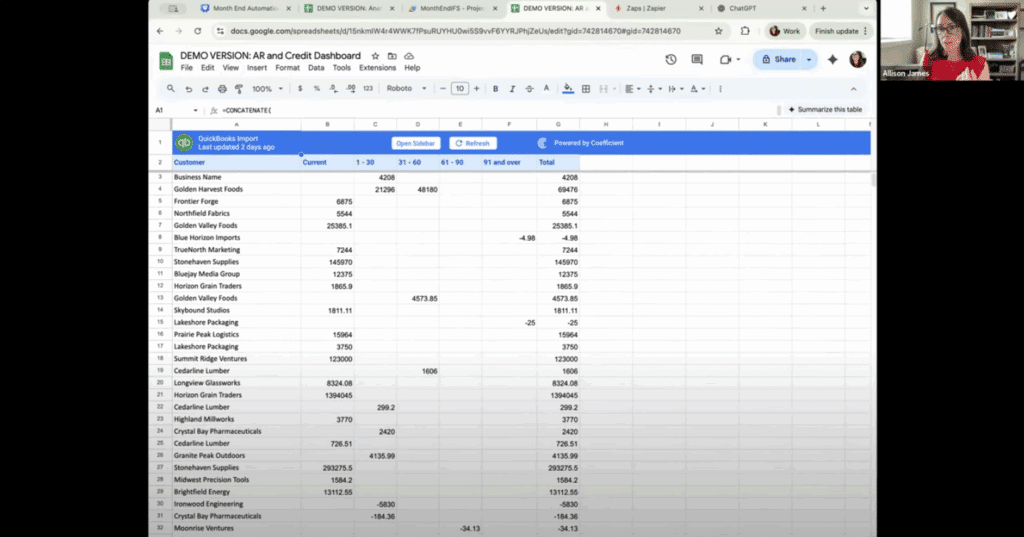
The key to eliminating manual work is automation. Instead of exporting CSVs from QuickBooks, Allison uses Coefficient to pull all necessary data – like the P&L, balance sheet, and SKU reports – directly into separate “RAW” tabs in her Google Sheet. She sets these imports to refresh on a schedule, ensuring the data is always up-to-date without any manual intervention.
Step 3: Build Your Mapping & Logic
With your raw data flowing in, you need to make sense of it. QuickBooks’ chart of accounts can be messy, with extra spaces or formatting quirks. Allison creates a “Mapping” tab to clean up this data and group detailed accounts into the high-level categories needed for her final reports.
Pro-Tip: Don’t know the right formula? Ask an AI assistant! Allison describes herself as a “vibe coder.” She tells ChatGPT or Coefficient’s AI Sheets Assistant what she wants to accomplish (e.g., “I want to match the accounts from this tab to the categories in that tab”), and it generates the complex formulas for her.
Step 4: Create Your Final Reports & Dashboards for your Month End Close Process
This is where the magic happens. Your final report tabs should pull data exclusively from your cleaned-up “Mapping” and “Raw” data tabs. Allison has several, including:
- Budget vs. Actual: A clear overview comparing monthly and YTD performance against the budget.
- Variance Analysis: Automatically calculates dollar and percentage variances.
- Executive Summary: A high-level dashboard with key highlights and notes for leadership.

Step 5: Automate the Final Mile with Scripts & Buttons
To complete the automation, Allison uses simple Google Apps Scripts (many of which she also generated using AI) and attaches them to buttons in her sheet. With a single click, she can:
- Generate a PDF Package: The script automatically creates a professional PDF of the specified report tabs.
- Backup to Folder: This creates a frozen-in-time copy of the entire workbook and saves it to a designated Google Drive folder for archival purposes.
- Summarize: This button triggers a script that sends the key highlights and notes from her executive summary to her email, making it easy to forward to the leadership team.

By following this playbook, Allison transformed a tedious, 8-hour manual process into a powerful, automated engine. She now spends her time analyzing the data, not just preparing it.
