


Struggling to compare actual performance against your budget? Our Variance Analysis template gives you instant visibility into financial discrepancies without the complex setup.
What is a Variance Analysis Report?
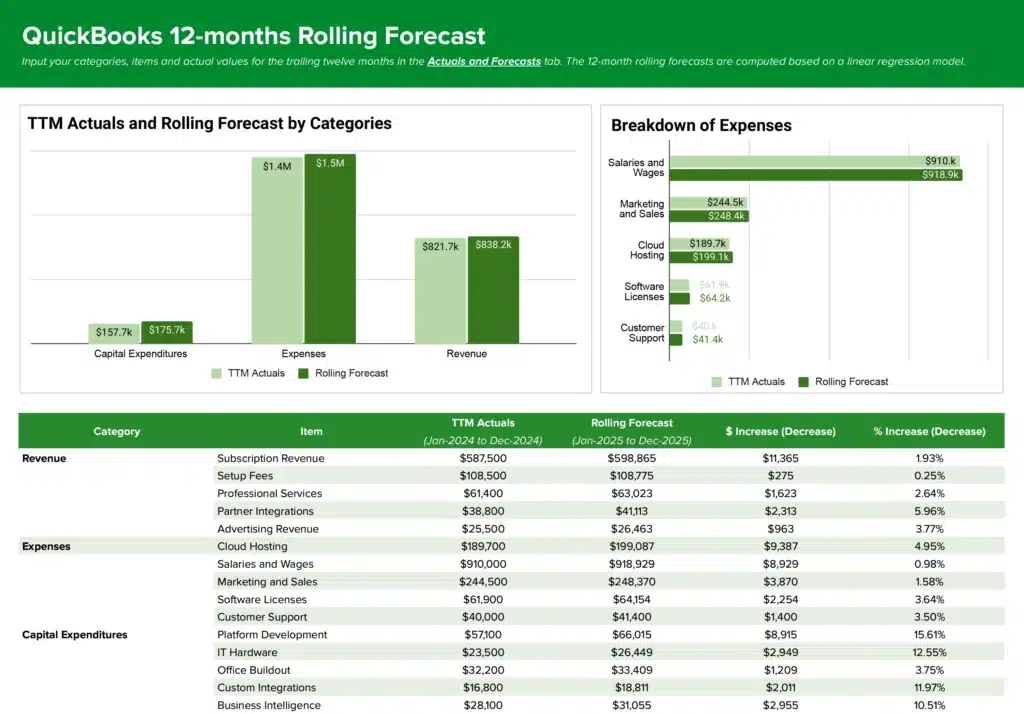
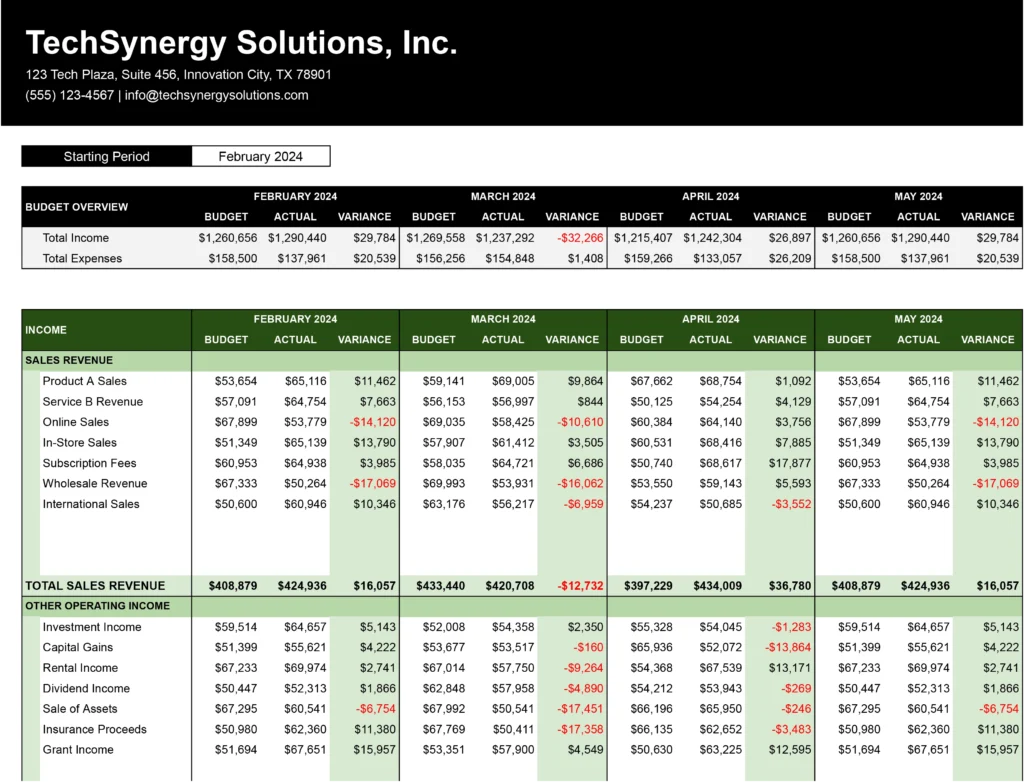
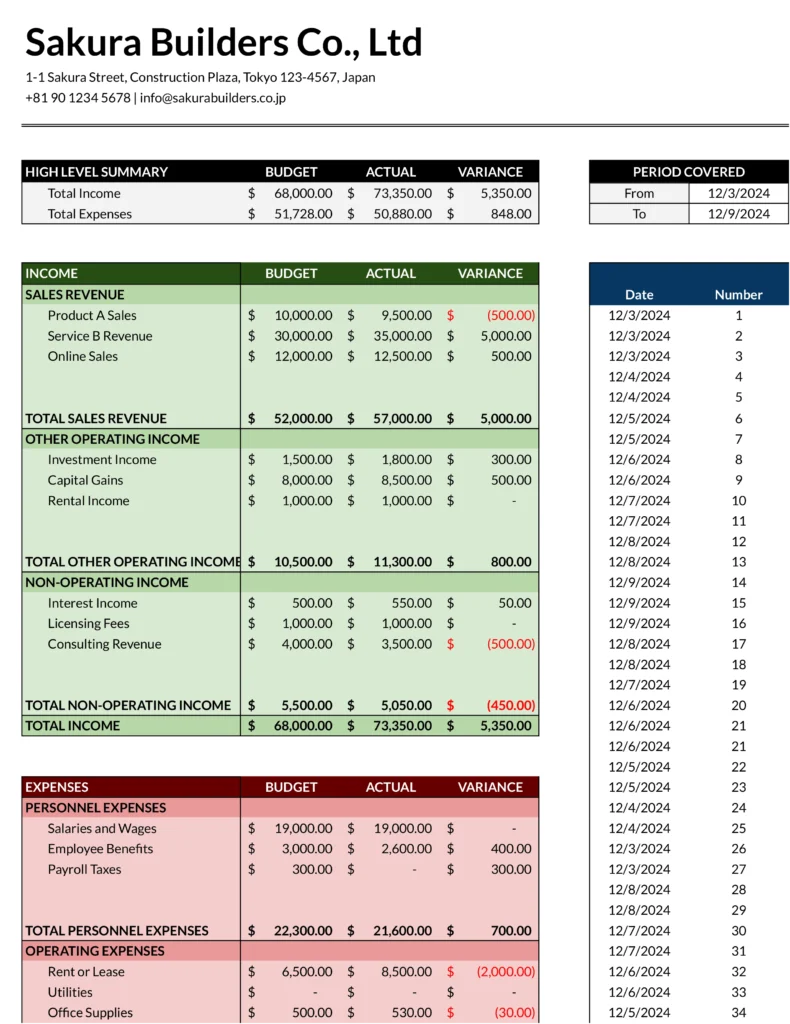
A Variance Analysis report is a financial management tool that identifies and examines differences between planned and actual performance. It compares budgeted figures against real results to spotlight where a business is exceeding expectations or falling short.
This analysis forms the backbone of effective financial control. By measuring the gap between projections and reality, finance teams can quickly identify problems, capitalize on unexpected opportunities, and make data-driven adjustments to their strategies. The report transforms raw financial data into actionable insights that guide corrective measures and future planning.
Benefits of using the Variance Analysis Template
Stop wasting hours manually comparing budget versus actual figures. Our template delivers immediate advantages:
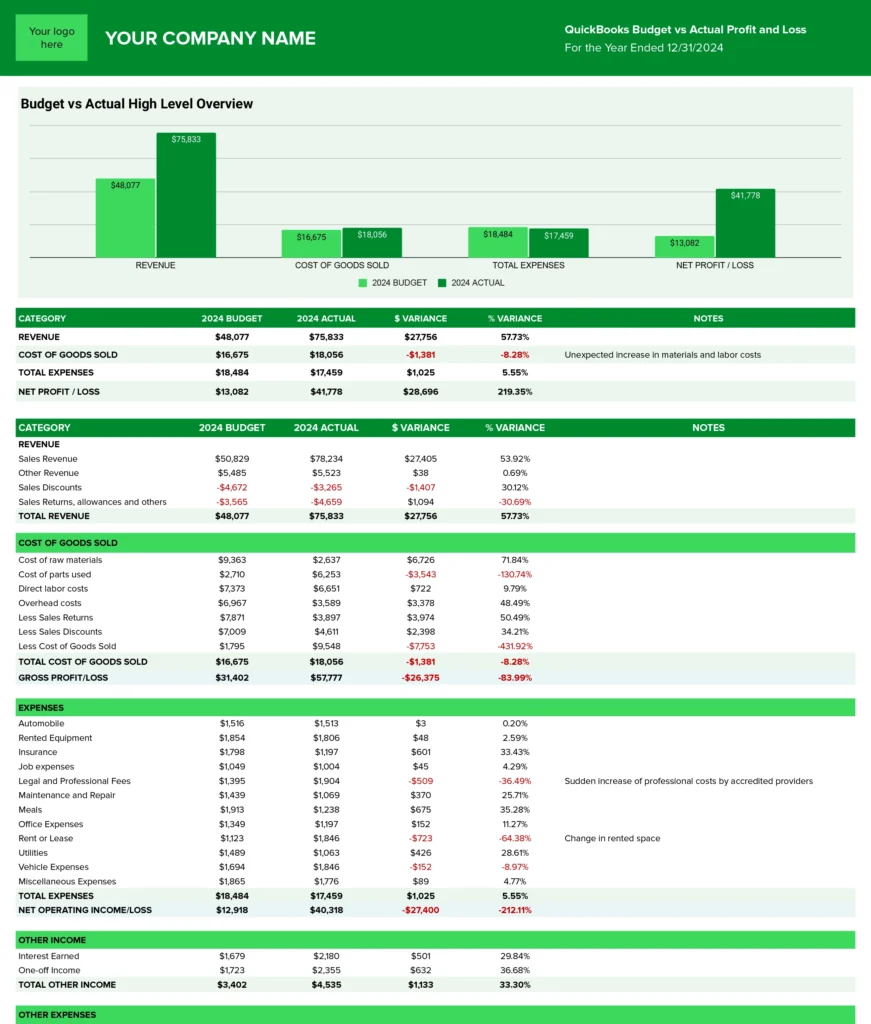
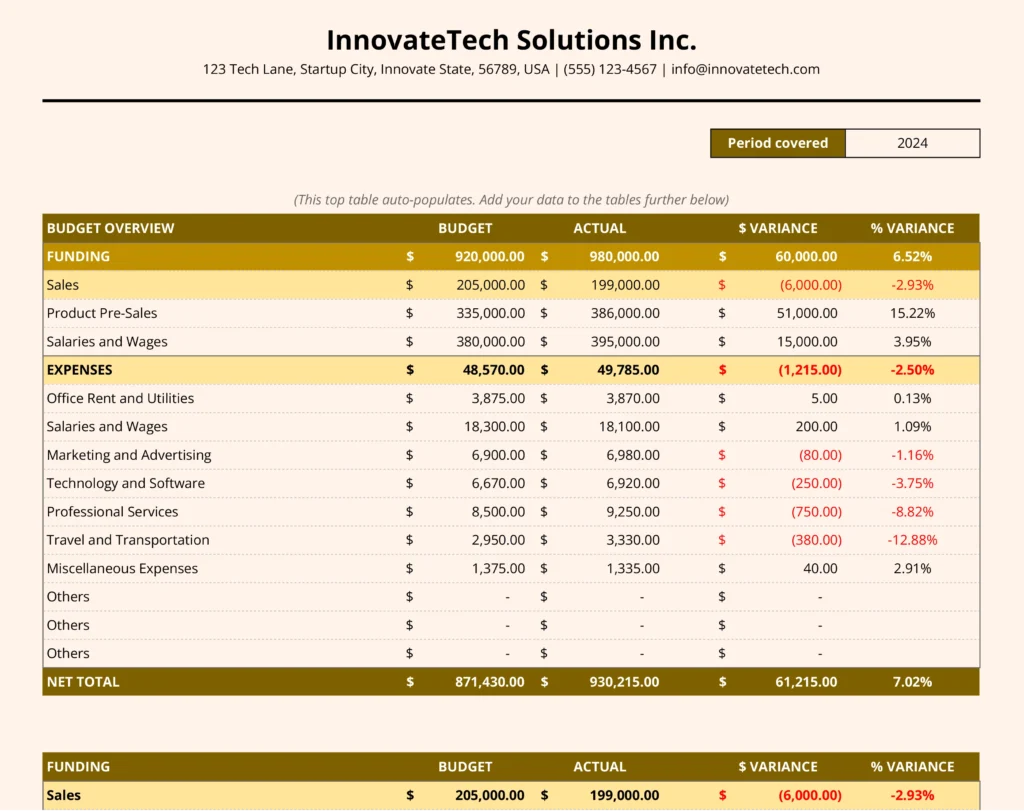
- Instant clarity on performance gaps – See exactly where your actuals differ from budget with color-coded variance indicators that highlight areas needing attention.
- Time-saving automation – Cut hours from your financial analysis process with pre-built formulas that automatically calculate variances across multiple metrics.
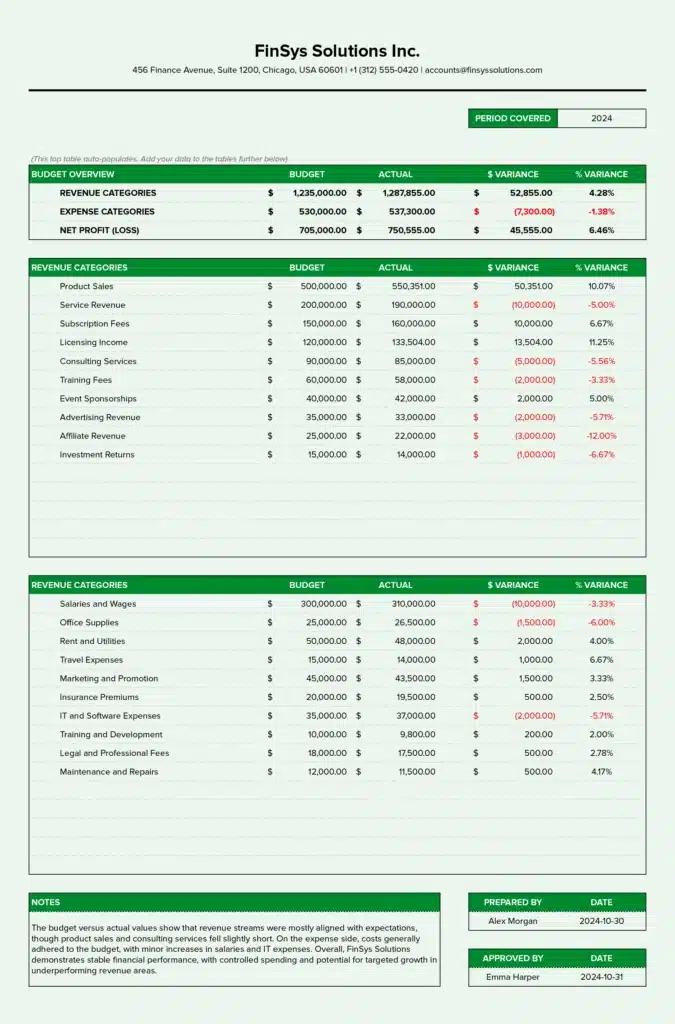
- Better decision support – Transform dry numbers into visual insights that help stakeholders understand financial performance at a glance.
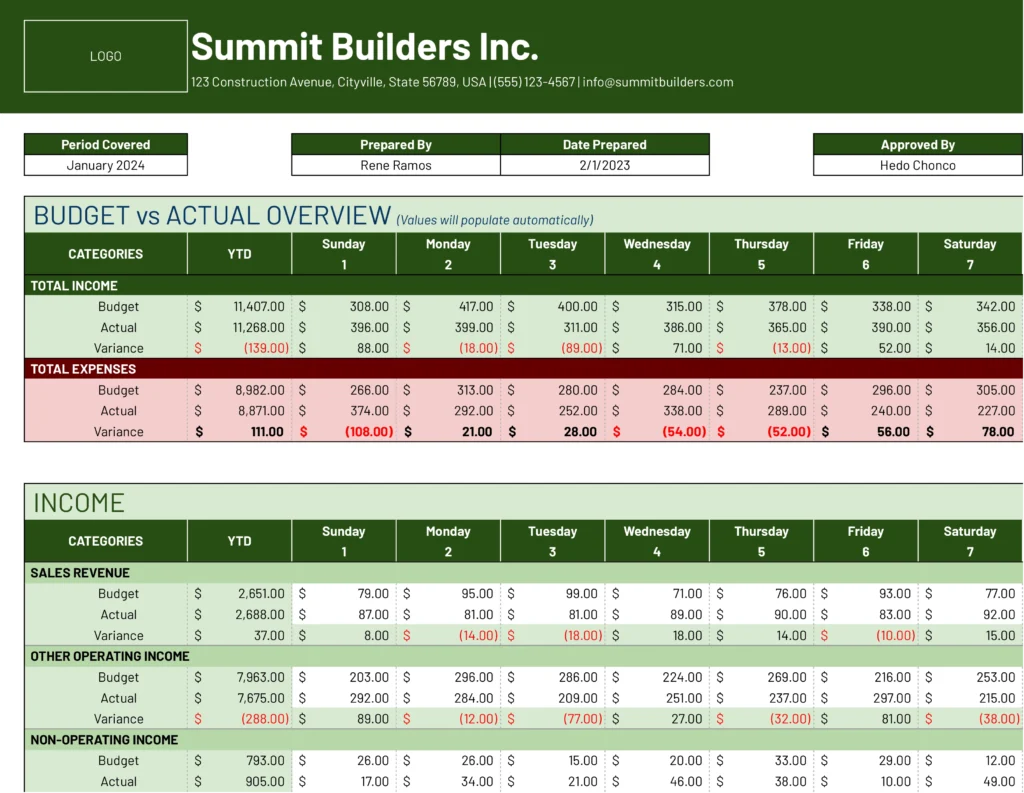
- Standardized reporting – Maintain consistency in how variances are calculated and presented across your organization.
- Simplified collaboration – Share a single source of truth for variance data that finance and non-finance team members alike can understand.
Metrics Tracked in the Report
Our Variance Analysis template comes pre-configured with essential financial variance calculations:
1. Revenue Variance
Measures the difference between actual and budgeted revenue. This calculation immediately reveals if your sales performance is ahead of or behind expectations.
Formula: Actual Revenue – Budgeted Revenue
2. Cost Variance
Identifies discrepancies between projected and actual costs. This metric helps control expenses by highlighting areas where spending exceeds budget.
Formula: Actual Costs – Budgeted Costs
3. Gross Profit Variance
Compares actual versus budgeted gross profit, revealing the combined impact of revenue and cost of goods sold (COGS) variances.
Formula: (Actual Revenue – Actual COGS) – (Budgeted Revenue – Budgeted COGS)
Get started with your variance analysis today
Take control of your financial performance monitoring. Our Variance Analysis template gives you immediate insight into budget-to-actual discrepancies without complex setup or specialized software.
Download our free template now and transform your financial analysis process. In just minutes, you’ll have a clear, visual representation of your organization’s performance against plan, highlighting exactly where you need to focus your attention.