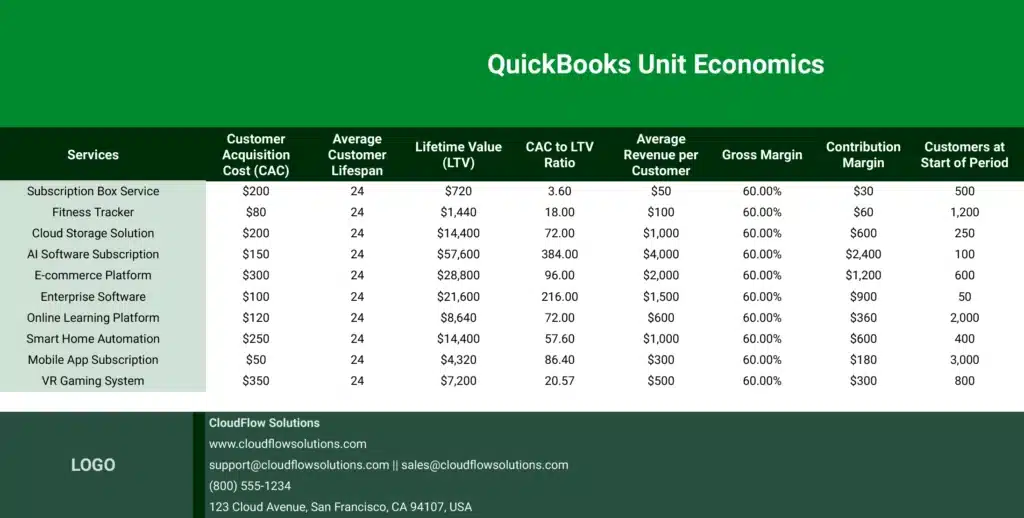
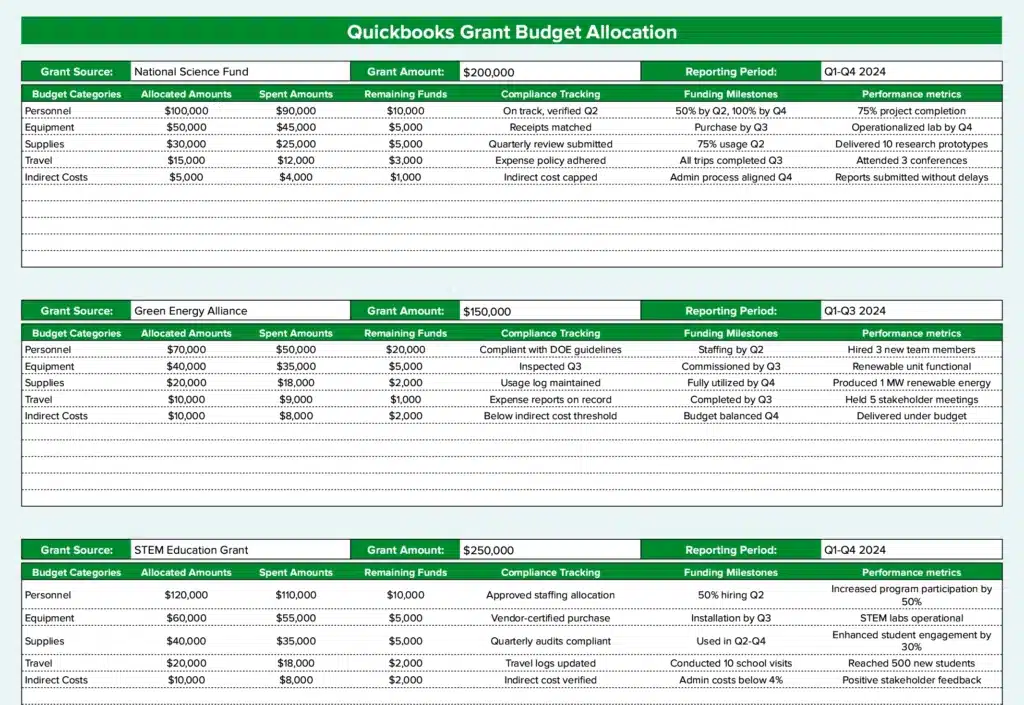
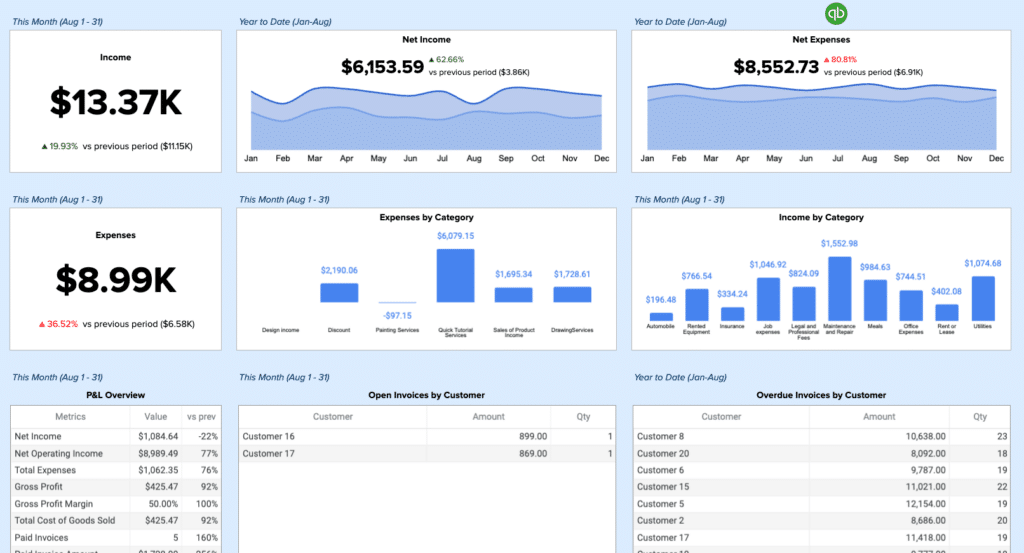
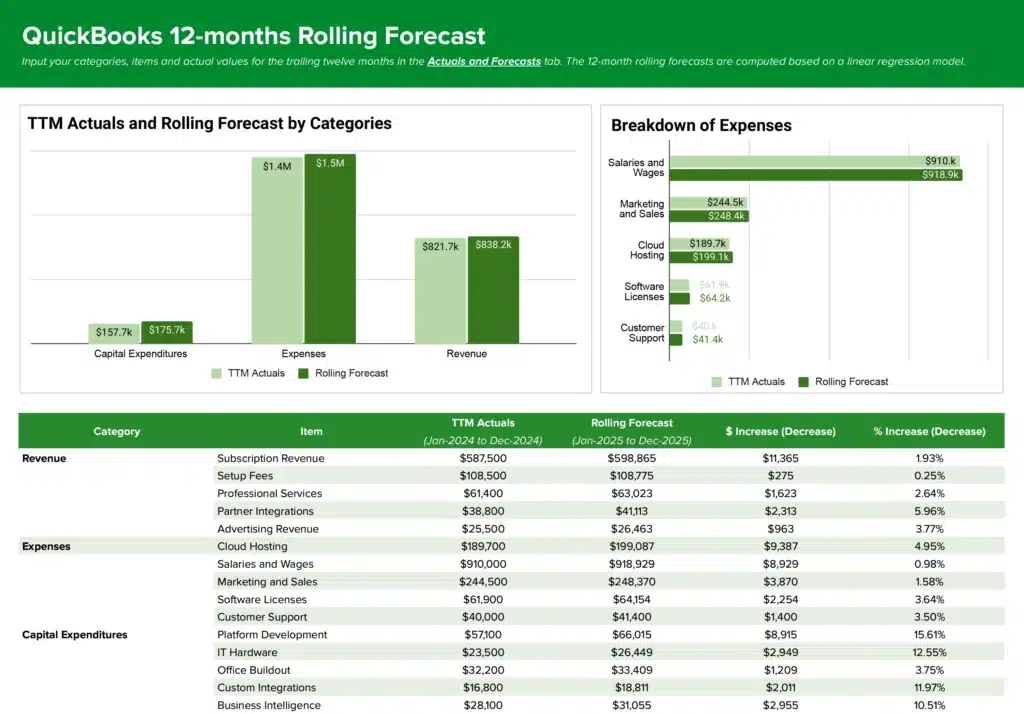
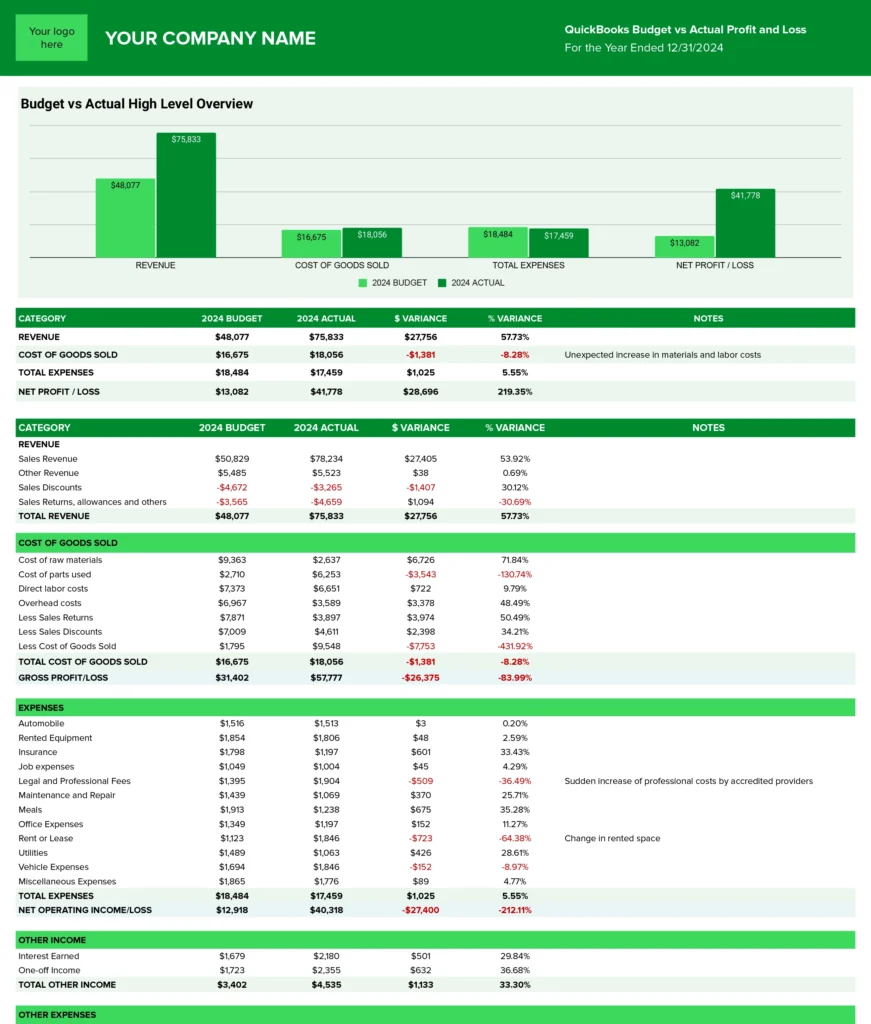
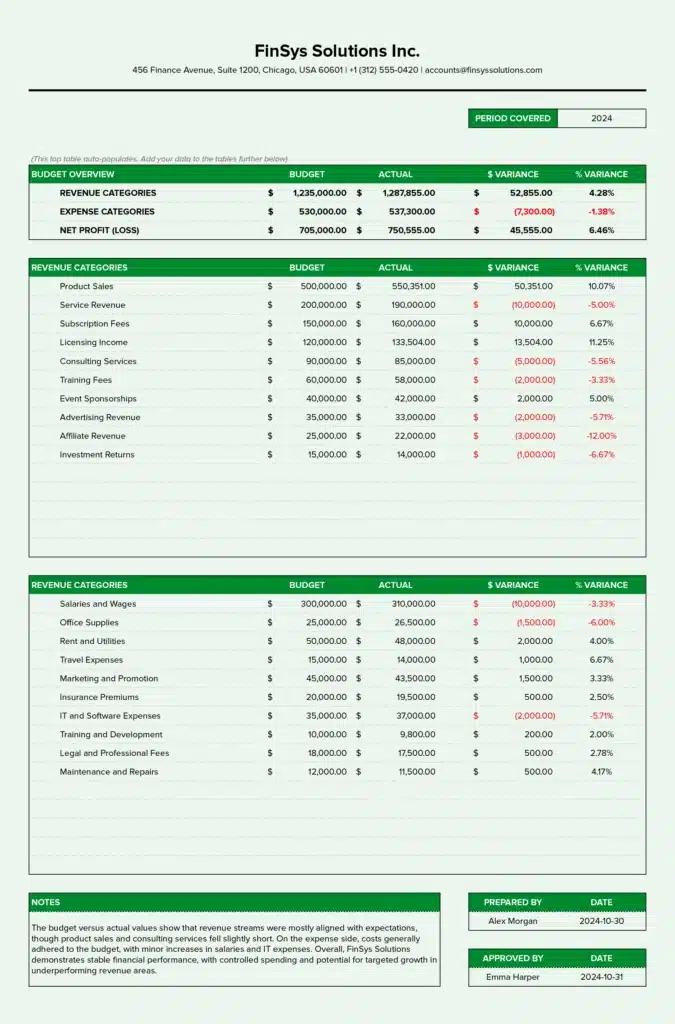
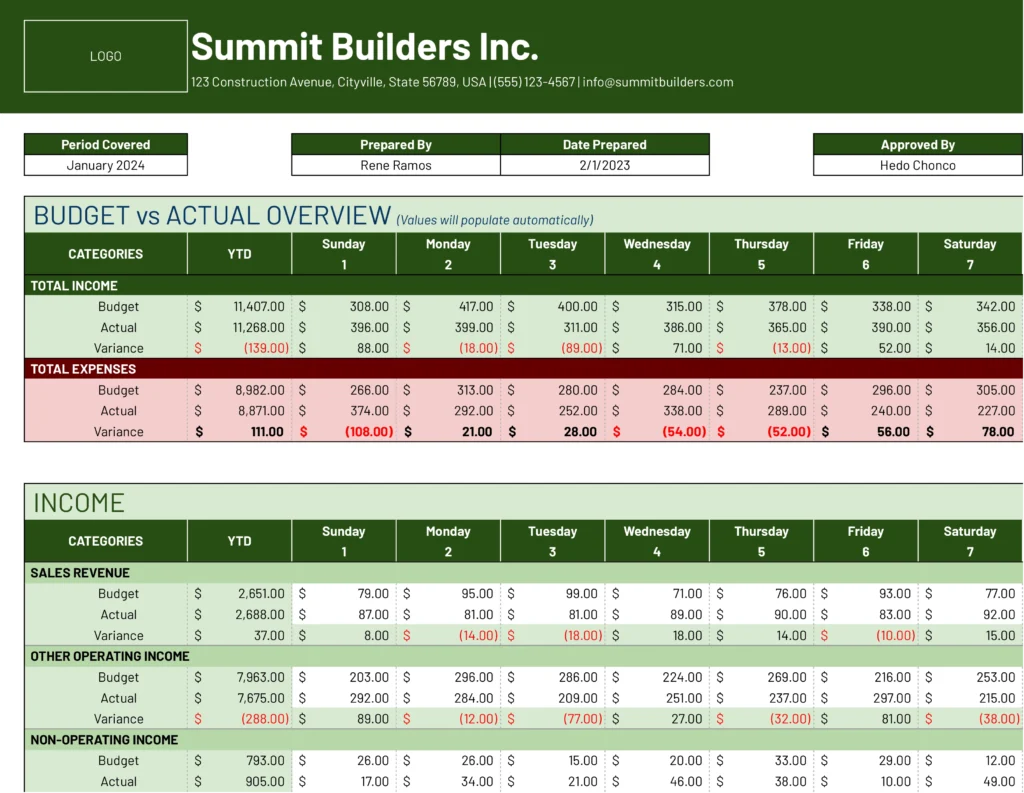
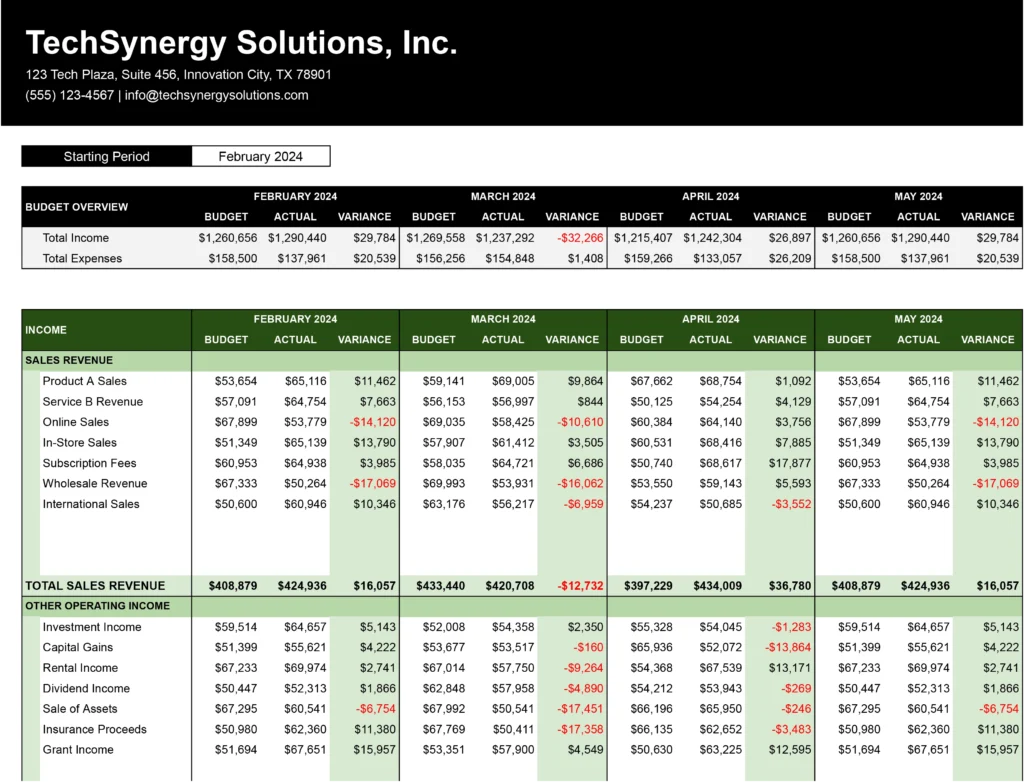
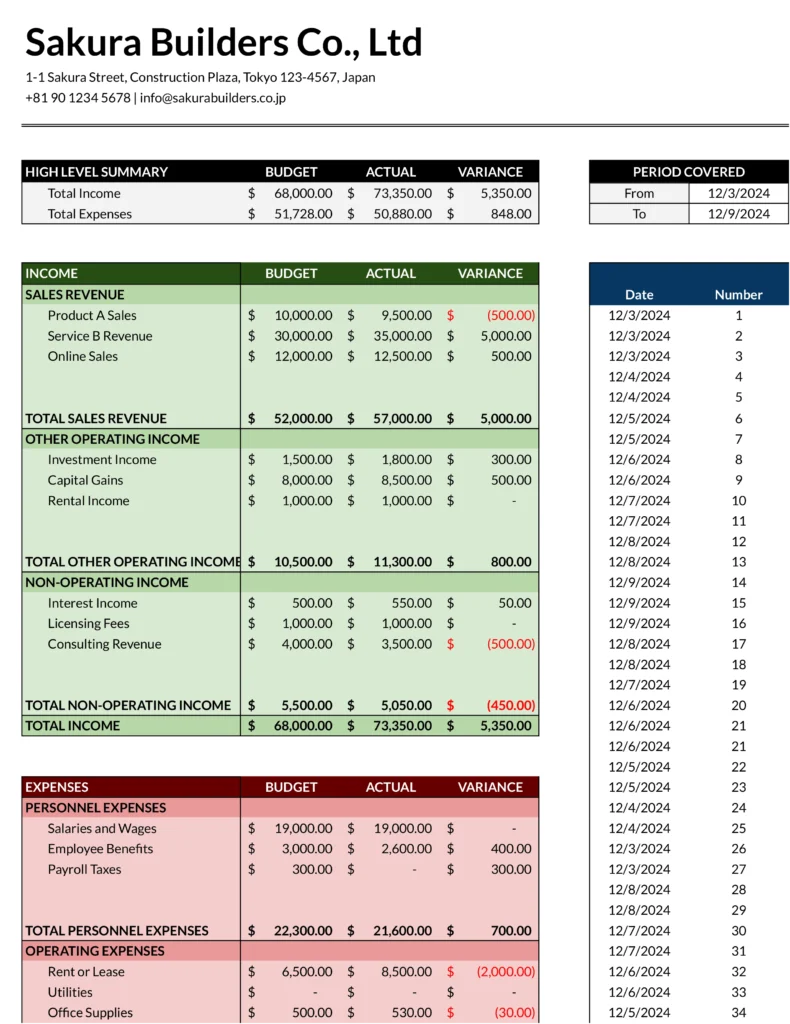
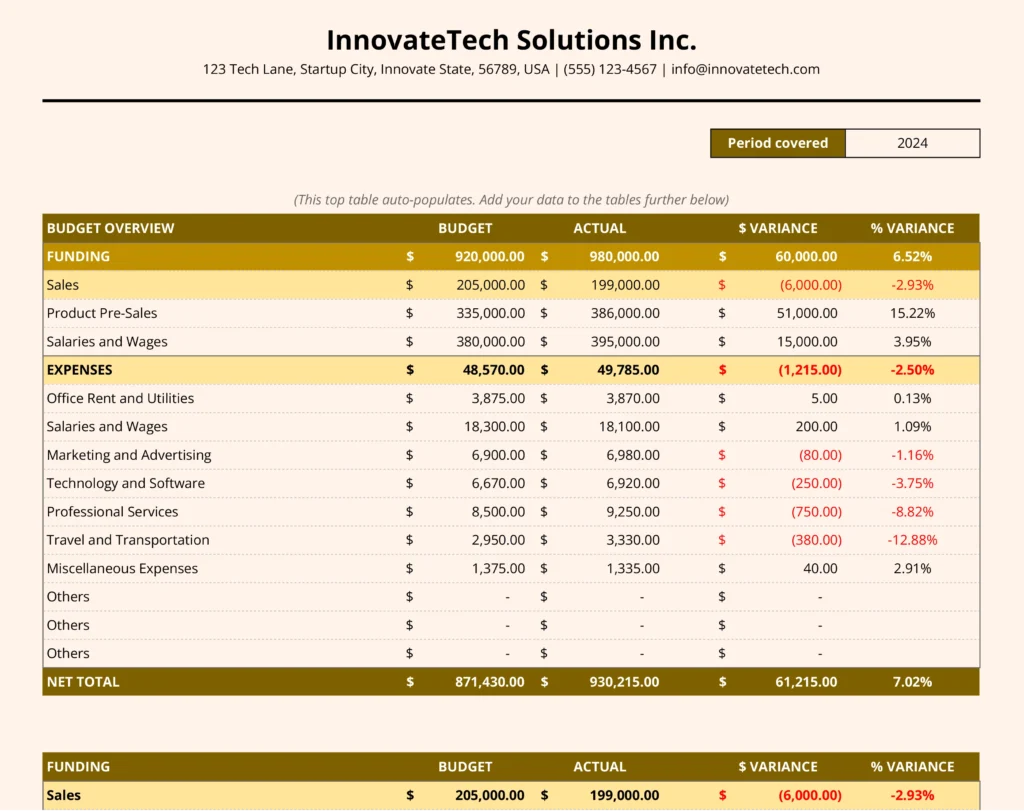
Accurate revenue planning is crucial for business success, but it can be complex and time-consuming. Coefficient’s free QuickBooks template for Revenue Planning and Projections simplifies the process, helping you make data-driven decisions with ease.
What is a Revenue Planning and Projections Report?
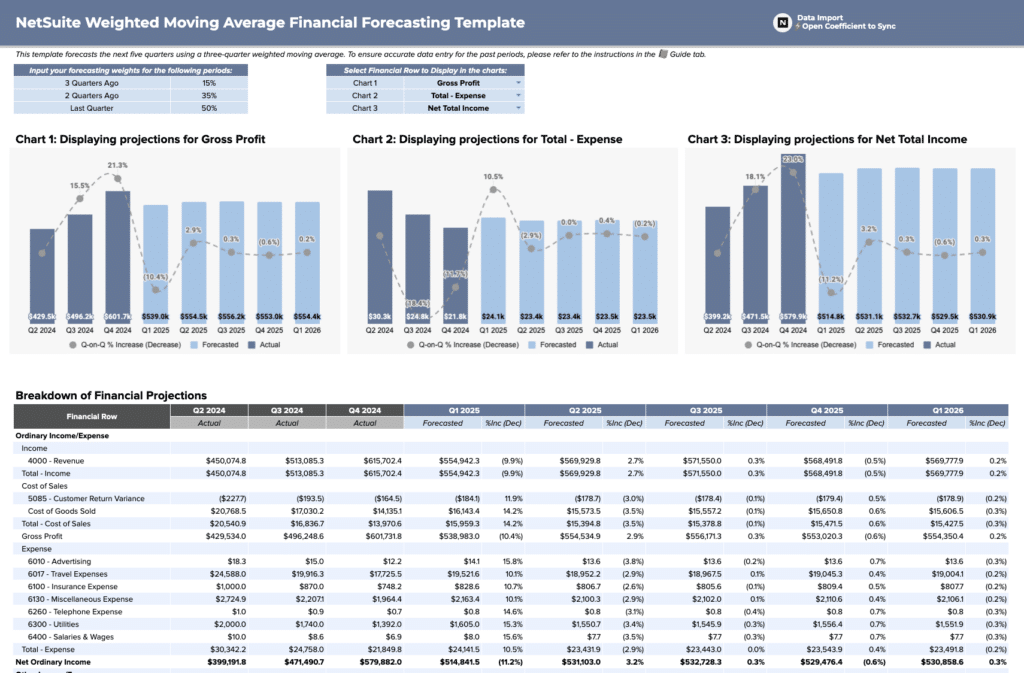
A Revenue Planning and Projections report is a financial tool that estimates a company’s future income over a specific period, typically a fiscal year or quarter. This report combines historical data, market trends, and strategic goals to forecast expected revenue. It’s essential for budgeting, resource allocation, and strategic decision-making, providing a roadmap for financial growth and helping businesses anticipate potential challenges or opportunities.
Who is the Revenue Planning and Projections template built for?
This template is designed for:
- Financial managers and CFOs
- Business owners and entrepreneurs
- Sales directors and revenue officers
- Strategic planners and analysts
- Startup founders and small business owners
Anyone responsible for financial forecasting, budgeting, or strategic planning in their organization will find this template valuable.
What is the primary use case for the Revenue Planning and Projections template?
The primary use case for this template is to create accurate and comprehensive revenue projections. It allows users to:
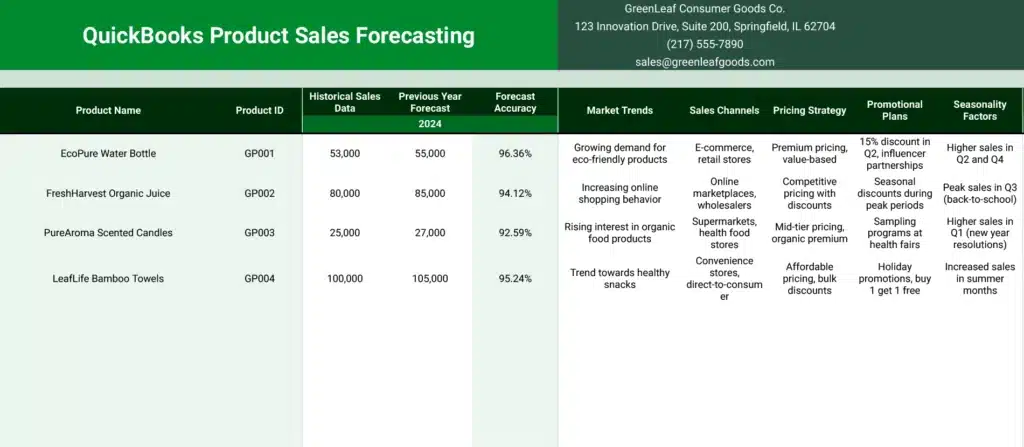
- Estimate future sales based on historical data and growth trends
- Factor in seasonality and market conditions
- Analyze different revenue streams and their contributions
- Adjust projections based on pricing strategies and new product launches
- Compare projected revenue against actual performance
- Make informed decisions about resource allocation and investments
Benefits of using the QuickBooks Revenue Planning and Projections Template
- Time-saving: Pre-built formulas and structure eliminate the need to create projections from scratch.
- Accuracy: Leverages QuickBooks data to ensure projections are based on real financial information.
- Flexibility: Easily adjust variables and scenarios to create multiple projection models.
- Comprehensive view: Includes various metrics and factors that influence revenue for a holistic projection.
- Decision support: Provides clear visualizations and summaries to aid in strategic decision-making.
Metrics Tracked in the Report
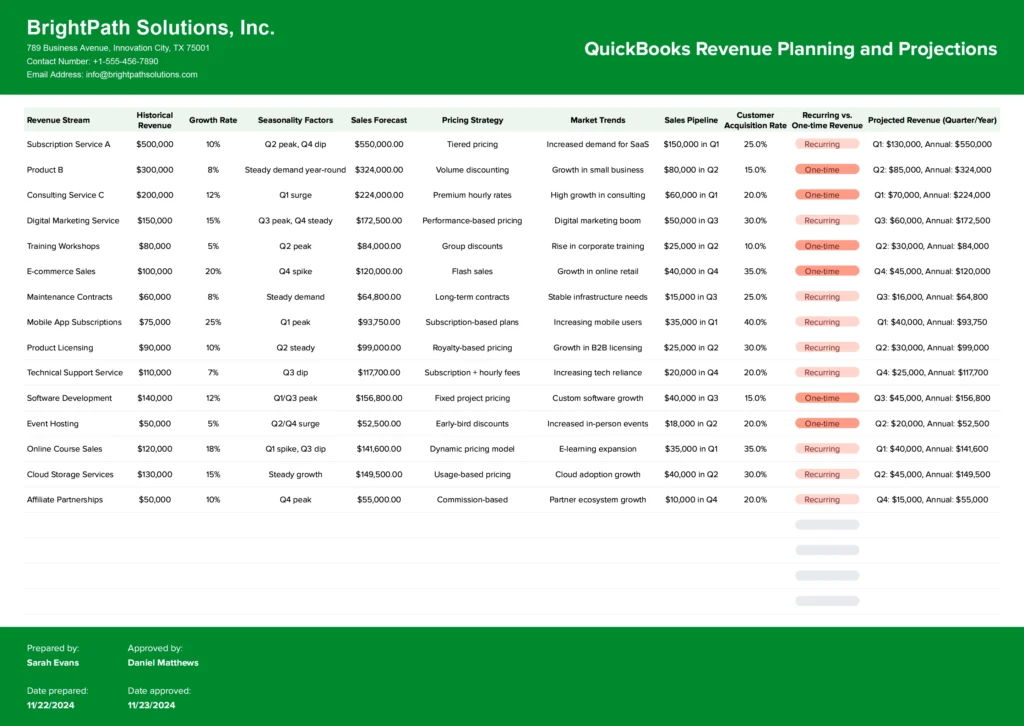
- Revenue Streams (Products/Services)
- Historical Revenue Data
- Growth Rates
- Seasonality Factors
- Sales Forecast
- Pricing Strategies
- Market Trends
- Sales Pipeline
- Customer Acquisition Rates
- Recurring vs. One-time Revenue
- Projected Revenue by Quarter/Year
More Metrics to track and analyze on Google Sheets
With Coefficient’s QuickBooks integration, you can pull additional data into your Google Sheets:
- Profit & Loss statements
- Budget vs. Actuals comparisons
- Expenses by Vendor
- Accounts Payable and Accounts Receivable data
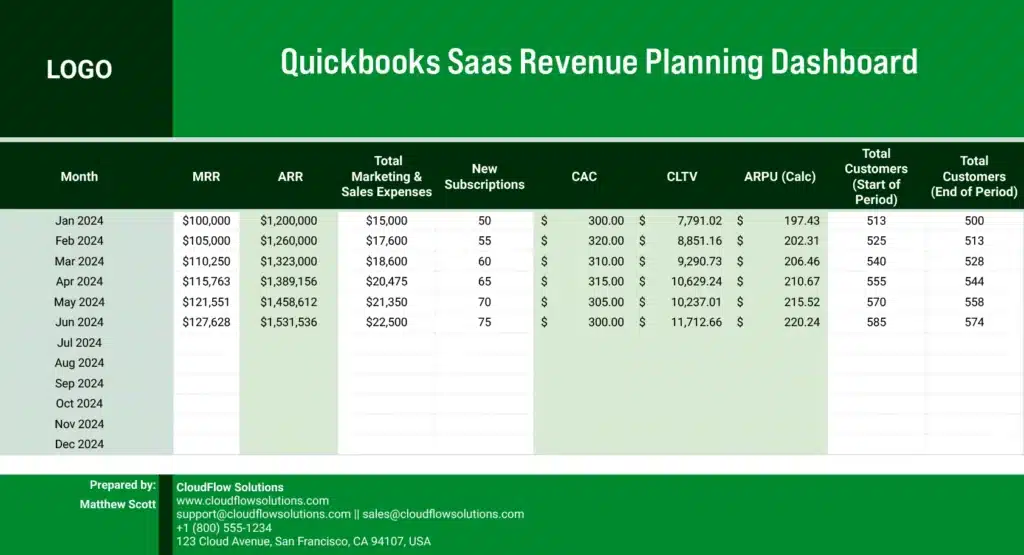
- Month-over-Month growth figures
- Consolidated Profit & Loss across multiple entities
- Custom financial reports
