


Managing operational expenses can be challenging without the right tools. Coefficient’s free QuickBooks template for OpEx budgeting simplifies the process, providing real-time data and powerful analytics to help you make informed financial decisions.
What is an OpEx Budget Report?
An OpEx (Operating Expense) Budget Report is a financial document that outlines and tracks a company’s day-to-day operational costs. This report typically includes expenses such as salaries, rent, utilities, and other recurring costs necessary for running the business.
An OpEx Budget Report is crucial for financial planning and control. It helps businesses forecast their regular expenses, compare actual spending to budgeted amounts, and identify areas where costs can be optimized. By maintaining a detailed OpEx budget, companies can make informed decisions about resource allocation, cost-cutting measures, and overall financial strategy.
Who is the OpEx Budget Template Built For?
This OpEx Budget template is designed for:
- Financial managers and CFOs seeking to streamline expense tracking
- Small to medium-sized business owners looking to gain better control over operational costs
- Accounting professionals responsible for budget preparation and analysis
- Startup founders aiming to optimize their operational spending
What is the Primary Use Case for the OpEx Budget Template?
The primary use case for this OpEx Budget template is to provide a comprehensive, real-time view of a company’s operational expenses. It allows users to:
- Track and categorize various operational expenses
- Compare budgeted amounts with actual expenditures
- Analyze variances and identify cost-saving opportunities
- Monitor expenses over time and spot trends
- Make data-driven decisions about resource allocation and cost management
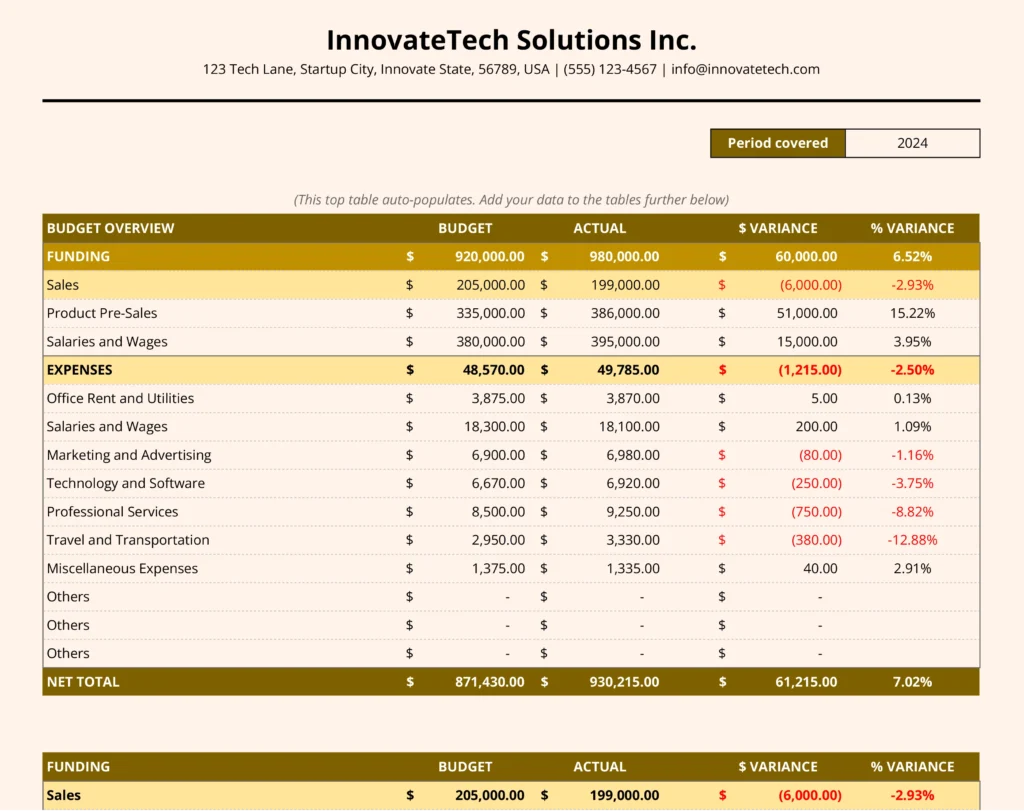
Benefits of Using the QuickBooks OpEx Budget Template
- Real-time data synchronization: Get up-to-date financial information directly from QuickBooks
- Automated calculations: Save time with pre-built formulas for variance analysis and totals
- Customizable categories: Tailor expense categories to fit your specific business needs
- Visual representations: Easily interpret data with built-in charts and graphs
- Collaborative features: Share and work on the budget with team members in real-time
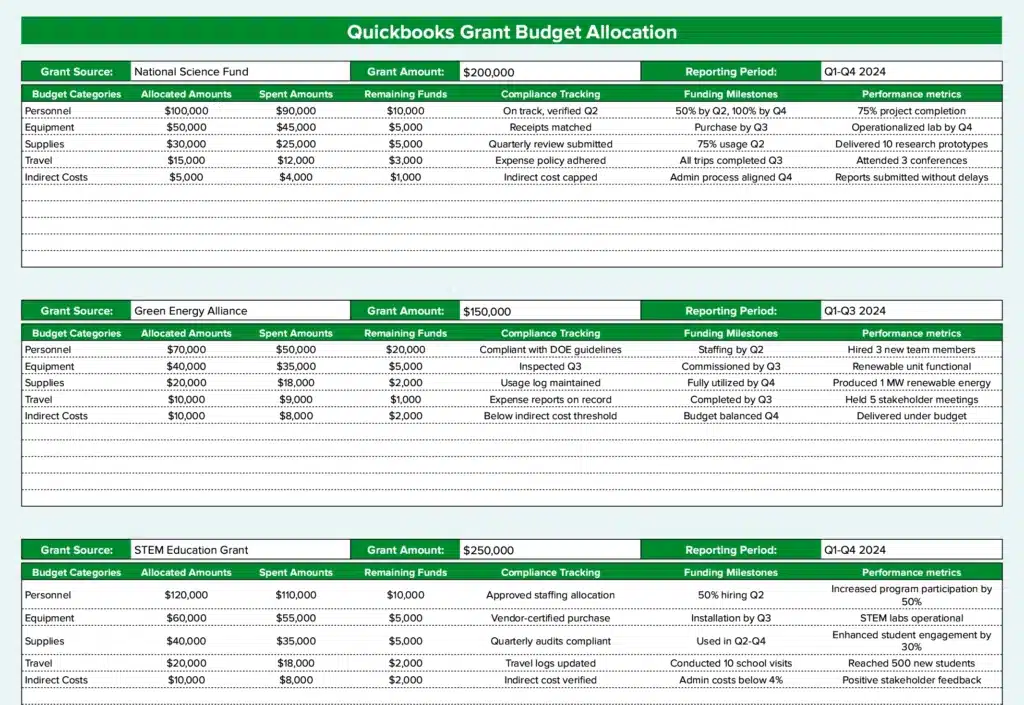
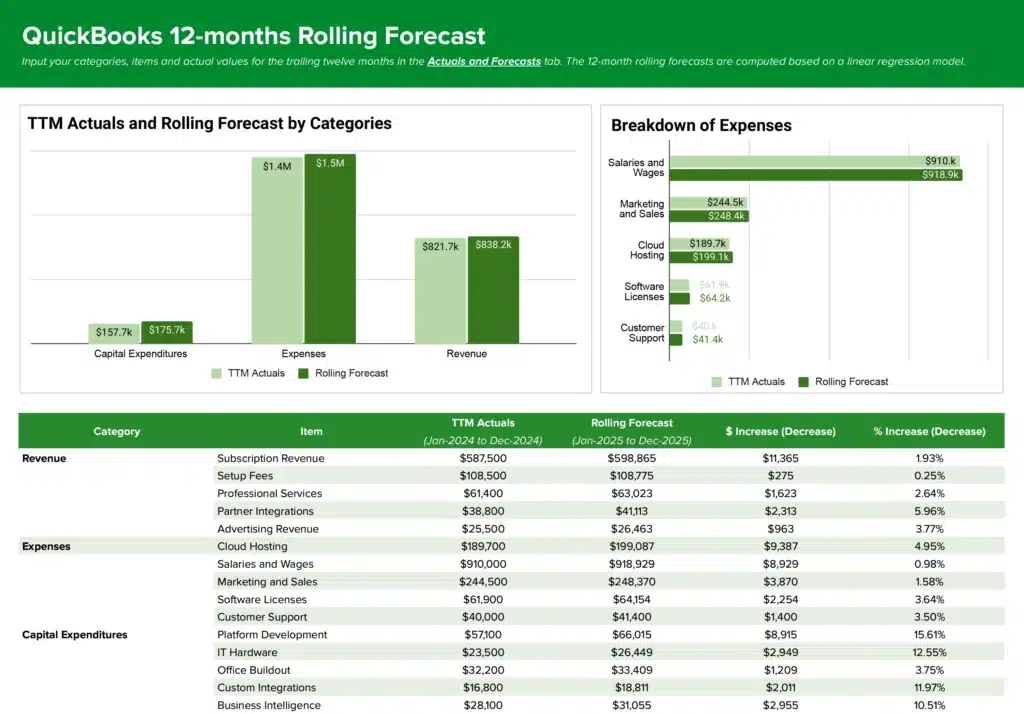
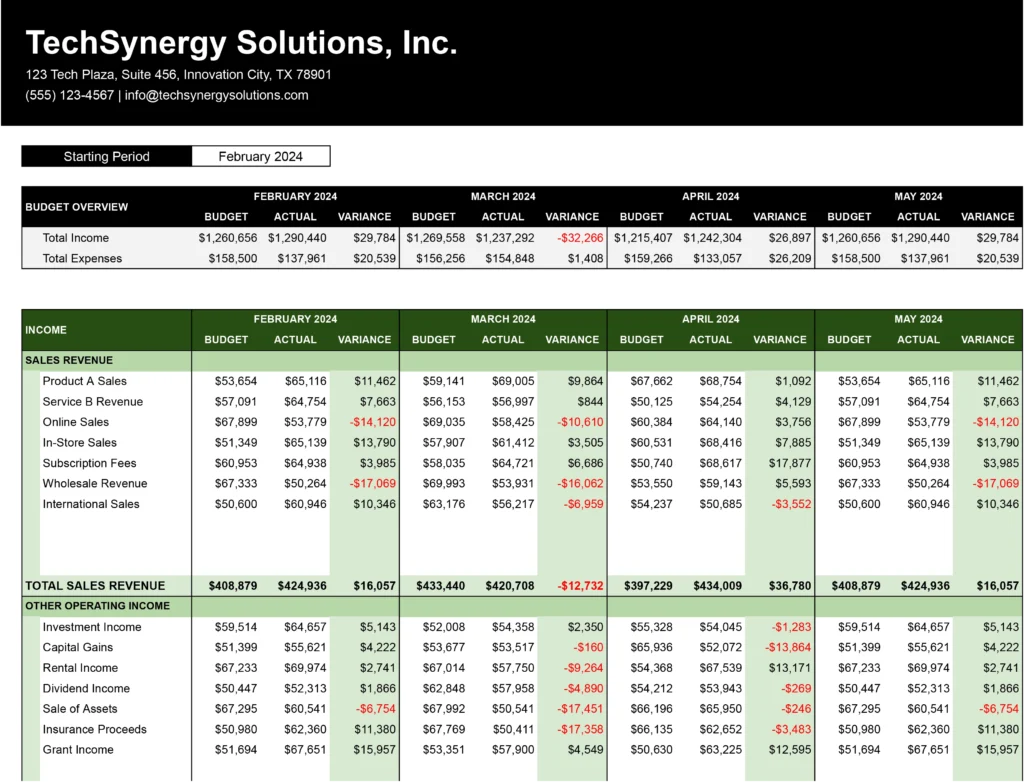
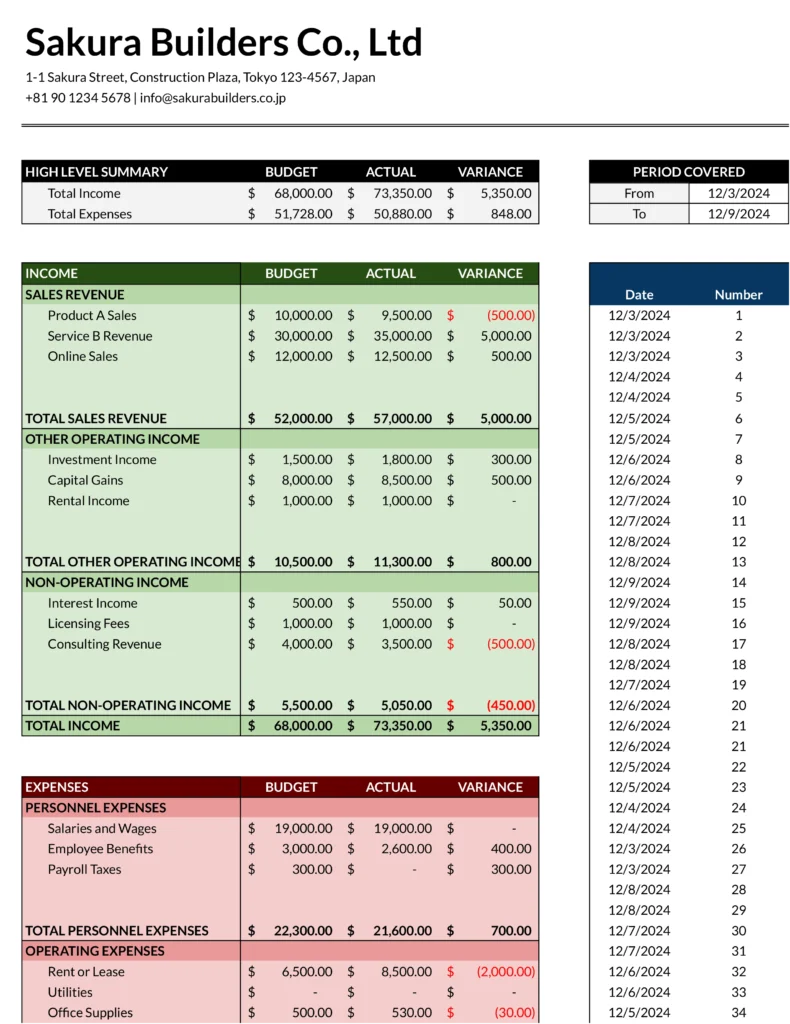
Metrics Tracked in the Report
- Operational Expense Categories (Salaries and Wages, Rent, Utilities, Marketing, IT Expenses, Office Supplies)
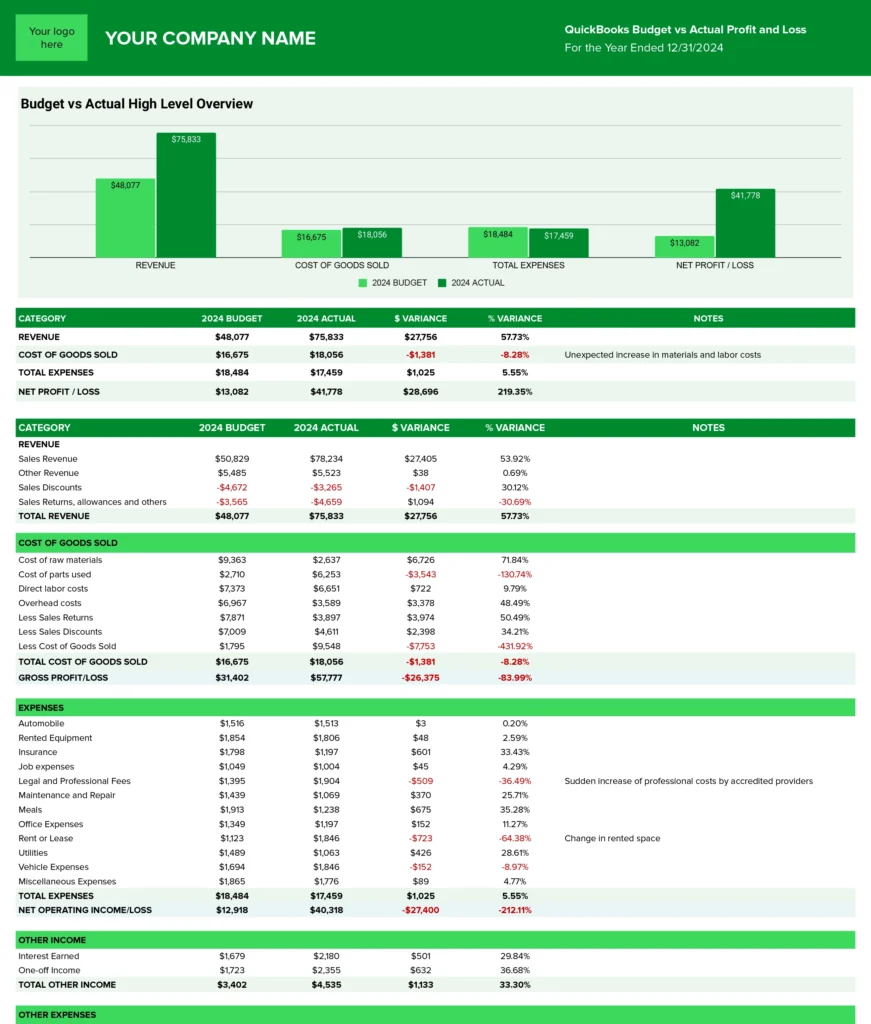
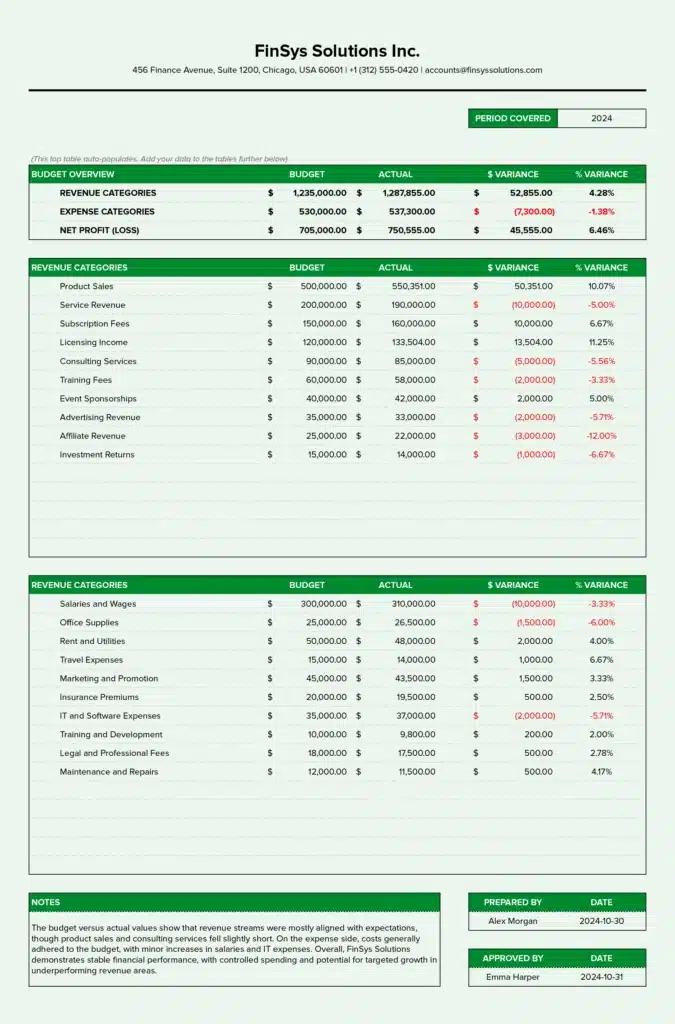
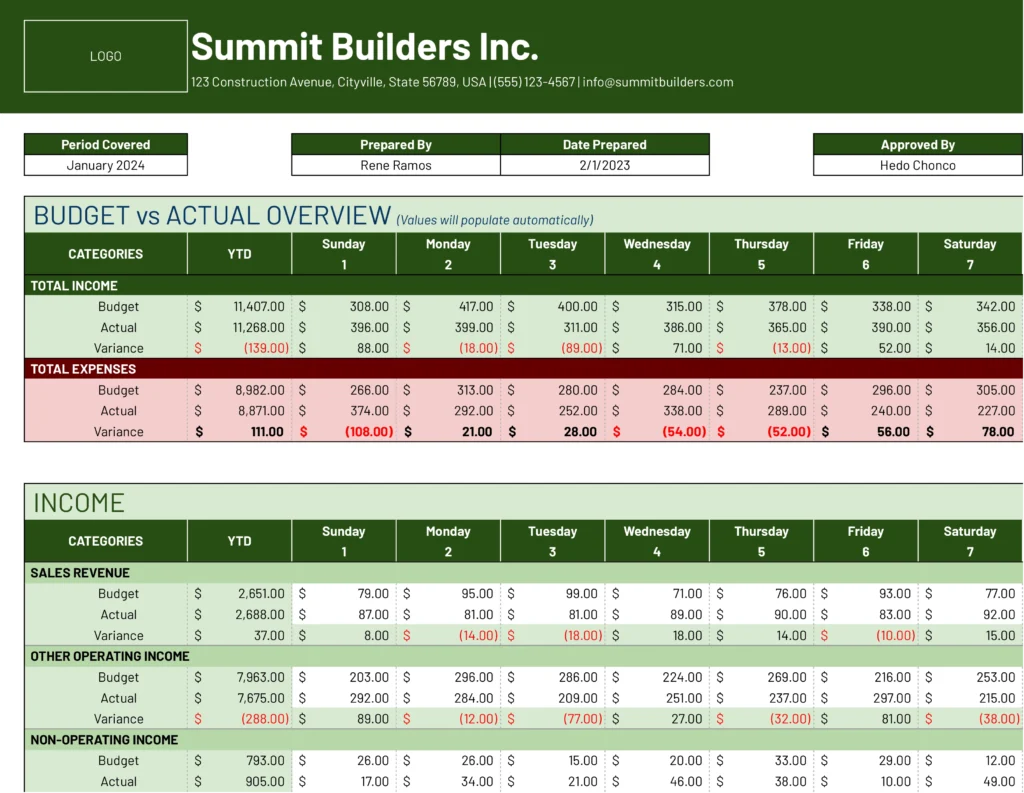
- Budgeted Amounts per Category
- Actual Expenditures
- Variance Analysis
- Monthly/Quarterly Breakdown
- Year-to-Date Totals
- Cost-saving Initiatives
- Notes/Comments
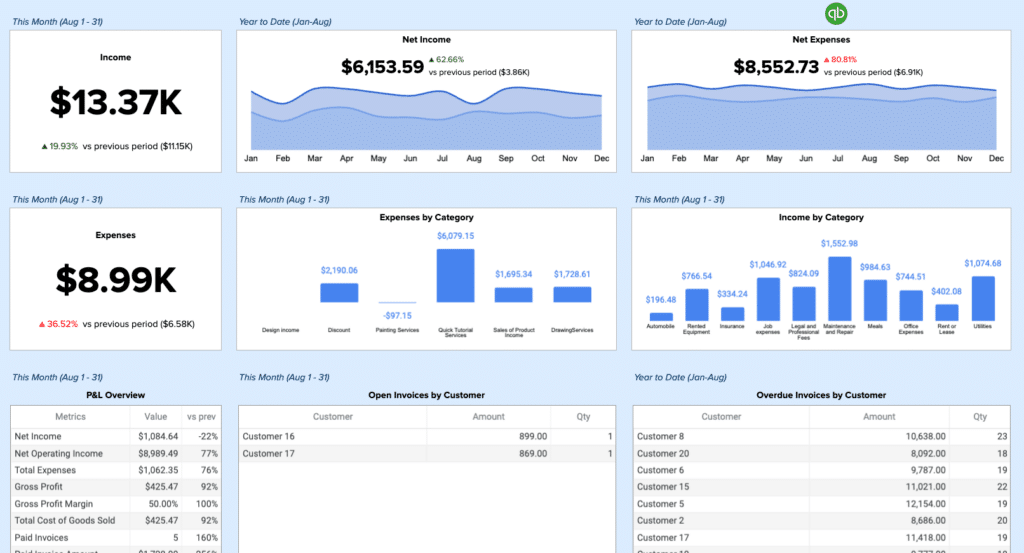
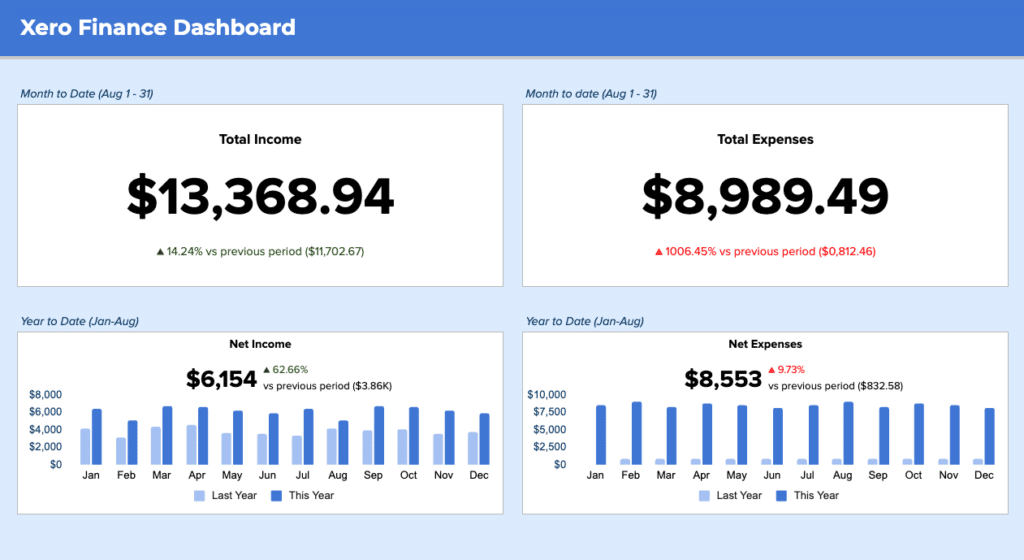
More Metrics to Track and Analyze on Google Sheets
With Coefficient’s QuickBooks integration, you can pull additional data into your Google Sheets, including:
- Profit & Loss statements
- Balance Sheet information
- Accounts Payable and Accounts Receivable data
- Cash flow statements
- Sales by customer or product
- Expense details by vendor
- Department or location-specific financial data