


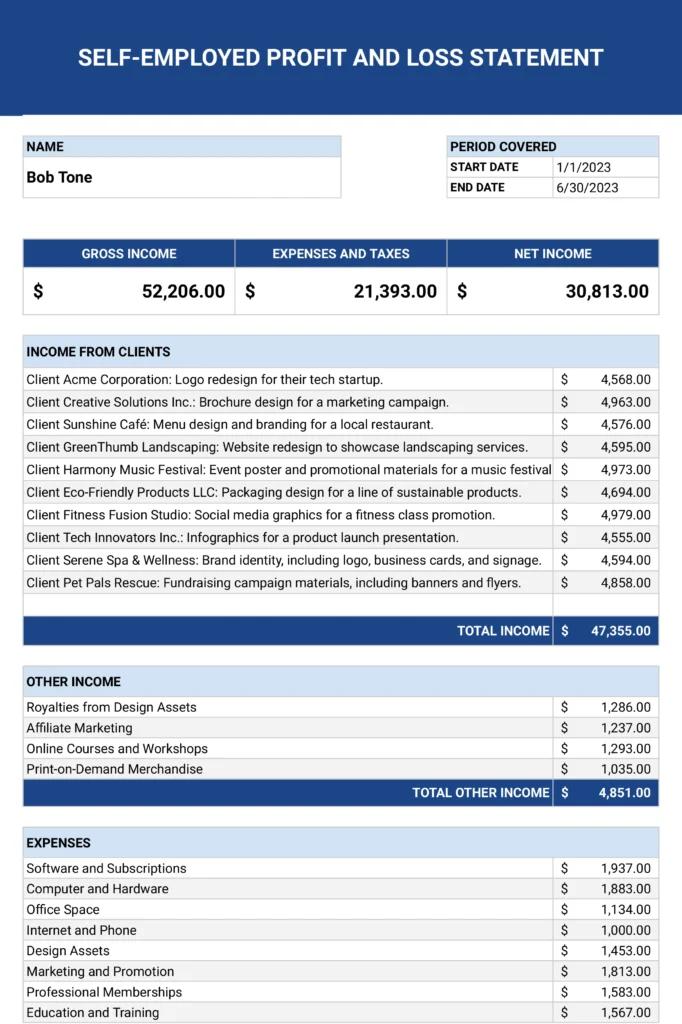


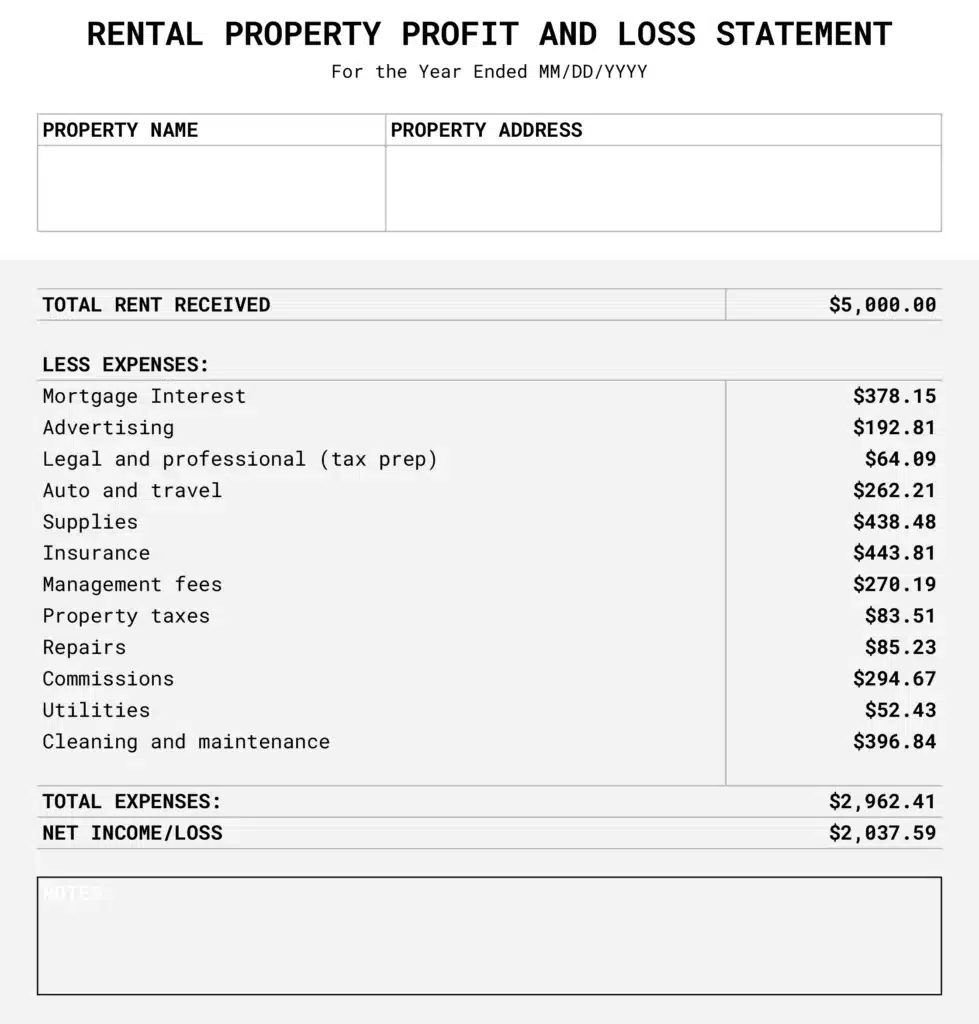

What is the P&L?
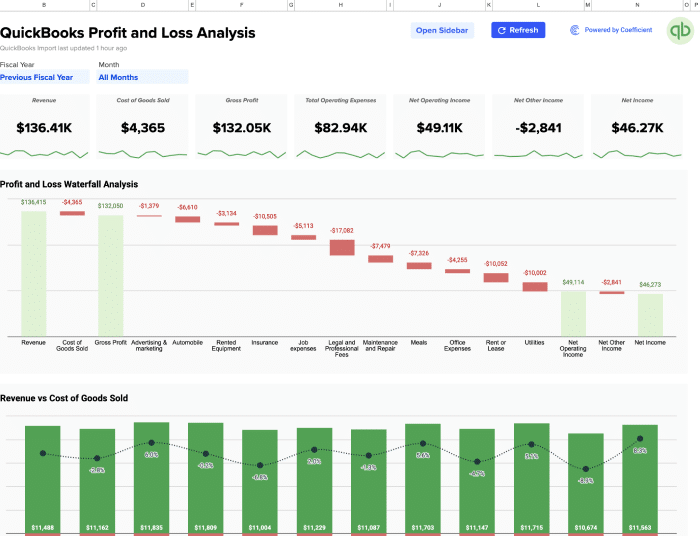
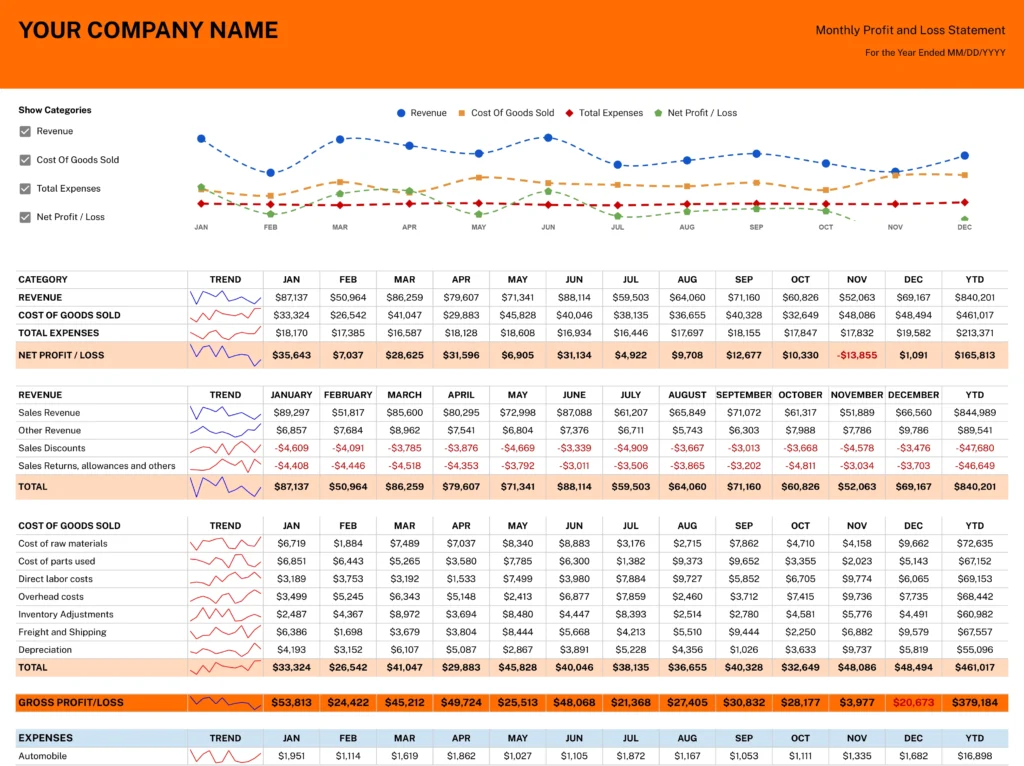
A profit and loss (P&L) statement, also known as an income statement, shows your company's revenues, expenses, and profits and losses over a given period of time. It is used to determine the profitability of your business.
It helps to evaluate the cash flow of the business and predict its future performance on a monthly, quarterly, and annual basis.
How Do I Create a P&L in Google Sheets?
Here are the steps you need to follow to create a Google Sheets profit and loss template:
- Open Google Sheets
- Setup P&L layout
- Enter data
- Calculate subtotal
- Format your P&L statement
- Review and update
- Add additional information (optional)
- Save and share
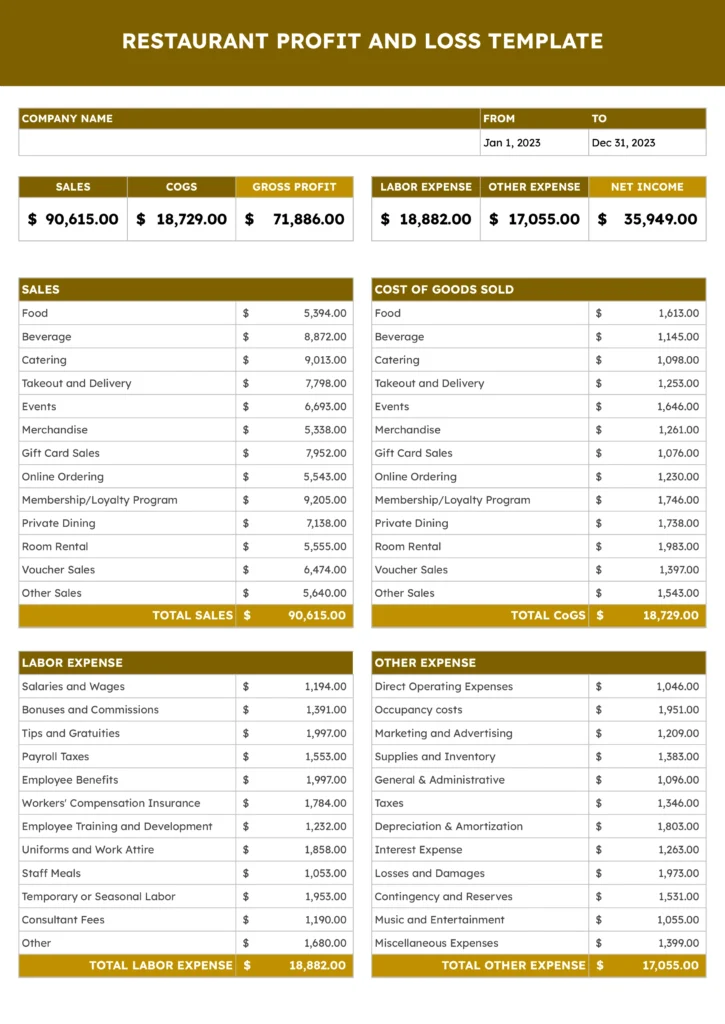
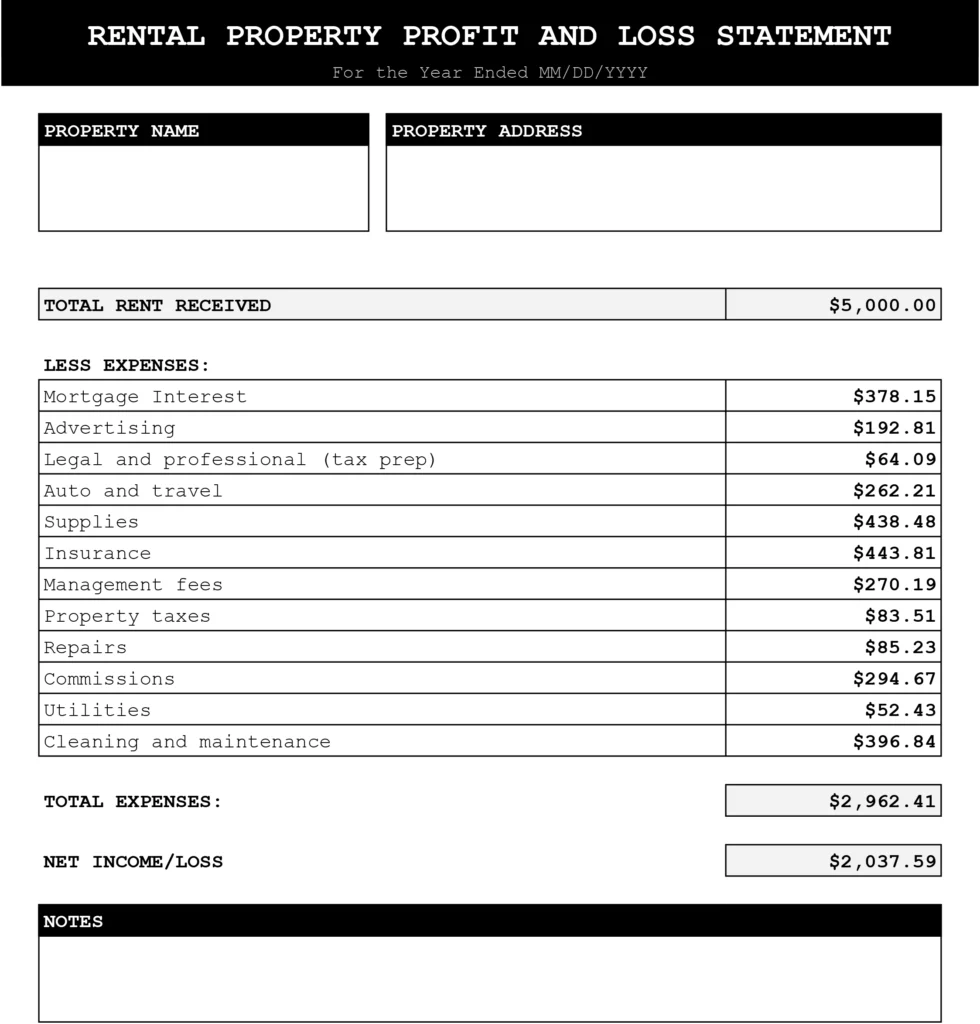
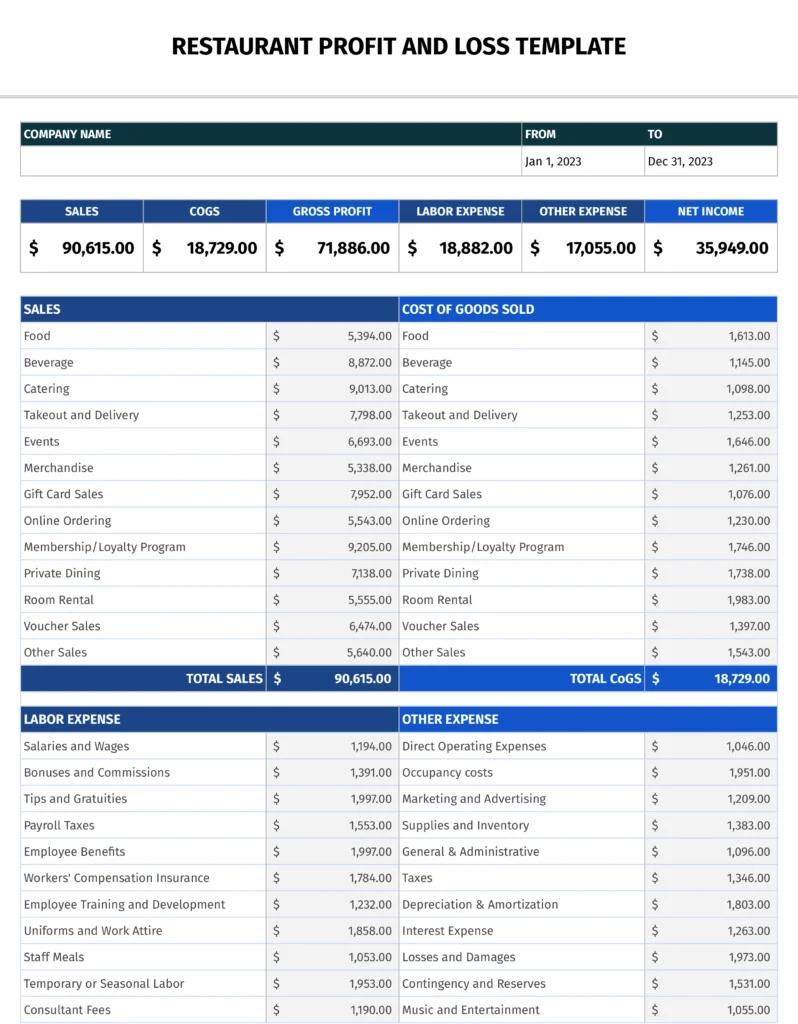
What are the Key Components of a P&L Statement?
Revenue/Income
Revenue, also known as sales, represents the total amount of money a business earns through its core products or services.
Cost of Goods Sold
This represents the direct costs to produce the goods or services sold by a company. It encompasses materials and labor but doesn't account for indirect expenses like shipping or sales team salaries.
COGS = The starting inventory + Purchases – Ending Inventory
Gross Profit
An indicator of profitability from core operations, gross profit is calculated by subtracting COGS from revenue. It highlights the profit made after covering direct production costs.
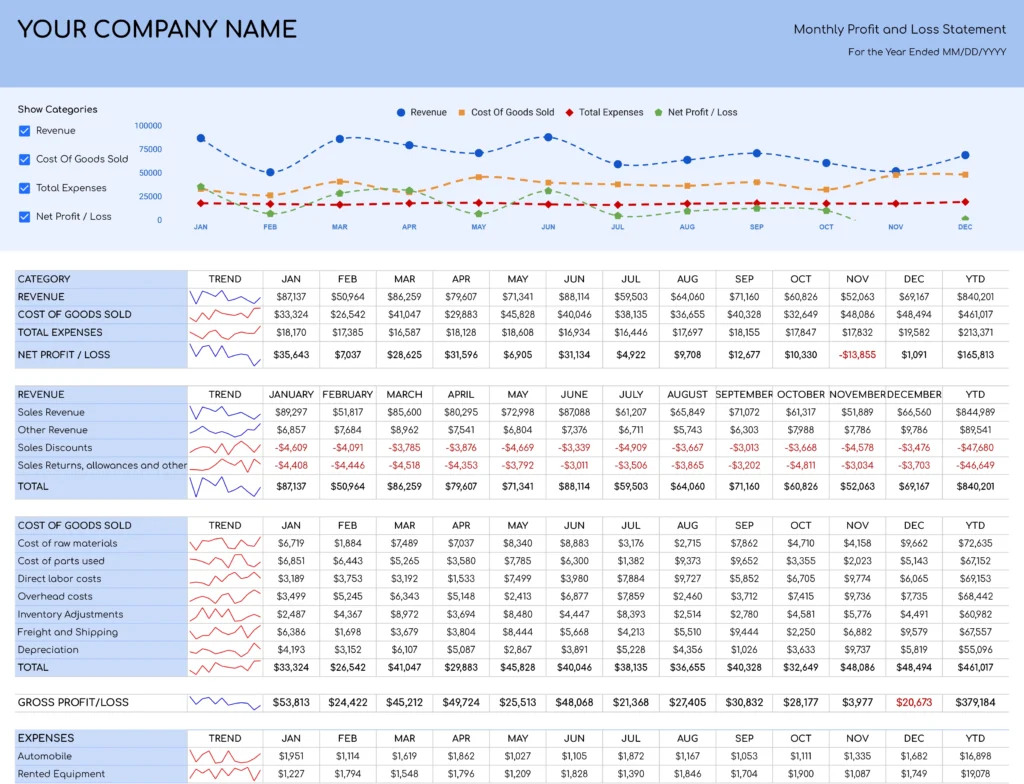
Operating Expenses
These are costs incurred during regular business operations and include rent, salaries, marketing, insurance, and more.
Net Income
Net income is also known as net earnings. This is situated in the bottom line of the P&L statement. Net income is a critical indicator of the company's overall financial health and profitability, indicating whether it has made a profit or incurred a loss during the specified period.
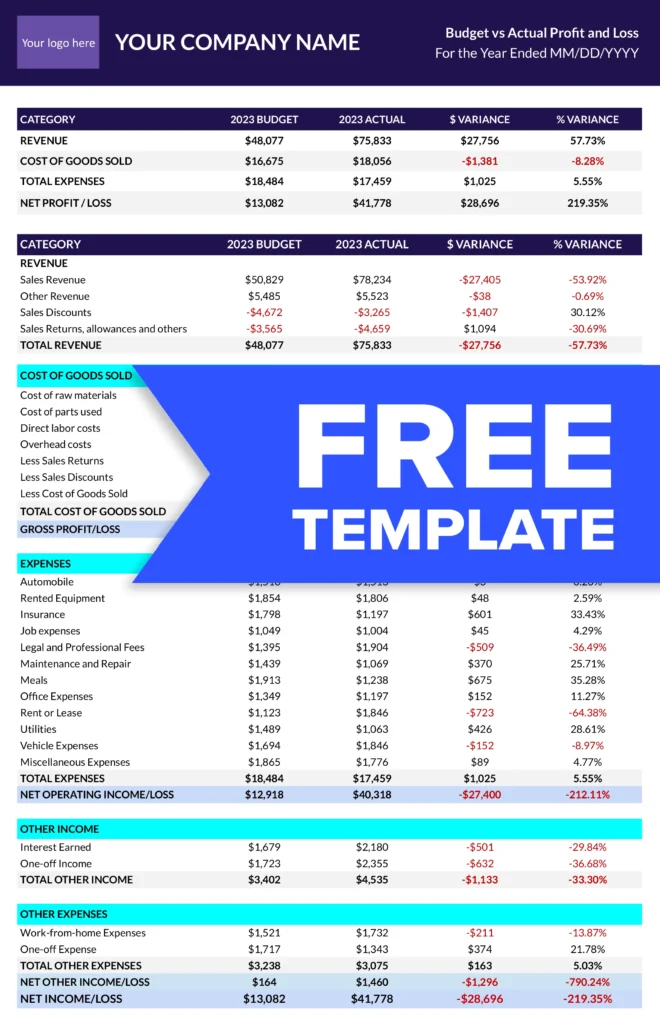
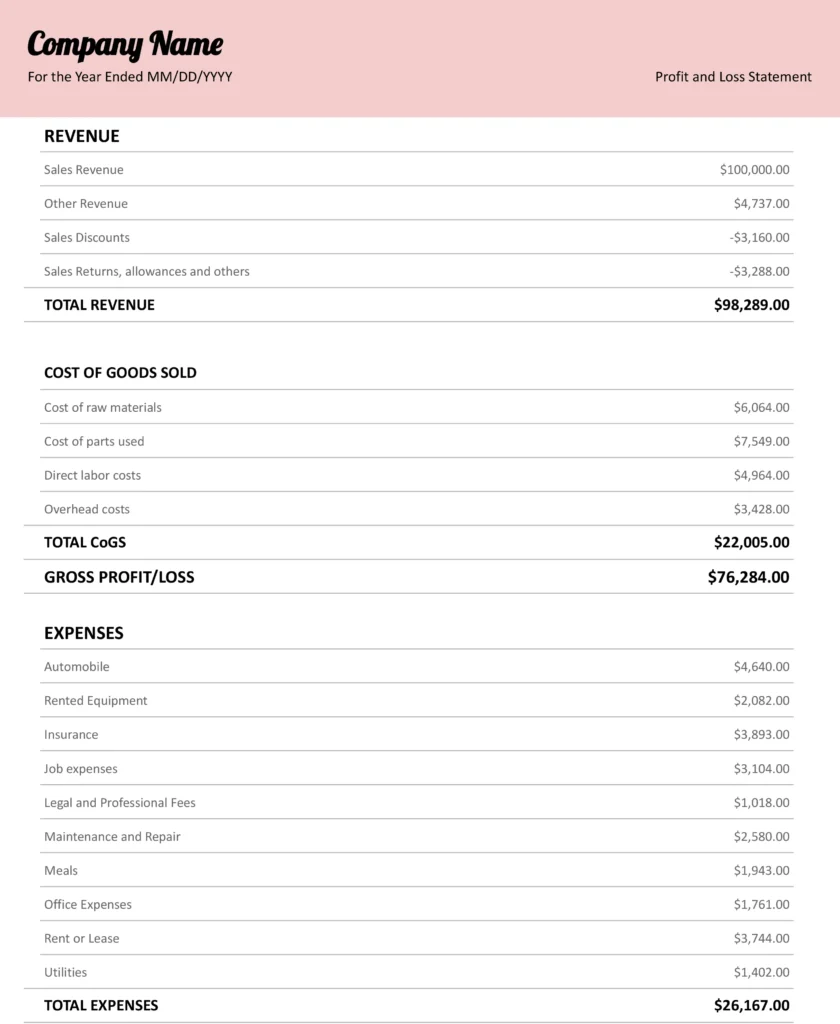
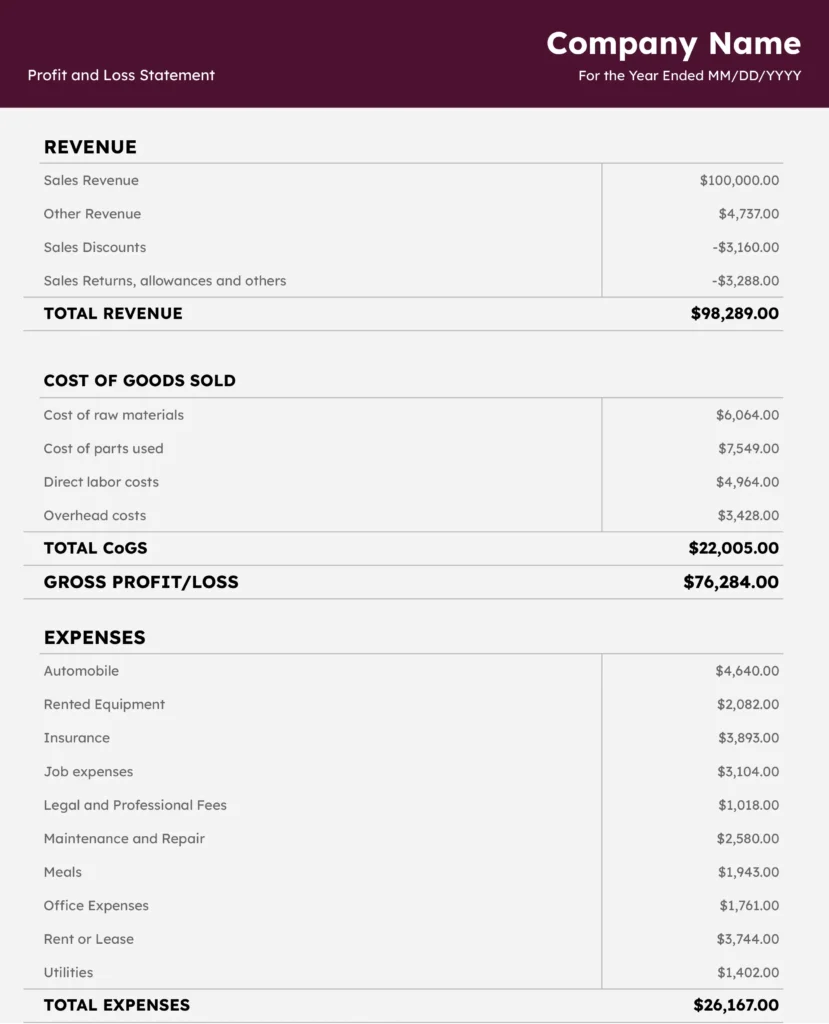
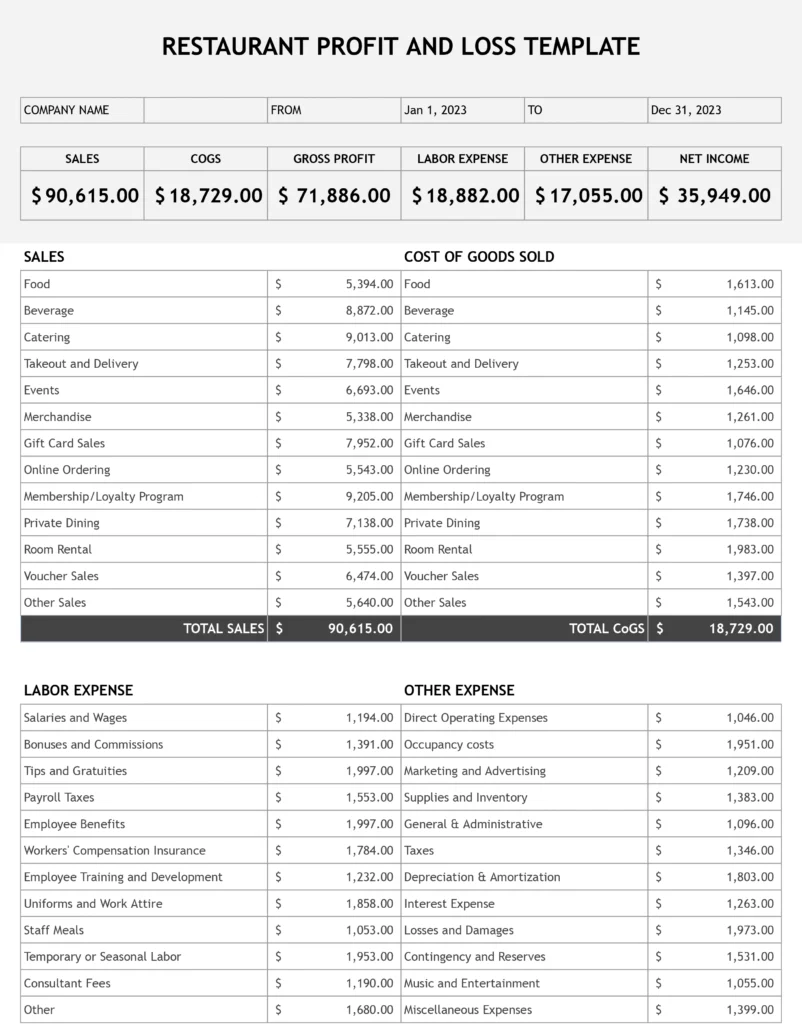
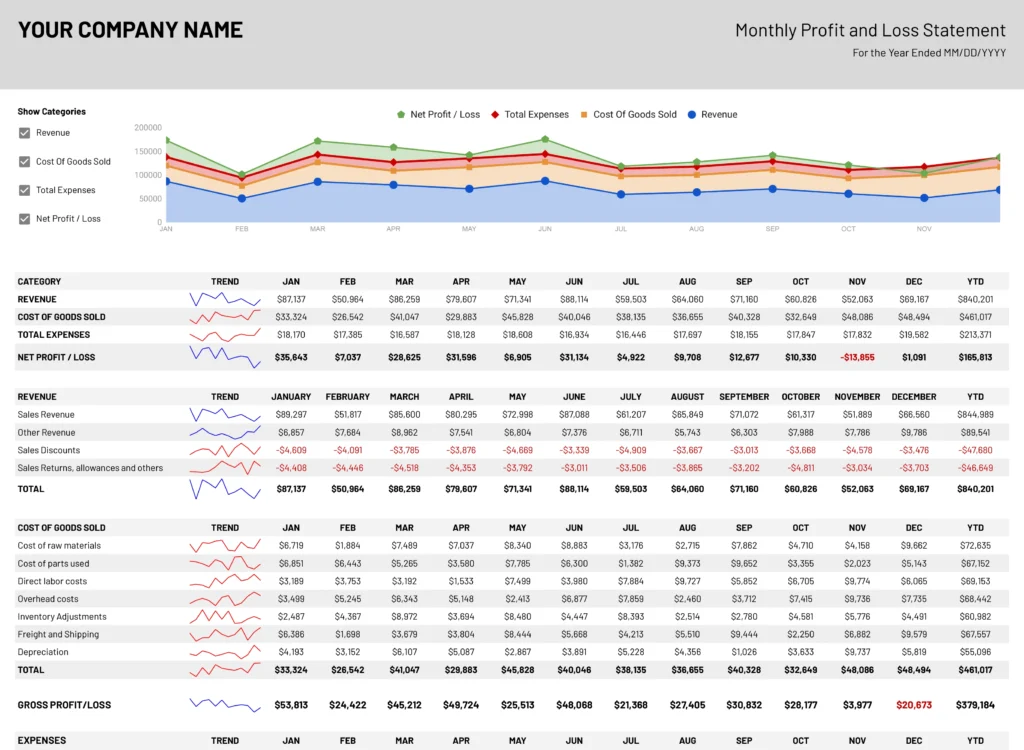
How is the Information Organized?
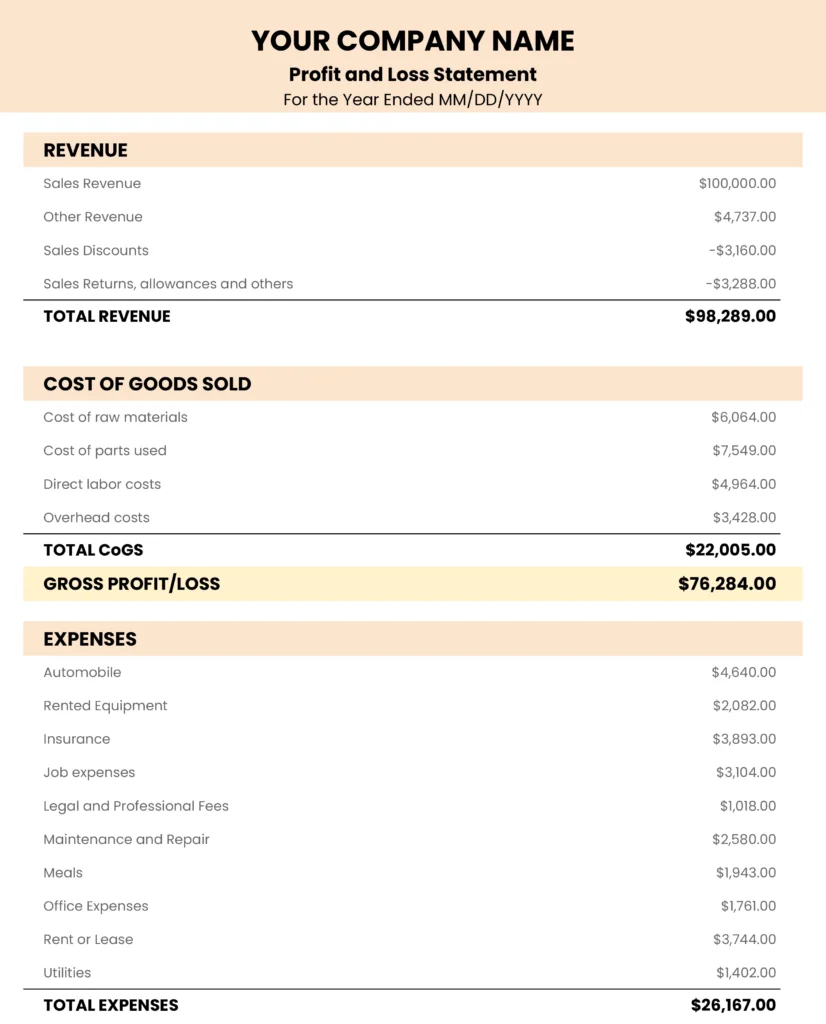
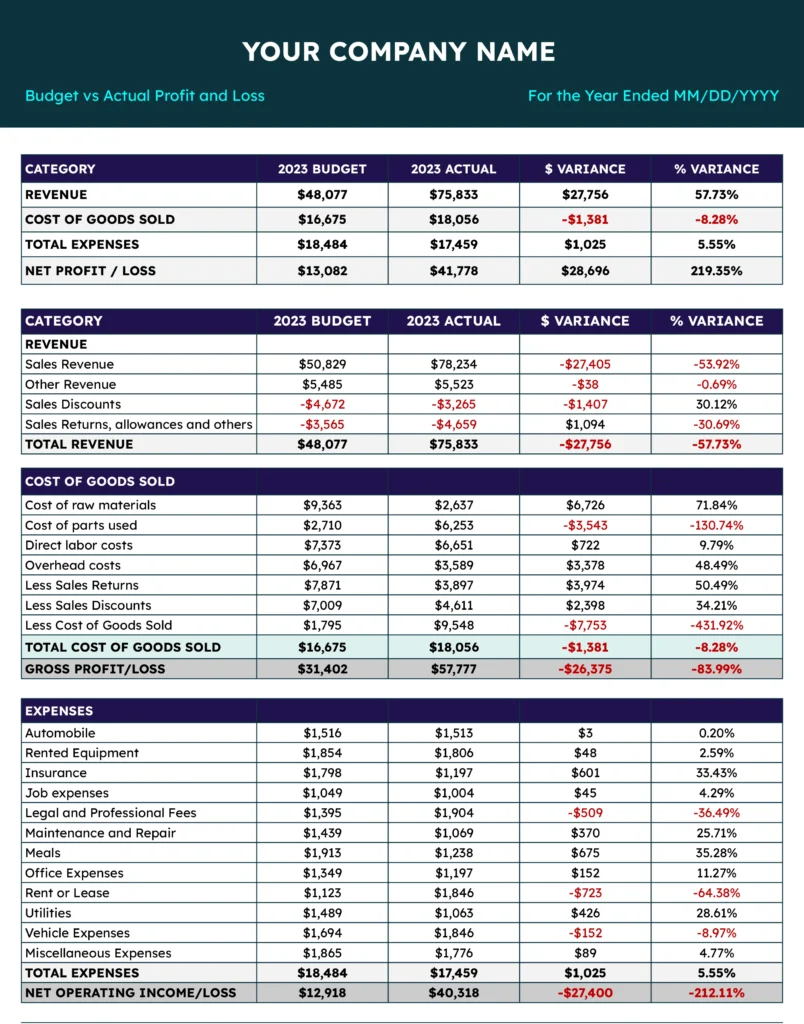
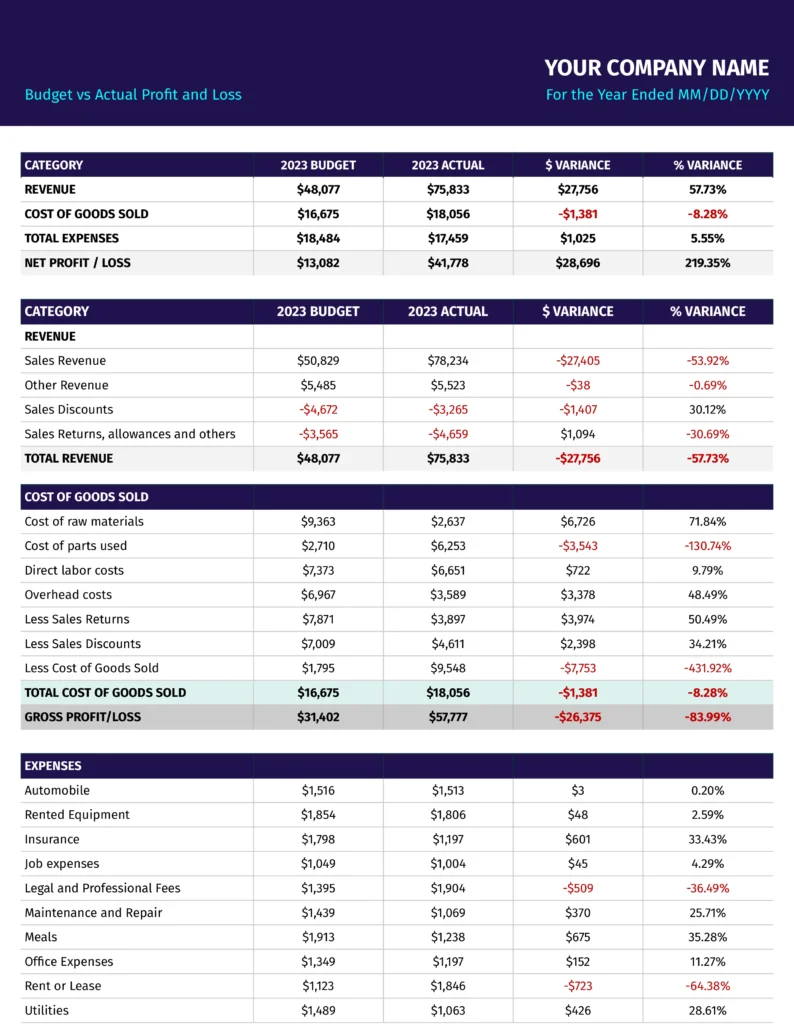
Here's the typical format of a P&L statement:
Revenue/Income
This is the starting point of the P&L statement. It is determined by multiplying the average sale price by the number of units sold.
Costs of Goods Sold
This section accounts for the direct costs associated with producing goods or services. It includes all the expenses like raw materials, manufacturing costs, and labor.
Calculate it by subtracting… the COGS from the total income the company makes,
Gross Profit
Gross profit is the money you earn after subtracting the total cost to produce and sell them.
The formula to calculate gross profit is:
Gross Profit = Revenue(or sales) - Costs of Goods Sold (COGS)
Operating Expenses
This category includes all the indirect costs associated with the business. It is determined by minus operating expenses from Gross profit.
Operating Expenses = Total Expenses - Non-Operating expenses
Other Income/Expenses
This category accounts for any earned or paid and other non-operating income or expenses such as loans or investments.
Net Income
Net income represents the financial health(P&L) of the business. It can be calculated by subtracting income tax expenses from income before tax.
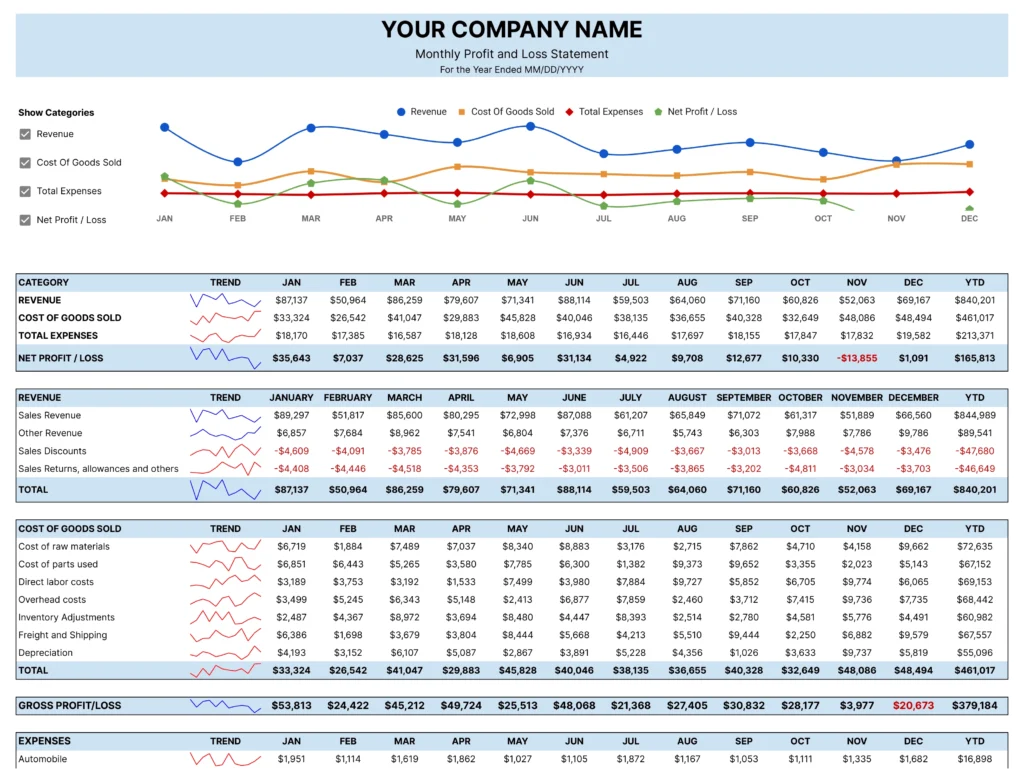
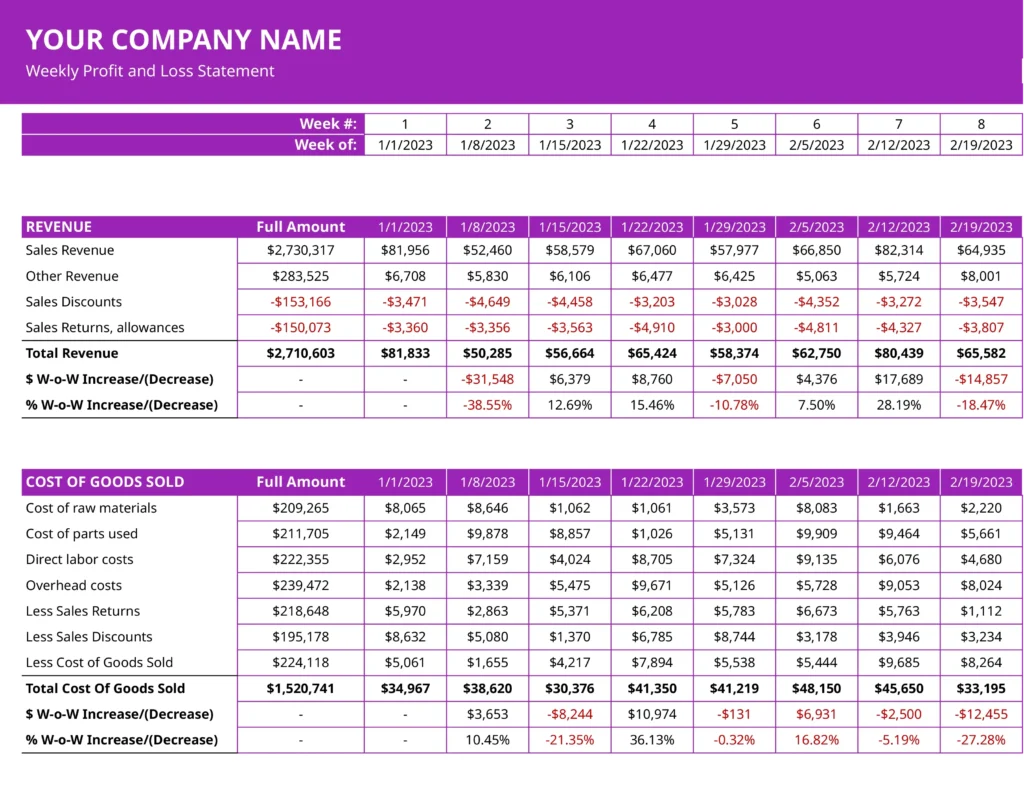
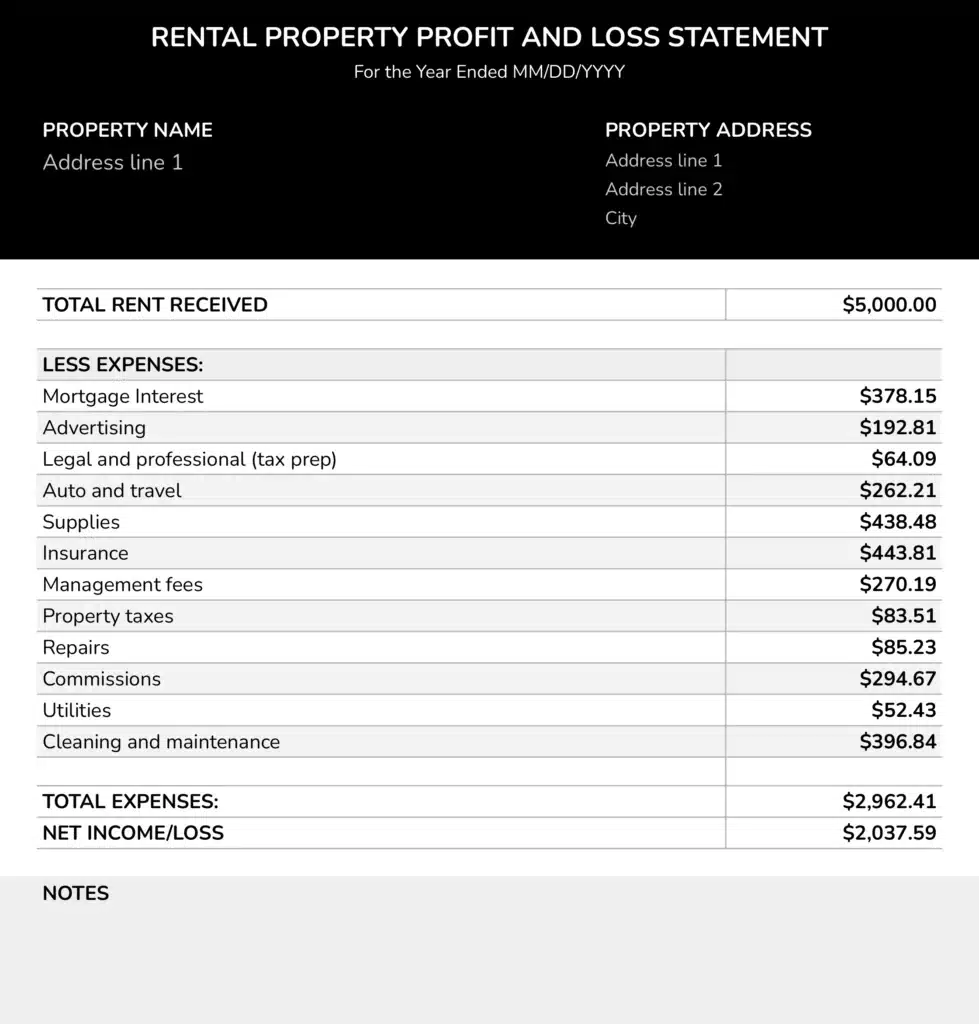
How Often Should I Update The P&L Statement?
P&L statements depend on your business needs and accounting practices. Here are some common intervals at which P & L statements are updated:
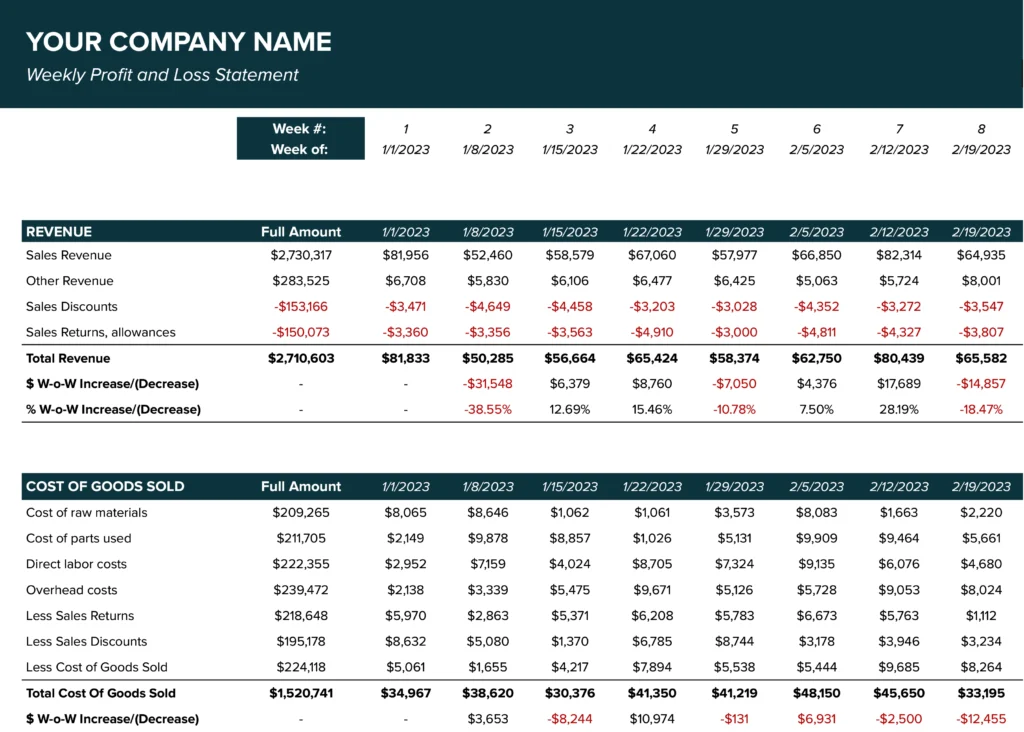
- Monthly: Some businesses update their P&L statement on a monthly basis. This allows you to track financial performance and help in making timely decisions.
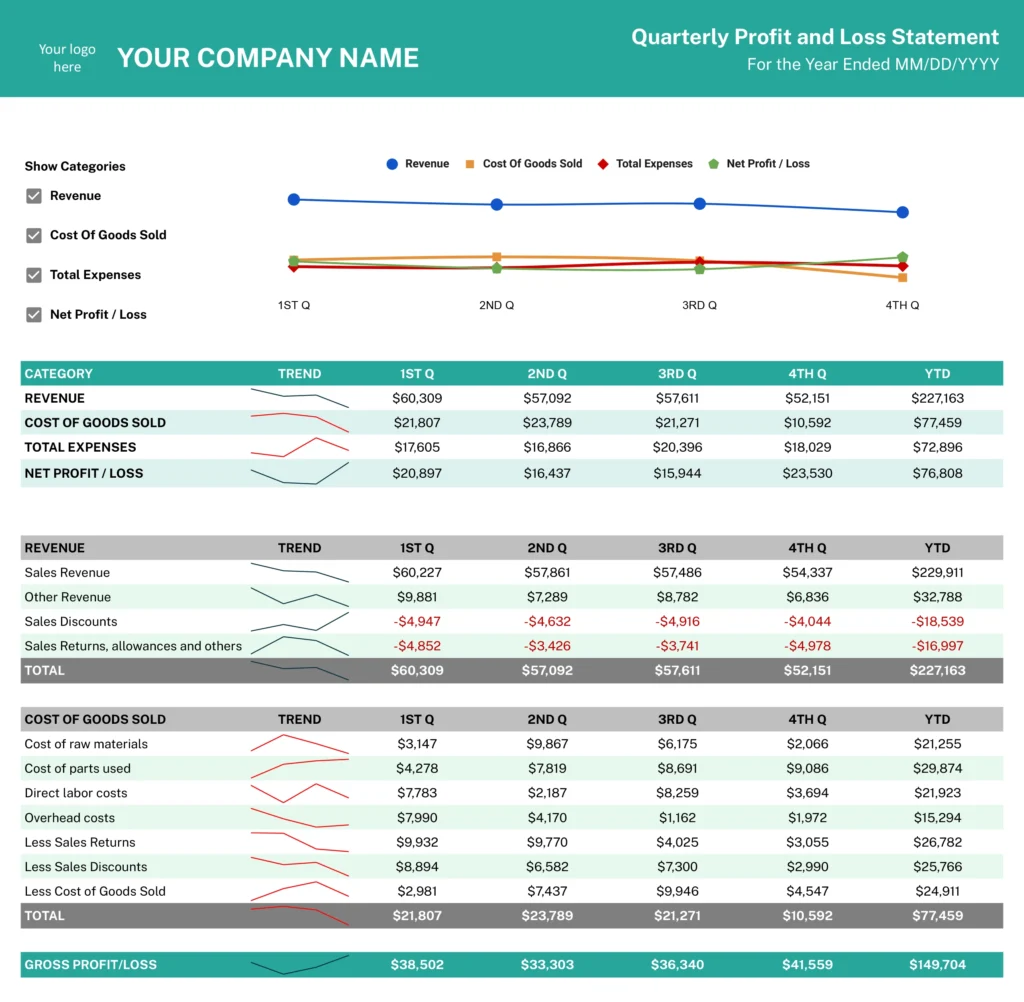
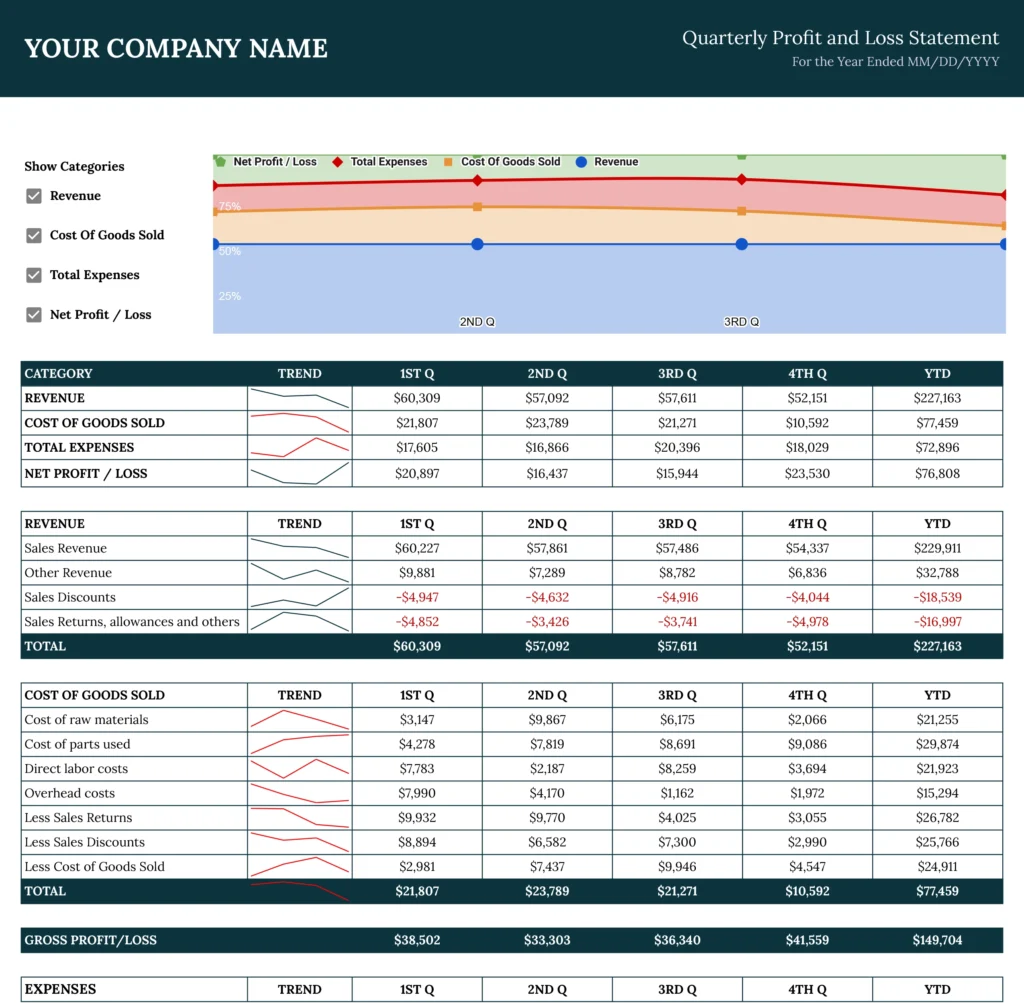
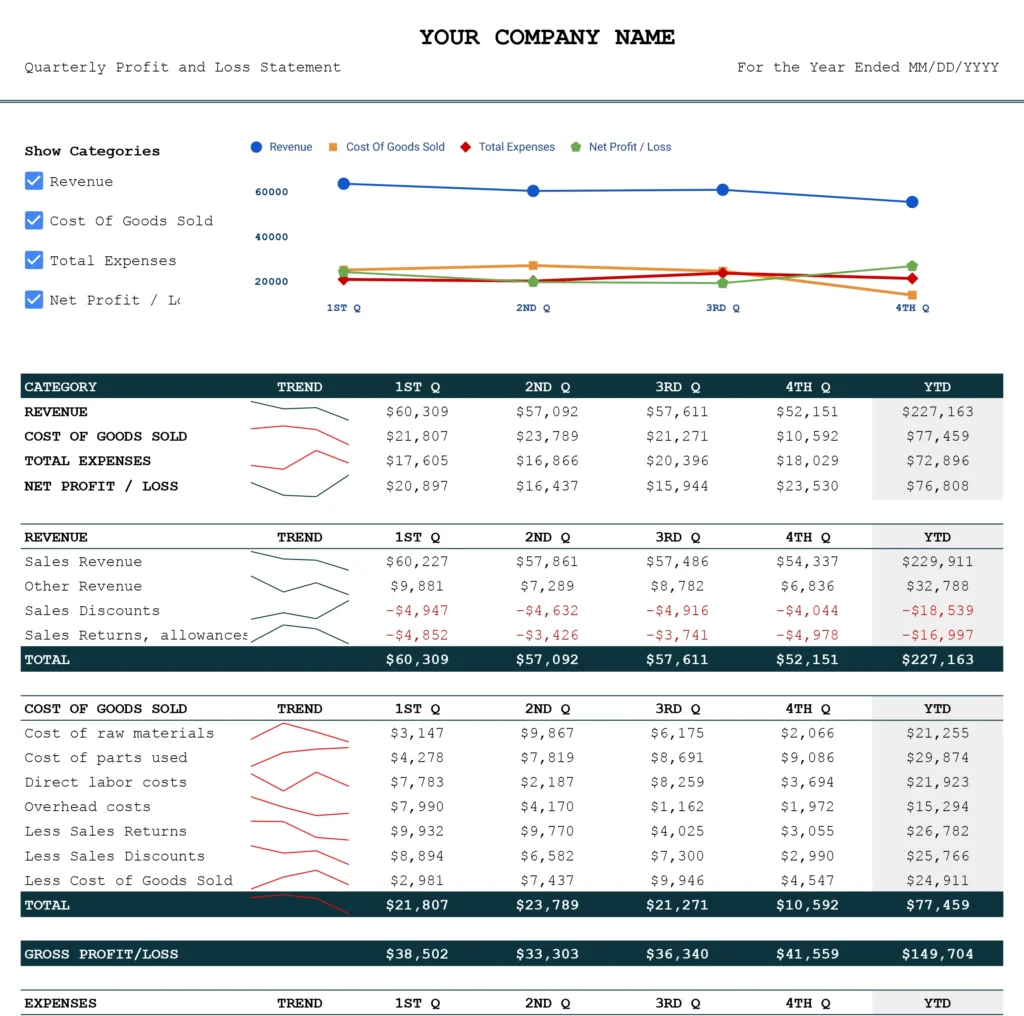
- Quarterly: Some smaller businesses with less financial fluctuation update their P&L on a quarterly base. This can be helpful for assessing performance and strategic adjustments.
- Annually: Large businesses with stable finances update their P&L statement annually. This is often done for tax purposes and assessing yearly financial performance.