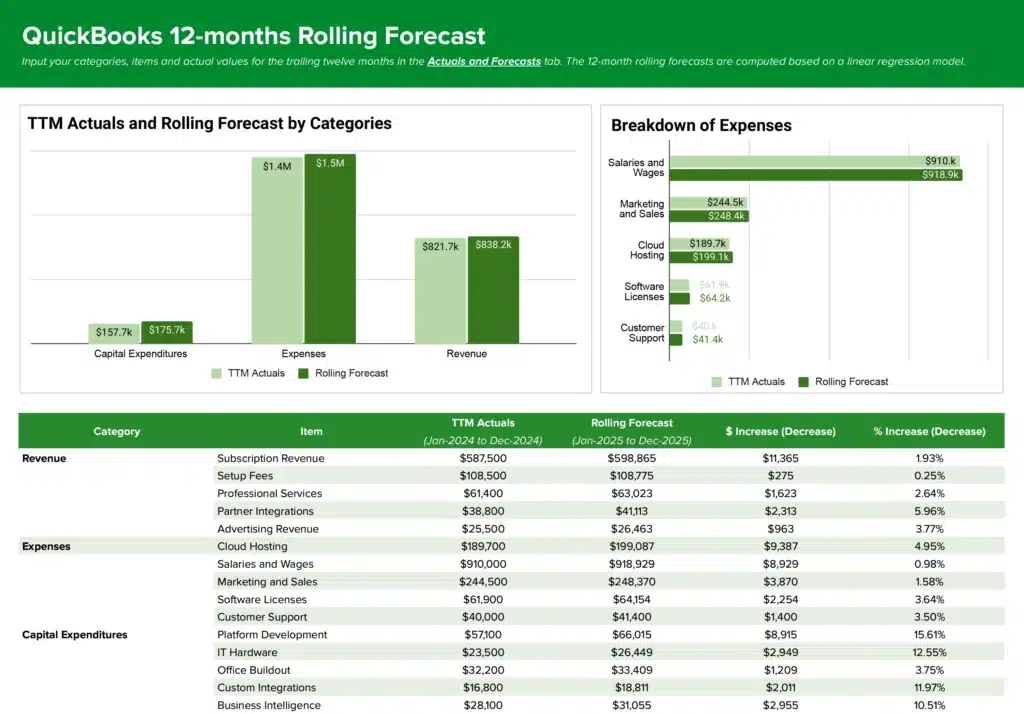
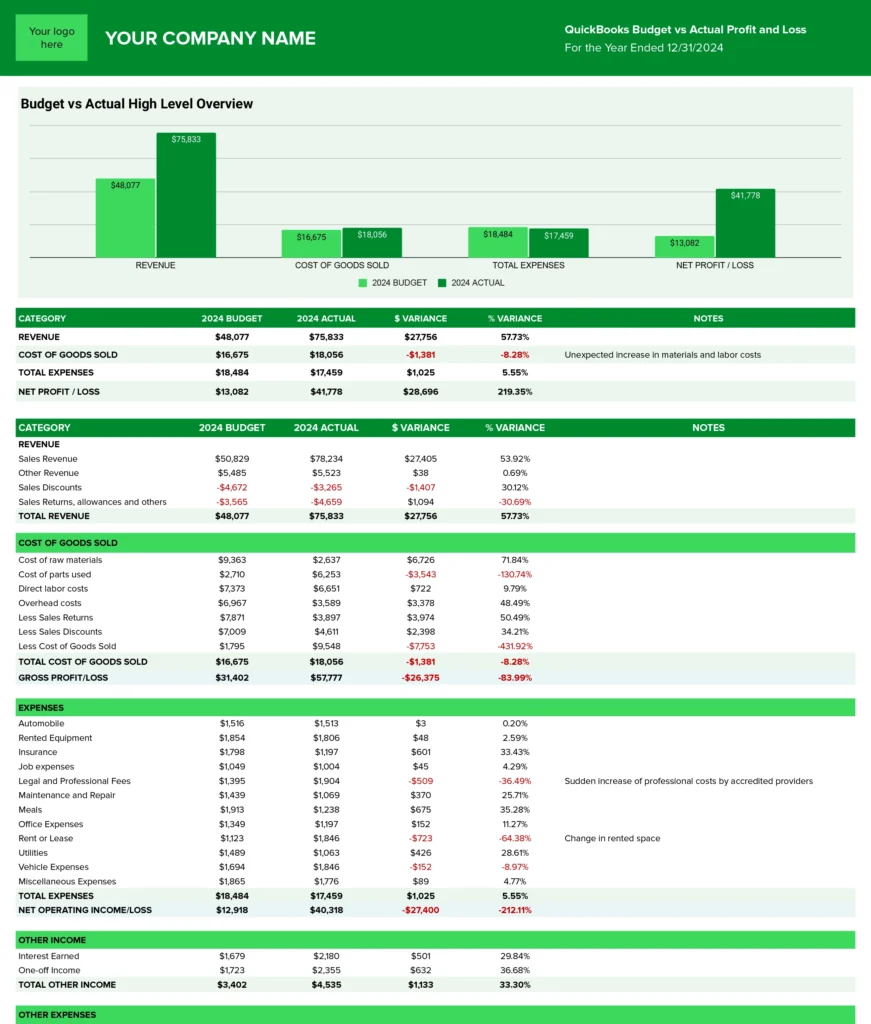
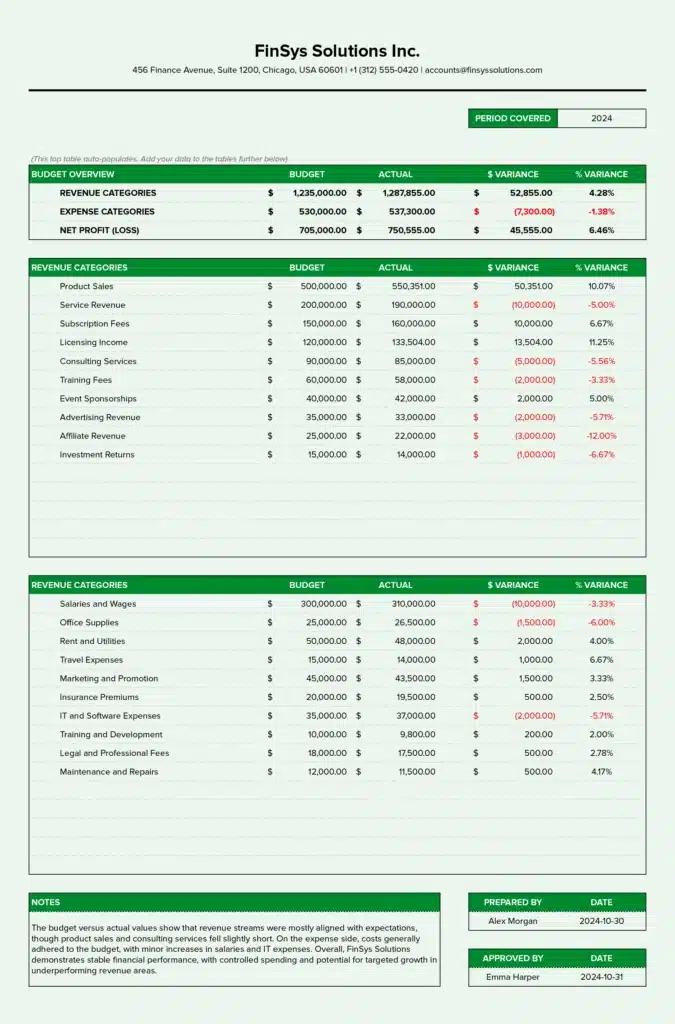
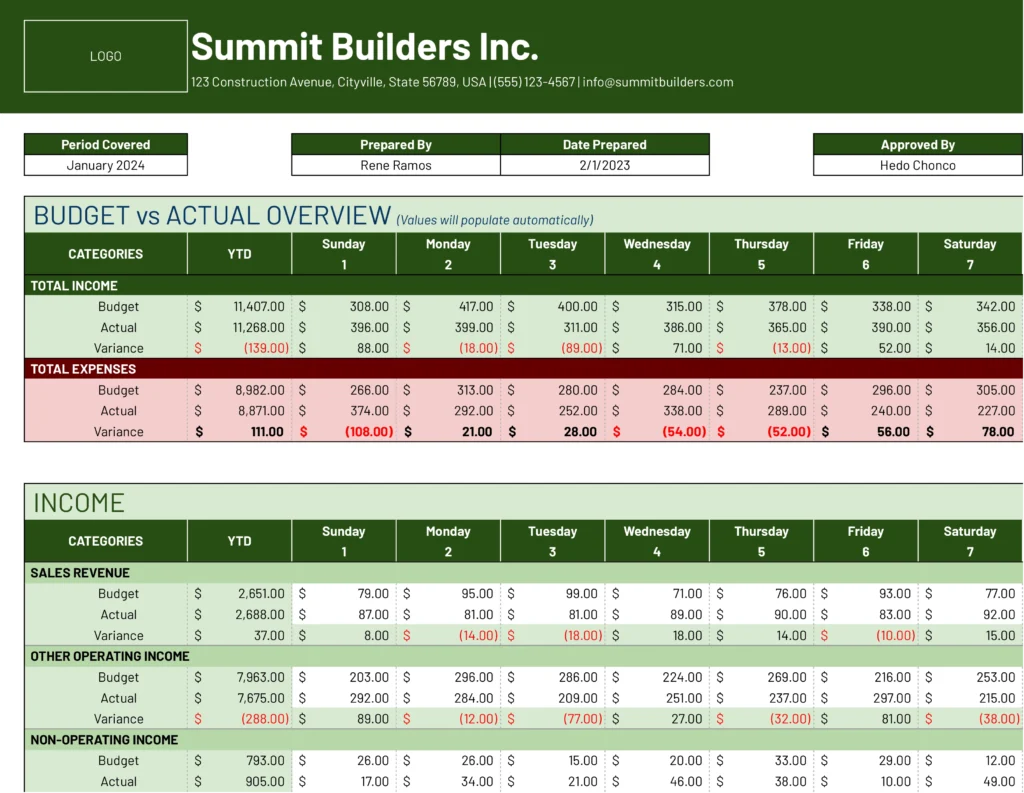
Calculating your business’s break-even point is crucial for financial planning, but creating these calculations from scratch takes time and risks errors. This free QuickBooks break-even analysis template gives you a pre-built framework to determine exactly when your business will become profitable.
What is a Break Even Analysis Report?
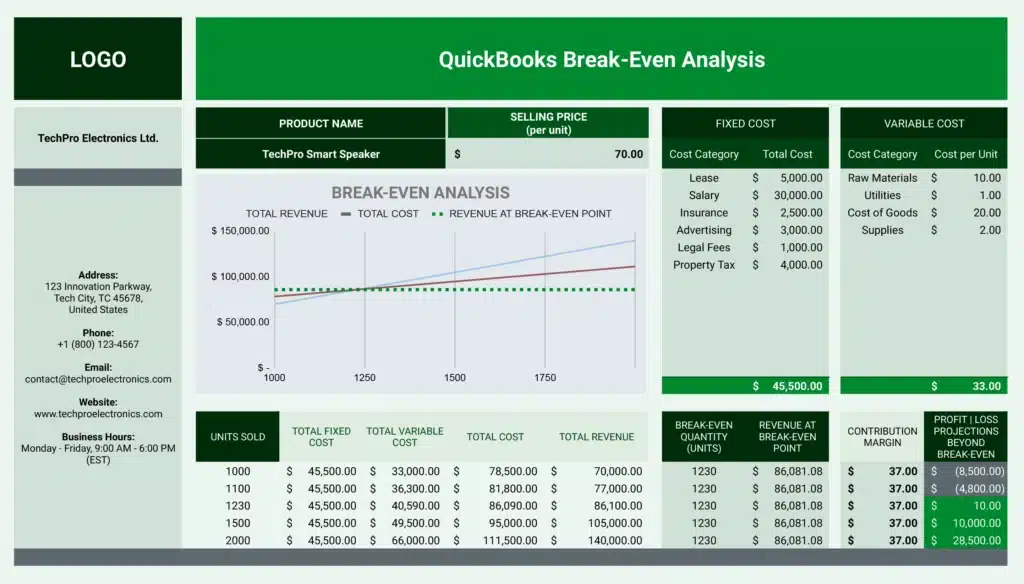
A break-even analysis report shows the exact point where your total revenue equals your total costs, indicating when your business starts making a profit. This financial analysis helps you understand how many units you need to sell or how much revenue you need to generate to cover all your expenses. The report combines your fixed costs, variable costs, and selling price to calculate the minimum sales volume required for profitability.
Who is the Break Even Analysis Template Built For?
This template serves:
- Small business owners tracking profitability targets
- Financial analysts preparing business forecasts
- Entrepreneurs planning new ventures
- Business consultants advising clients on pricing strategy
- Accountants helping clients make informed financial decisions
What is the Primary Use Case for Break Even Analysis Template?
The template helps you:
- Calculate your break-even point in both units and revenue
- Set realistic sales targets based on your cost structure
- Make informed decisions about pricing strategies
- Plan production volumes to achieve profitability
- Evaluate the financial viability of business projects
Benefits of Using QuickBooks Break Even Analysis Template
- Ready-to-Use Calculations: All formulas are pre-built and validated, eliminating manual setup time
- Professional Format: Clear visual presentation of break-even data with charts and graphs
- Comprehensive Analysis: Includes both unit-based and revenue-based break-even calculations
- Simple Data Entry: Just input your costs and prices – the template handles all calculations
Metrics Tracked in the Report
- Fixed Costs
- Variable Costs per Unit
- Selling Price per Unit
- Total Fixed Costs
- Total Variable Costs
- Total Costs
- Revenue at Break-Even Point
- Break-Even Quantity (Units)
- Contribution Margin
- Profit/Loss Projections Beyond Break-Even
- Graphical Representation (Break-Even Chart)
Additional QuickBooks Metrics to Track and Analyze
- Profit & Loss by Class
- Expenses by Vendor
- Budget vs. Actuals
- Monthly Profit & Loss
- Accounts Payable Details
- Accounts Receivable Status
- Department/Location Cost Analysis
- Vendor Payment History
