How to Fix Quickbooks Accounting Mistakes

QuickBooks Online (QBO) from Intuit is a leading accounting software used by many small business owners and medium-sized businesses. While many entrepreneurs choose between QuickBooks Online and QuickBooks Desktop, both platforms offer user-friendly solutions to handle numerous bookkeeping, credit card processing, and payment processing needs. QBO integrates with a plethora of other platforms that your business account may be using, including tools for managing accounts receivable and accounts payable.

While QuickBooks Online is user-friendly, accounting mistakes can occur due to manual error or integration issues with your company file. When these issues arise, there are several ways to tackle and fix the mistake, often with help from a CPA or ProAdvisor.

This guide will walk through how to fix common QuickBooks mistakes in QuickBooks Online, helping you maintain accurate records for your tax liability and sales tax reporting.

Let’s get started!

Common Quickbooks Accounting Mistakes

There are a lot of varying ways that accounting mistakes can occur in QuickBooks Online. Depending on the type of mistake, the fix or solution may be easier for one mistake compared to another. Some of the most common errors are:

  • Data Entry Error – The most common accounting mistake is a manual journal entry or data entry that was entered incorrectly. This could either be to the incorrect account(s) or for the incorrect amount. Typically, this type of error is easily identified when performing your bank reconciliation.
  • Duplication Error – This could be a duplication error caused by two employees in your accounting department making the same entry without realizing someone else is duplicating it. It could also be due to an integration error with your bank account that pulled in duplicate bank transactions for something that was either deposited or withdrawn from your bank account.
  • Omission Error – An omission error is when either a transaction doesn’t get booked by someone in the accounting department, that should have been posted or if there is an error when pulling in bank feeds that a particular transaction is omitted from that pull. Typically, this is mainly an issue in accrual basis accounting, where there should be a journal entry posted for an asset or liability, that the cash flow hasn’t occurred yet. This can be a big issue when the company needs to report out financial statements to external investors or debtors. If the omission is big enough it can cause material discrepancies in the financial reports you are presenting.
  • Principle Errors – A principle error is when a particular journal entry or entries are not in compliance with the governing accounting principles that your business is required to follow. This often isn’t done intentionally but may be due to a new accounting standard that came out, or someone classifying a transaction to the account that they thought it needed to go to but was incorrect. To help combat this error, it is important to keep your accounting team up-to-date on rules and regulations that apply to your business as it relates to accounting and financial reporting.

How to Fix Accounting Mistakes in Quickbooks Online

Option 1: Fix the Mistake Manually

Depending on how recent and the magnitude/volume of the accounting mistakes you can fix the mistake manually. To find what is causing the mistake, you will want to ensure you are reconciling your accounts in QuickBooks Online to easily identify the mistake in your account.

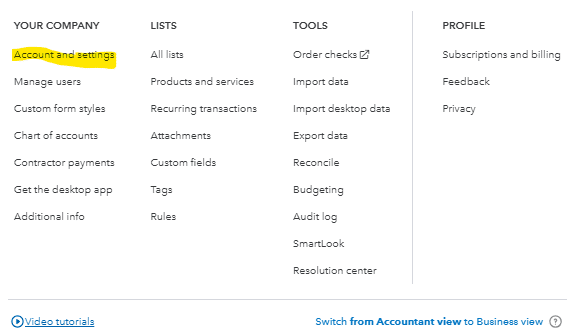
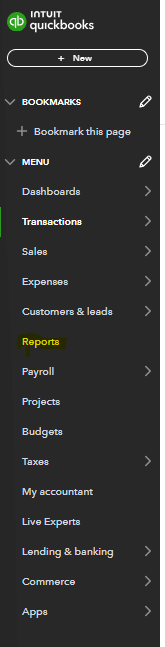
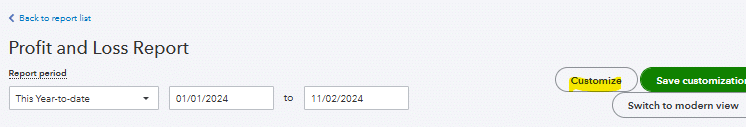
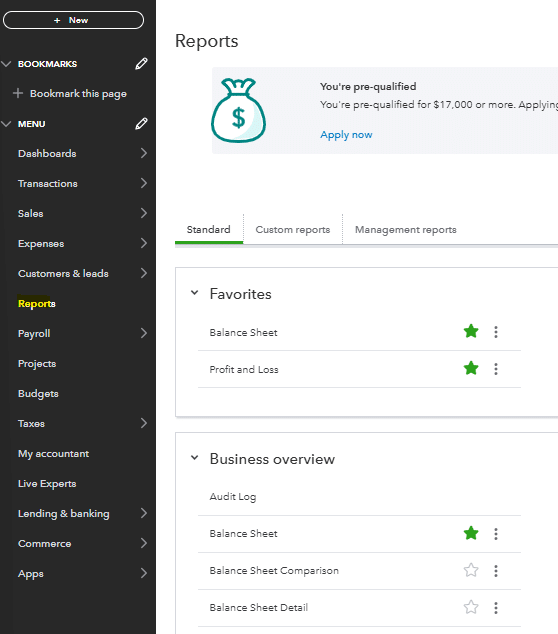
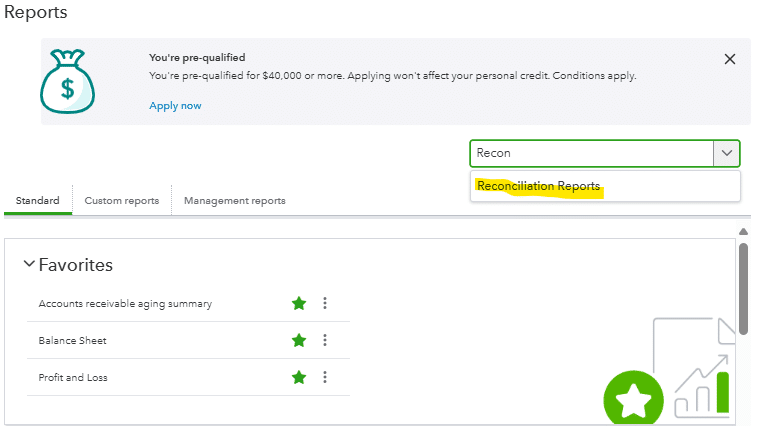
To reconcile your accounts you first need to navigate to the reports section of the main menu.

QuickBooks Online navigation menu highlighting the report section

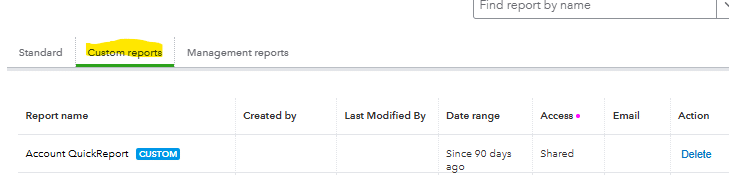
Once you’ve selected the reports section, you will need to search for the reconciliation reports in the search bar at the top right of the screen.

Reconciliation Report search bar in QuickBooks Online

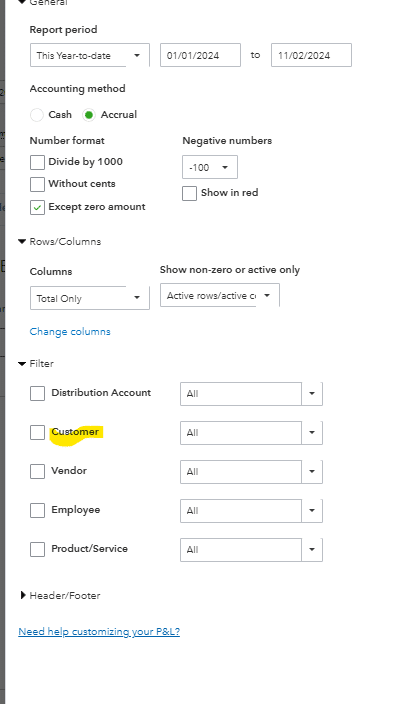
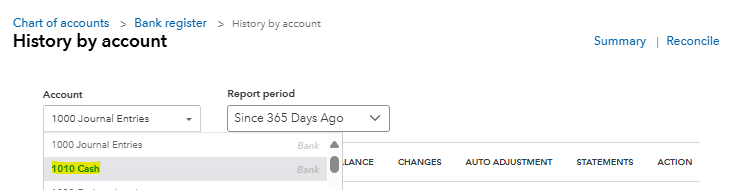
Once you’ve selected the reconciliation reports, you can select the account that you would like to reconcile. In this particular example, we are selecting the cash flow account that we would like to run the reconciliation report for.

The Council Elections dropped down for reconciliation.

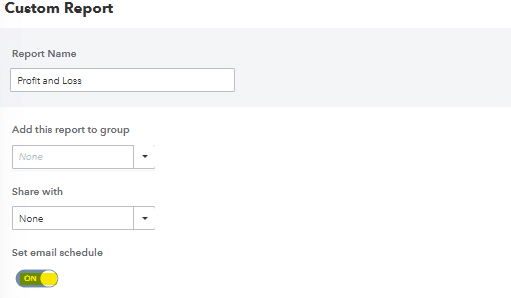
Now that you have selected the account that you would like to reconcile, you can then select the date range that you would like to run the reconciliation for.

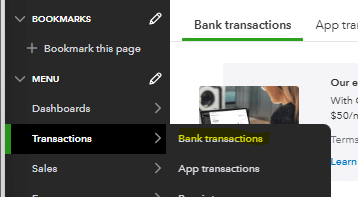
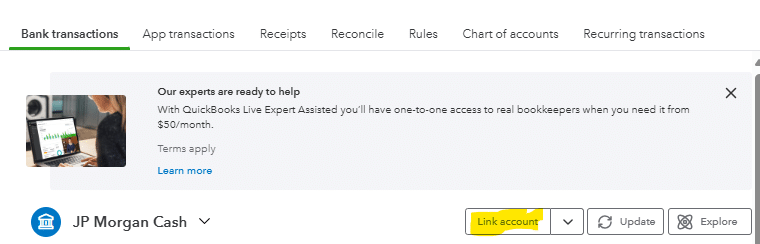
Depending on the frequency your business / accounting team reconciles accounts this may be weekly, monthly, quarterly, etc. One way to limit accounting mistakes, in particular in the cash account, is to link your business account directly in QuickBooks and classify transactions as they come in.

Once you’ve selected the date range and account you are ready to run the bank reconciliation by selecting the start reconciling button.

Start reconciling button with the date range selector

As you go through the reconciliation you will be able to identify what bank transactions are incorrect or not matching with your bank statement to know what and how to fix the accounting transactions that are incorrect.

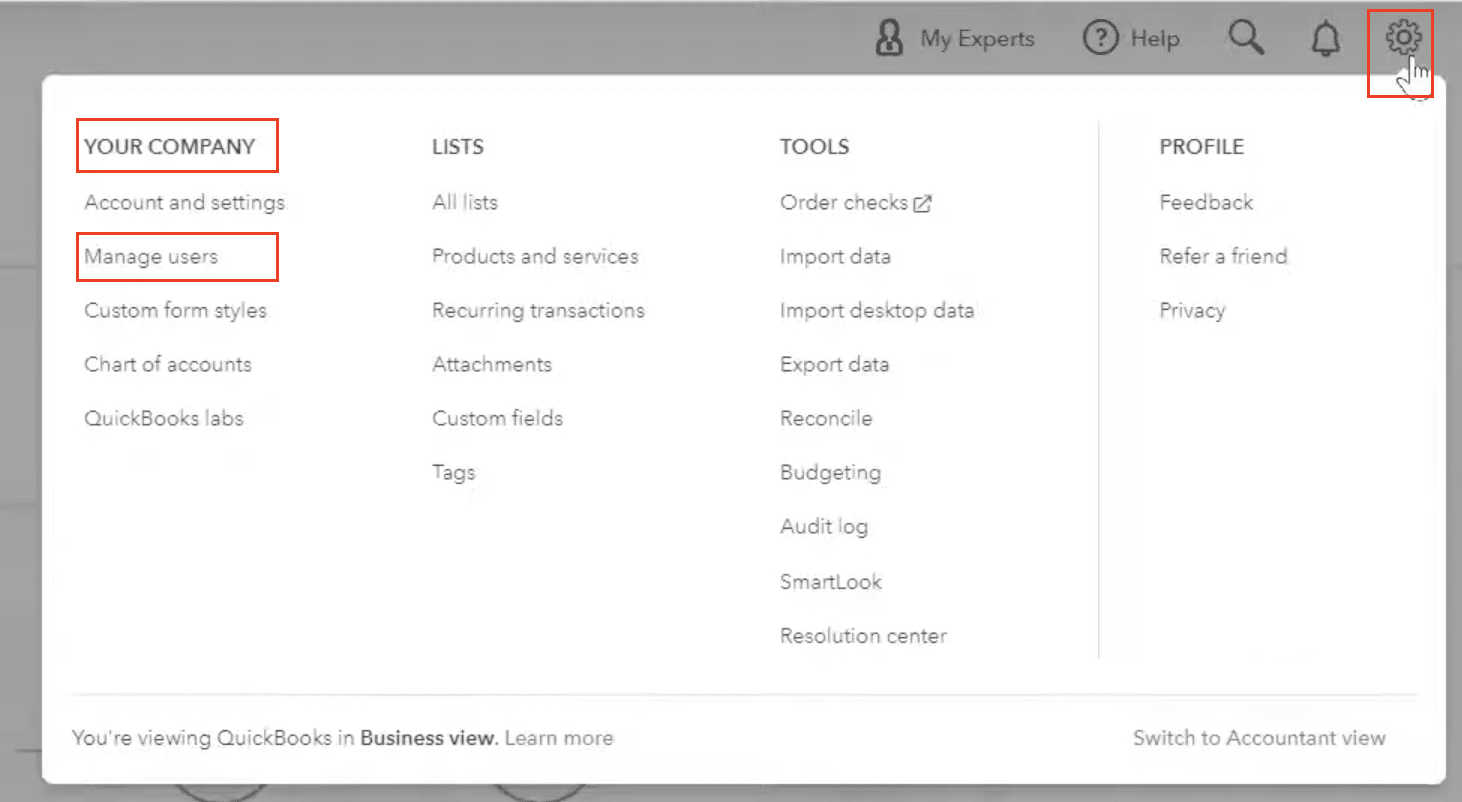
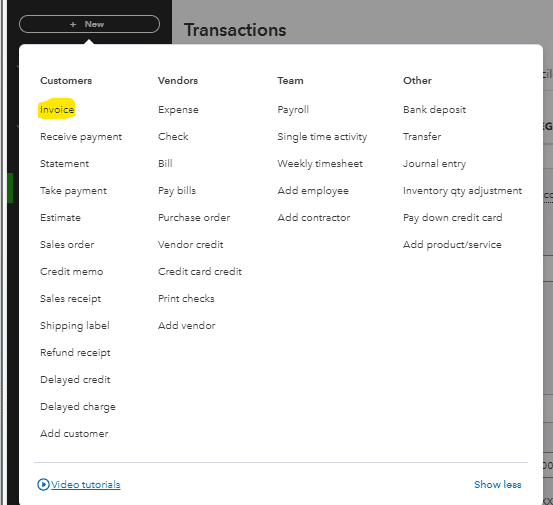
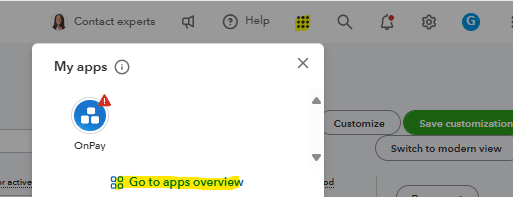
Once you’ve identified the mistake, one option is to book a manual entry to fix the mistake. To do this you first need to navigate to the main menu and select the + New button at the top of the menu.

QuickBooks main menu showing you button location

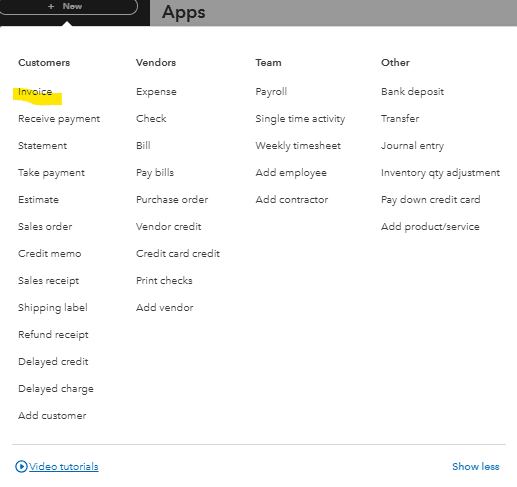
Once you select the + New button you will select the journal entry option in the other column.

Journal entry option in the other column menu.

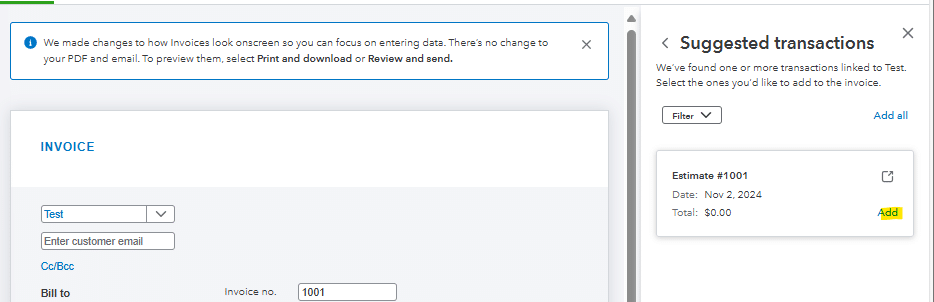
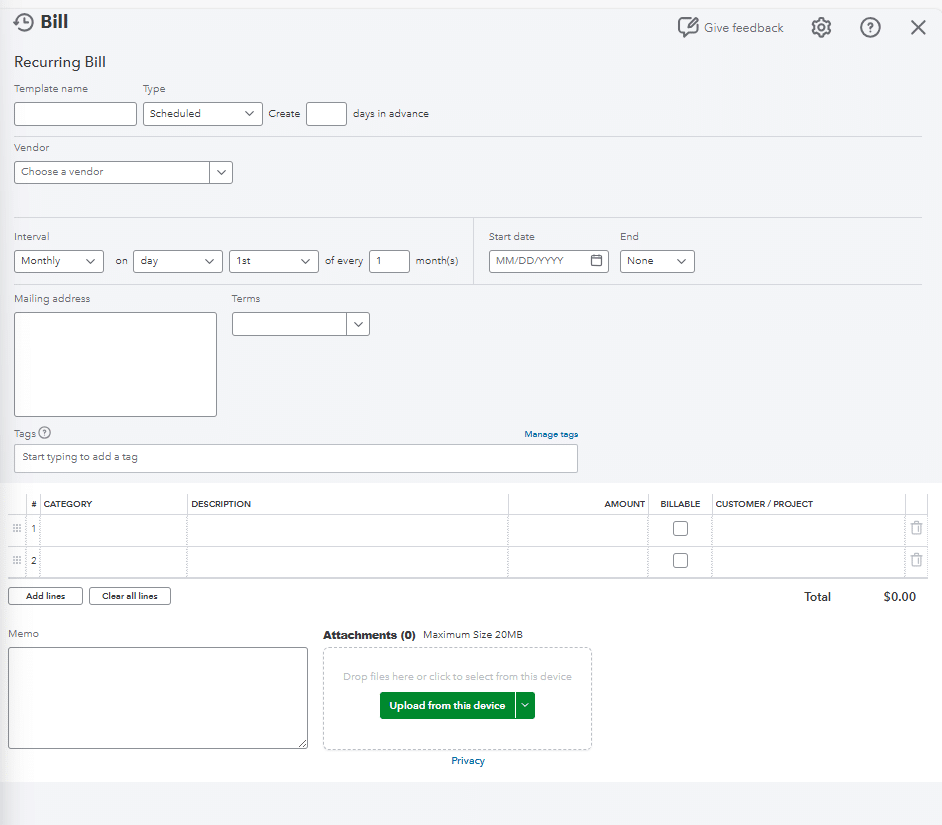
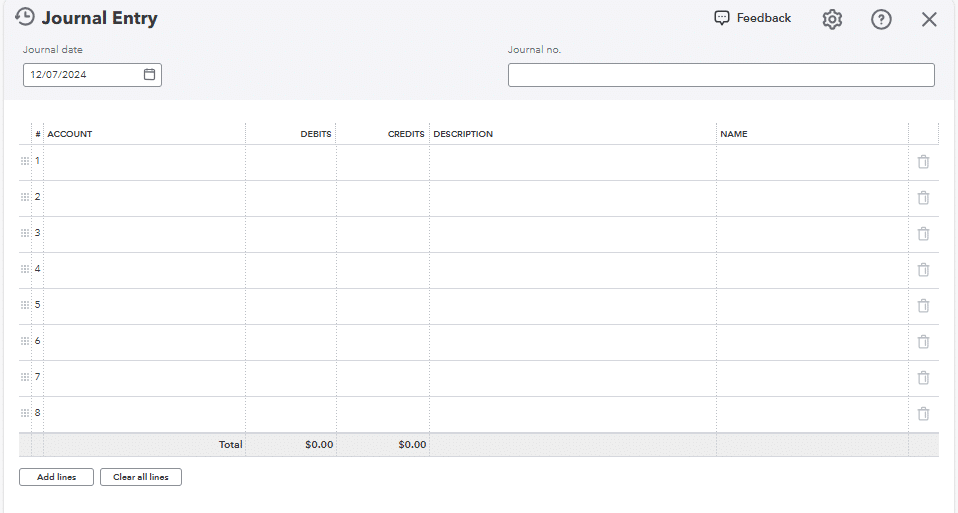
This will take you to a journal entry landing page where you will be able to post a manual journal entry to fix whatever accounting mistakes may have occurred. There are several fields within the journal entry that you need to have information ready for when you go to post the entry.

  • What chart of accounts do you need to post to in order to fix the mistake?
  • What date does the entry need to be posted to? This may vary depending on what timeframe the accounting mistake was made in and if the accounting period the mistake was made in is still open.
  • What amount do you need to debit and credit for each account to fix the accounting mistake? This should be evident as you go through your reconciliations.
  • What description do you need to add to the entry? Typically, you will want to add a description that outlines what the entry is for so you and others in the accounting department will know what the entry is for if a question comes up in the future.
Journal Entry Forum: A field for account details

Once you’ve posted your manual journal entry to fix the accounting mistake, you should be able to review your reconciliations and financial statements to ensure that the journal entry resolved the accounting mistake, and the balances in the affected accounts are what you were expecting.

Option 2: Reverse the Journal Entry

If you just posted a journal entry or classified a transaction that is causing the accounting mistake you are able to reverse that journal entry and fix your accounting mistakes in QuickBooks Online.

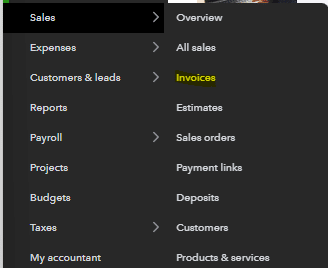
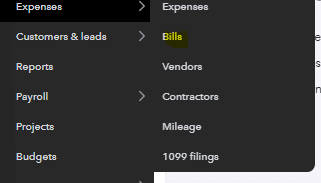
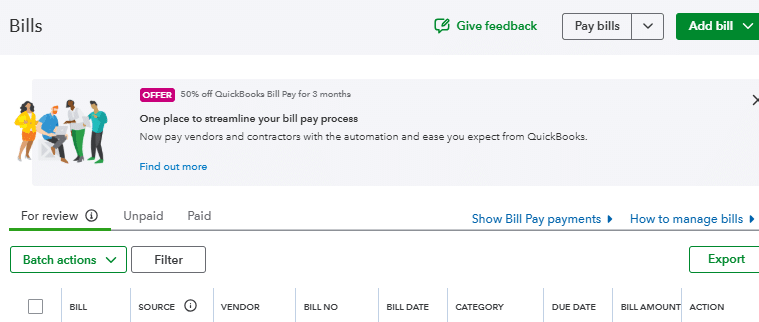
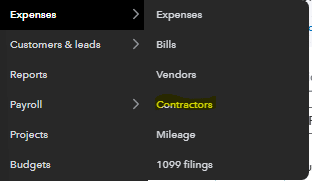
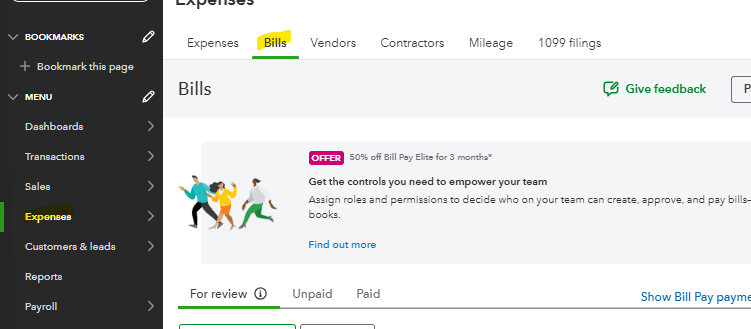
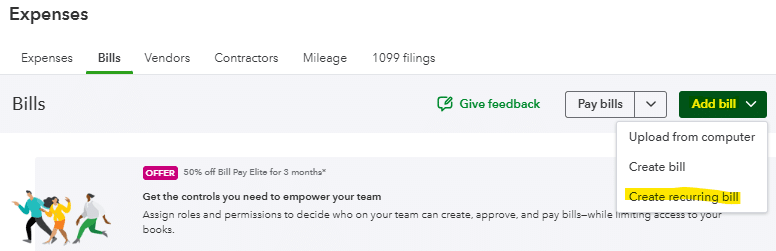
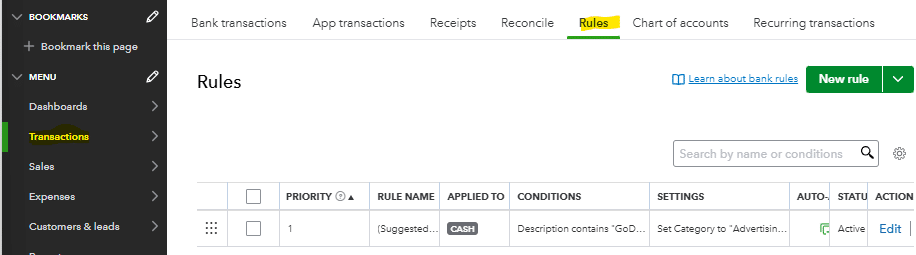
In order to reverse out the journal entry you will first want to navigate to that particular transaction. Depending on what type of transaction is causing the issue it may be in a different section of QuickBooks Online. In this particular example we are going to navigate to the expense section of the main menu and find the journal entry that is causing the issue.

Once the journal entry has been found and selected you will pull a journal entry screen that shows the debit and credit that make up that particular entry. At this point you should review the journal entry and ensure that it is causing the accounting mistake within QuickBooks Online and deleting/reversing out that transaction will fix the mistake.

At the bottom of your selected journal entry there is a delete option for that particular journal entry. This will remove this journal entry from your general ledger and corresponding accounts that role into your balance sheet or income statement.

Fleet option at the bottom of the journal entry screen.

This is one of the easier solutions for fixing an accounting mistake in QuickBooks Online. Depending on the breadth of the mistakes in QuickBooks and how many months, journal entries, accounts, etc. the mistake involves this may not be an option.

Option 3: Automate error detection with Coefficient

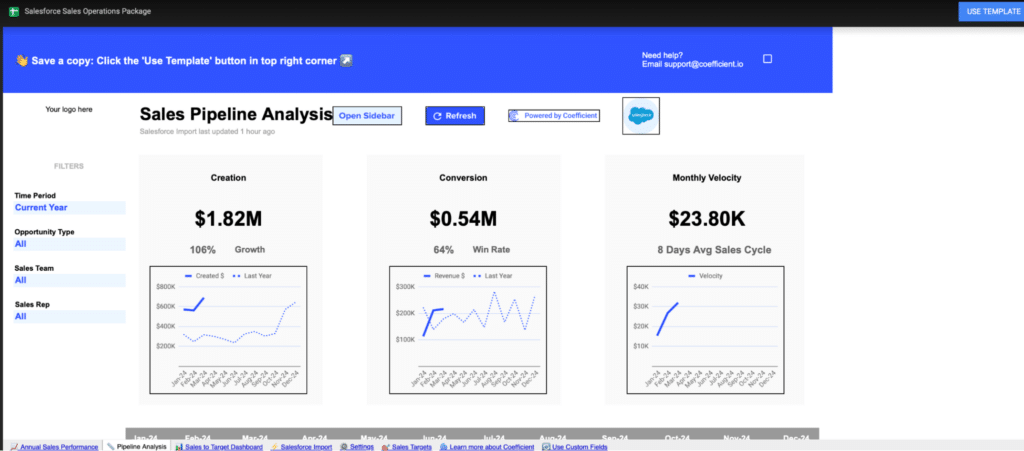
Manual fixes work when you catch errors quickly. But what if you could prevent mistakes before they happen? Coefficient connects QuickBooks directly to Google Sheets or Excel, giving you real-time visibility into your accounting data and automated error detection.

Instead of waiting to discover mistakes during monthly reconciliations, Coefficient lets you:

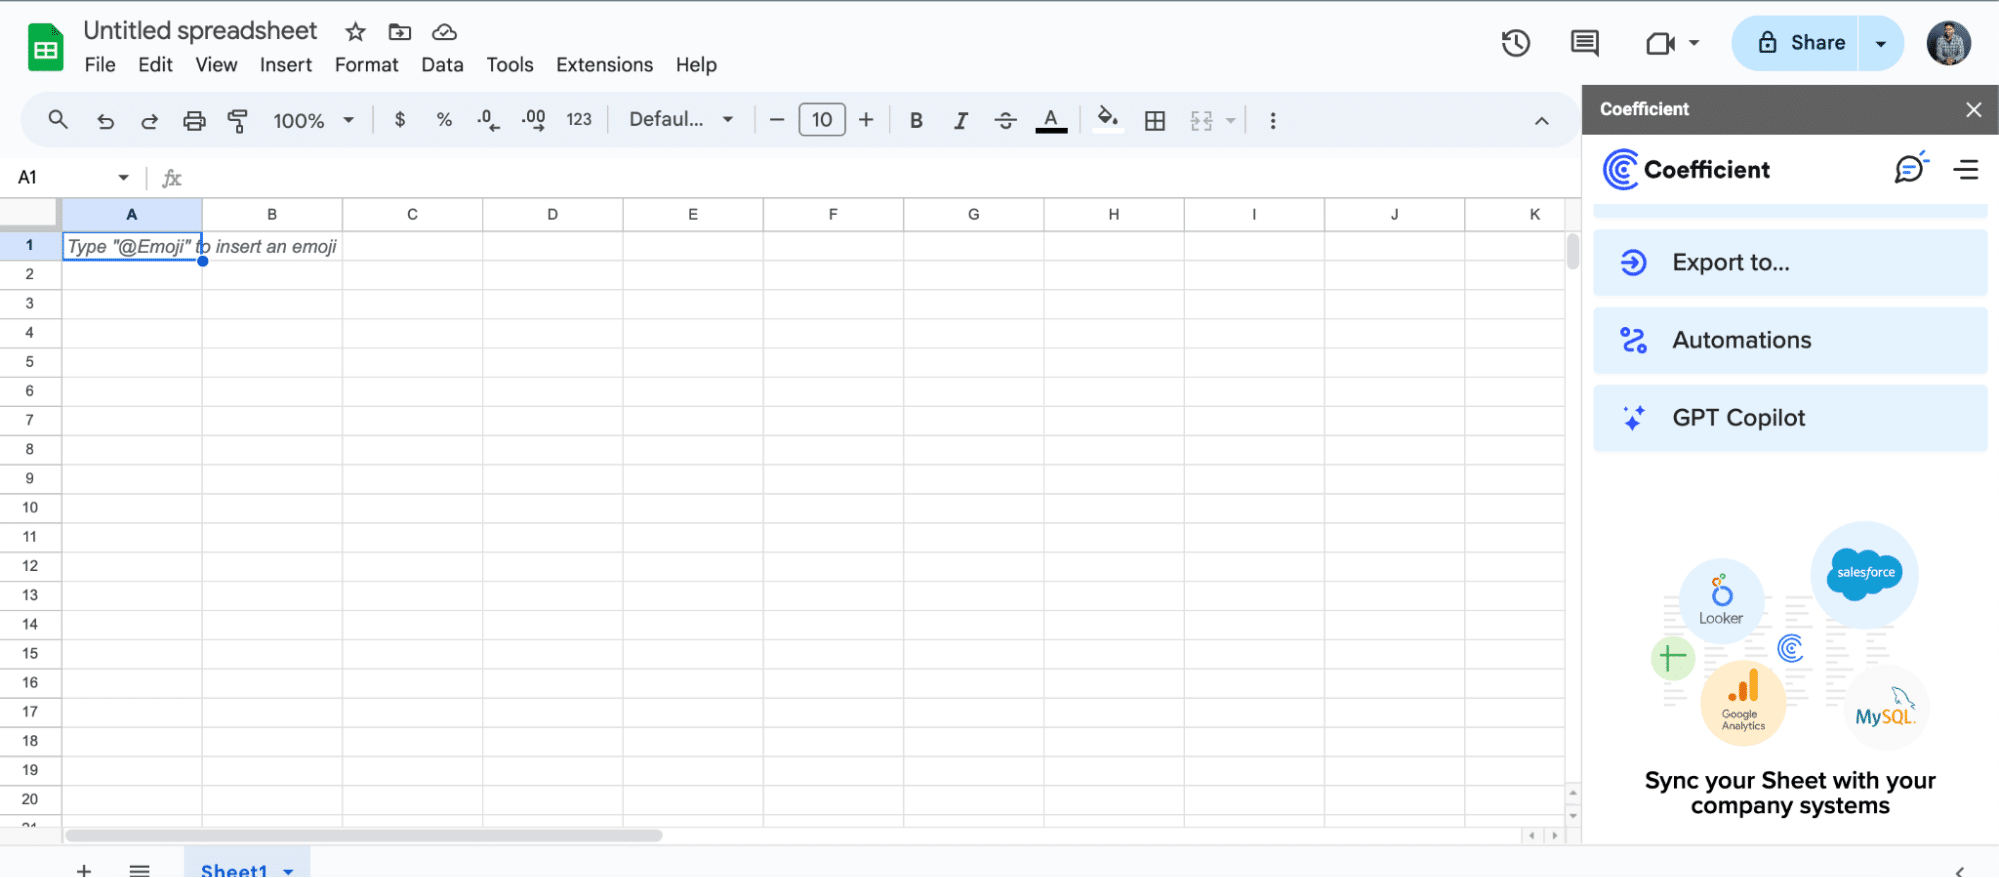
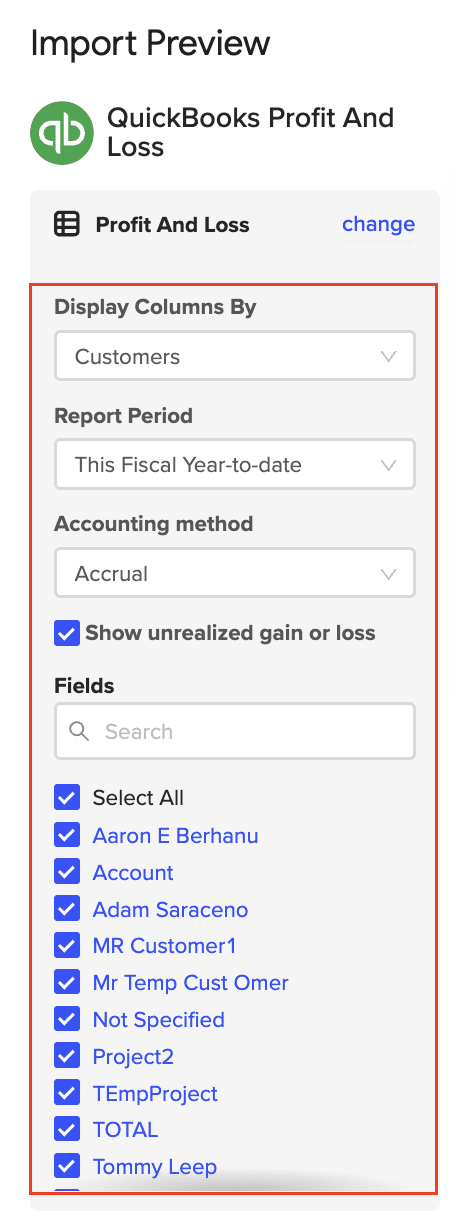
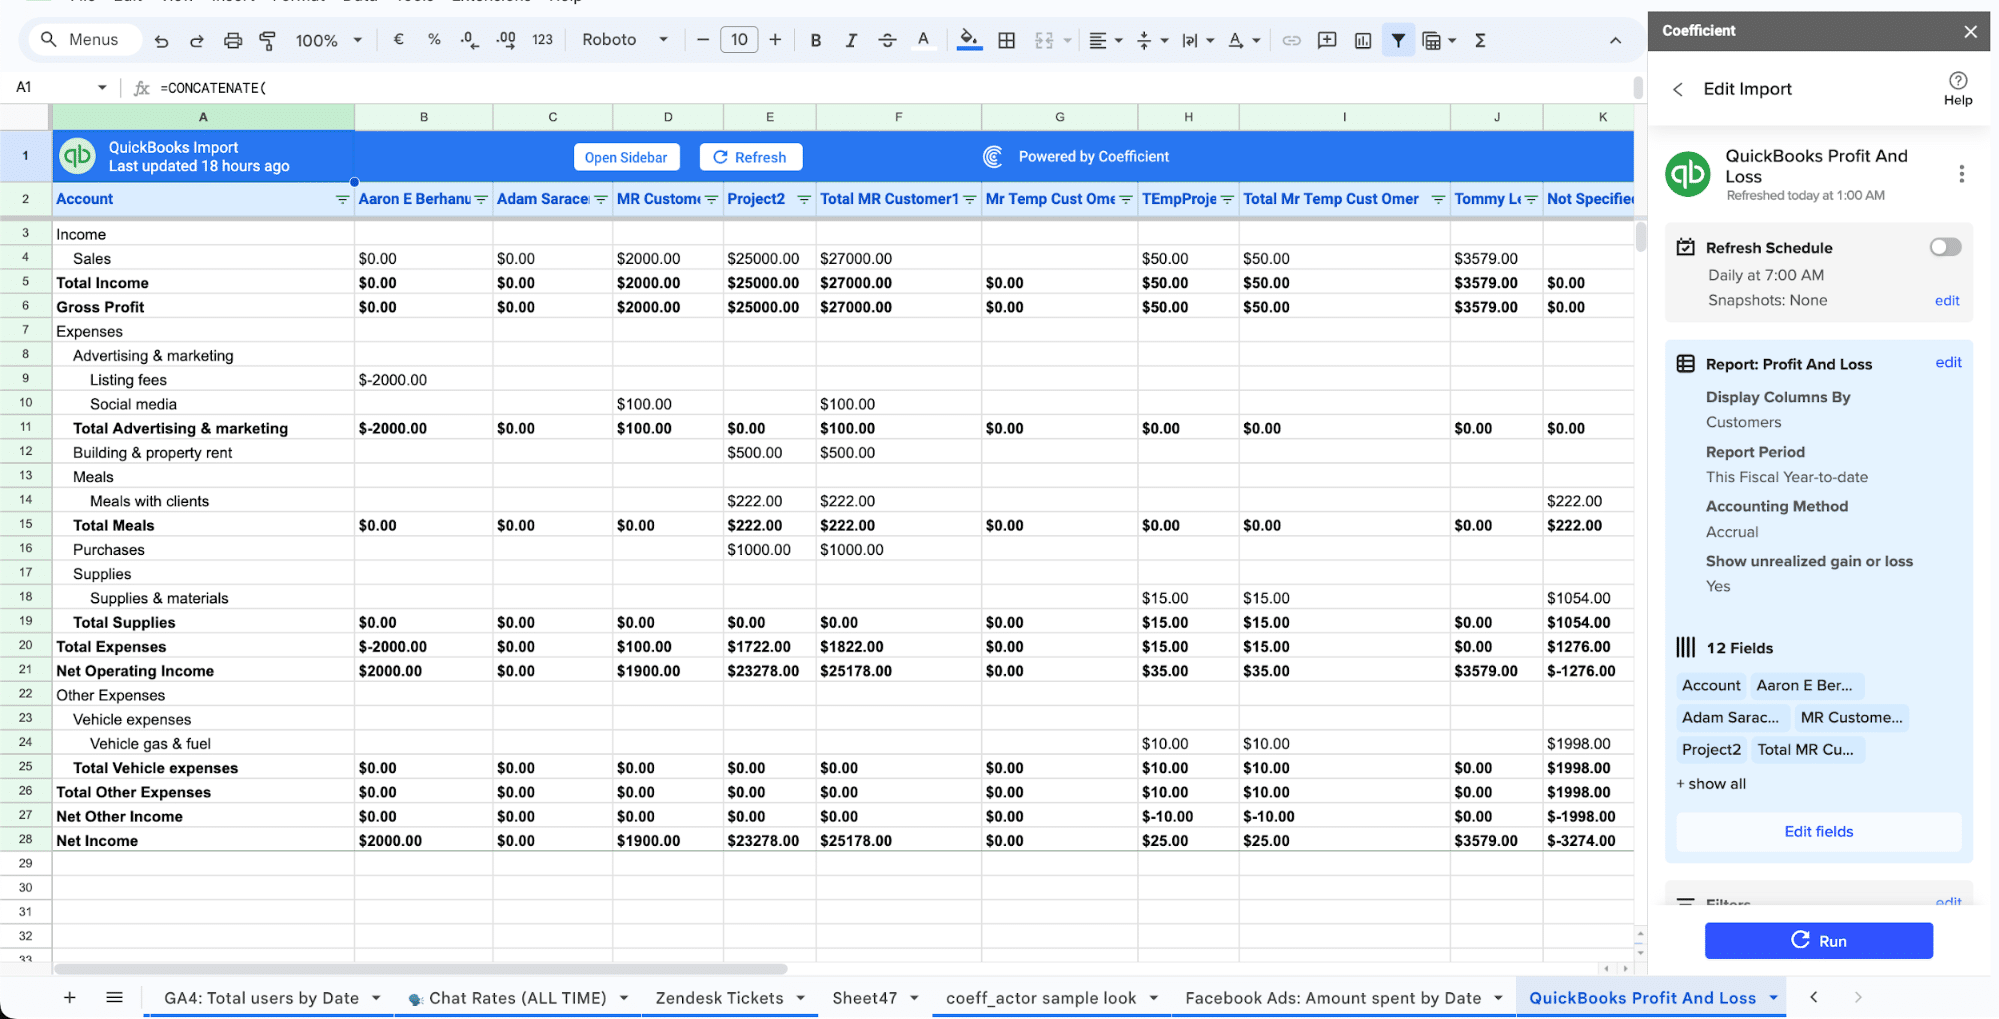
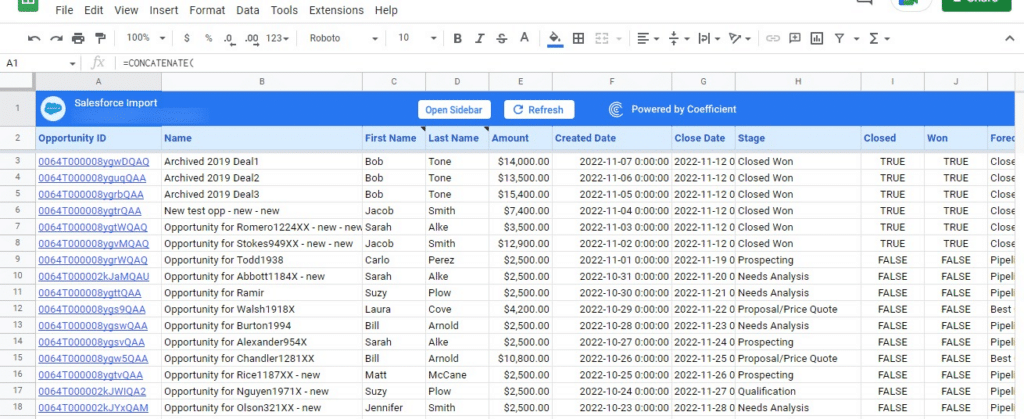
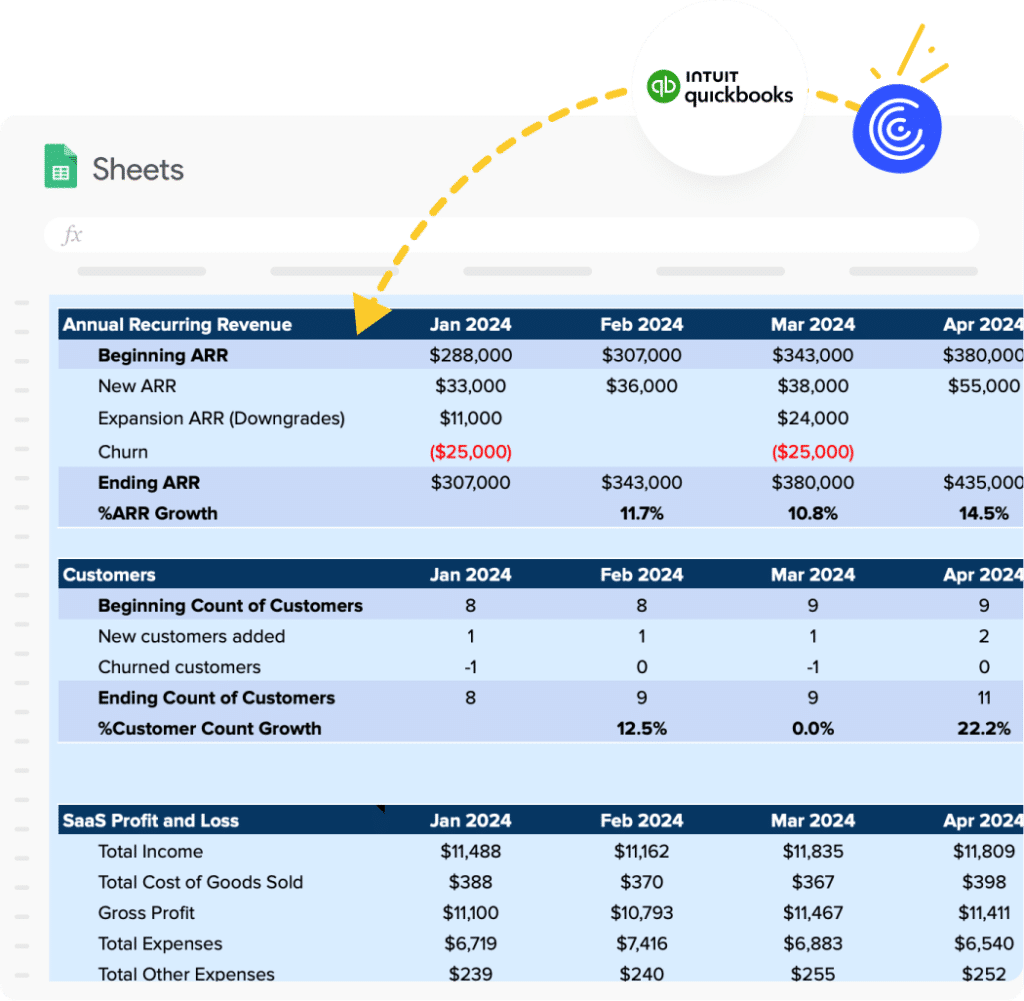
  • Pull live QuickBooks data into spreadsheets automatically
  • Set up automated refresh schedules so your data stays current
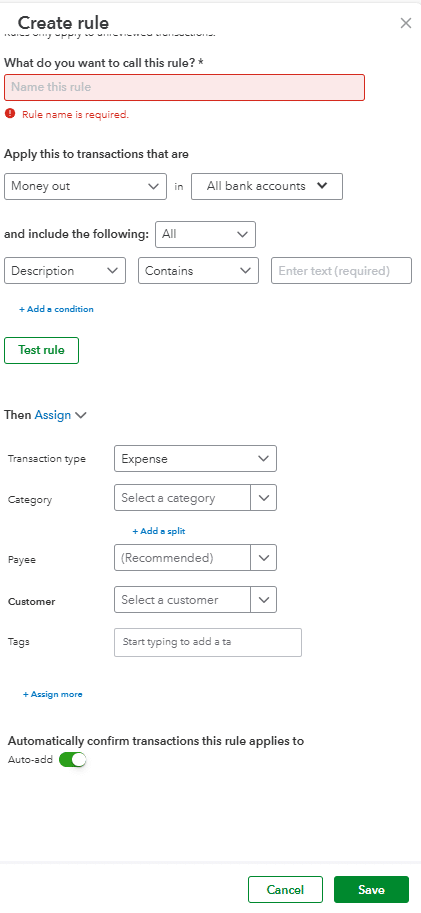
  • Create custom validation rules to flag discrepancies instantly
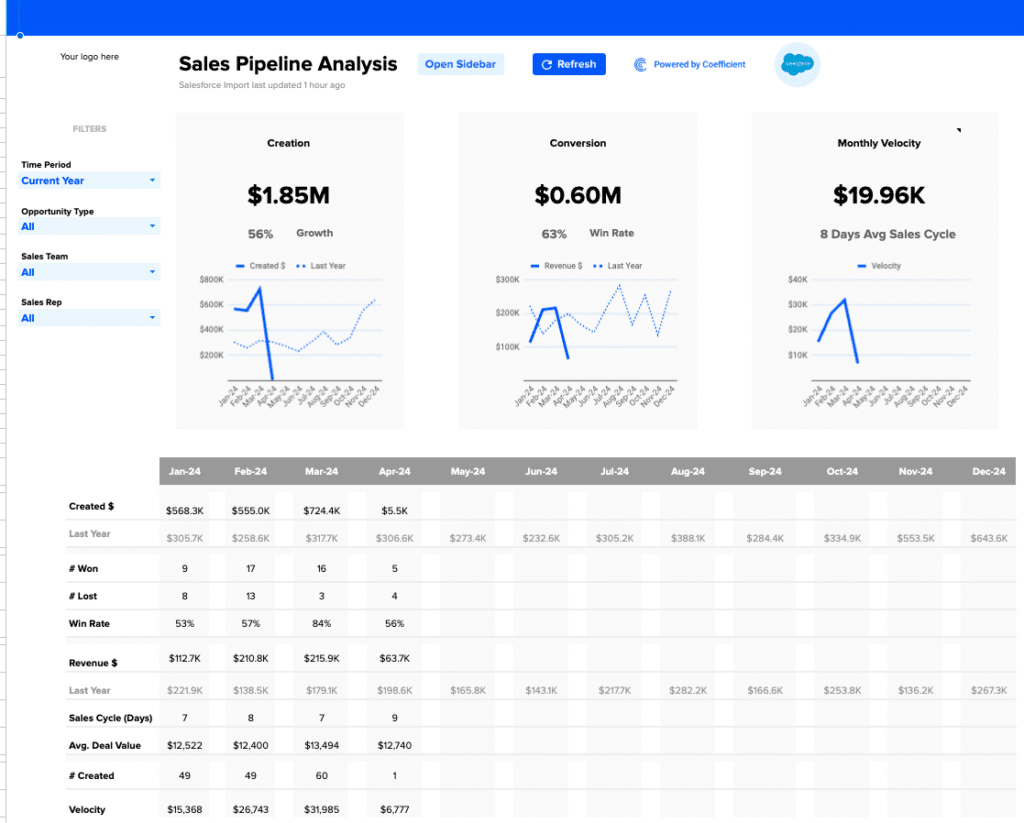
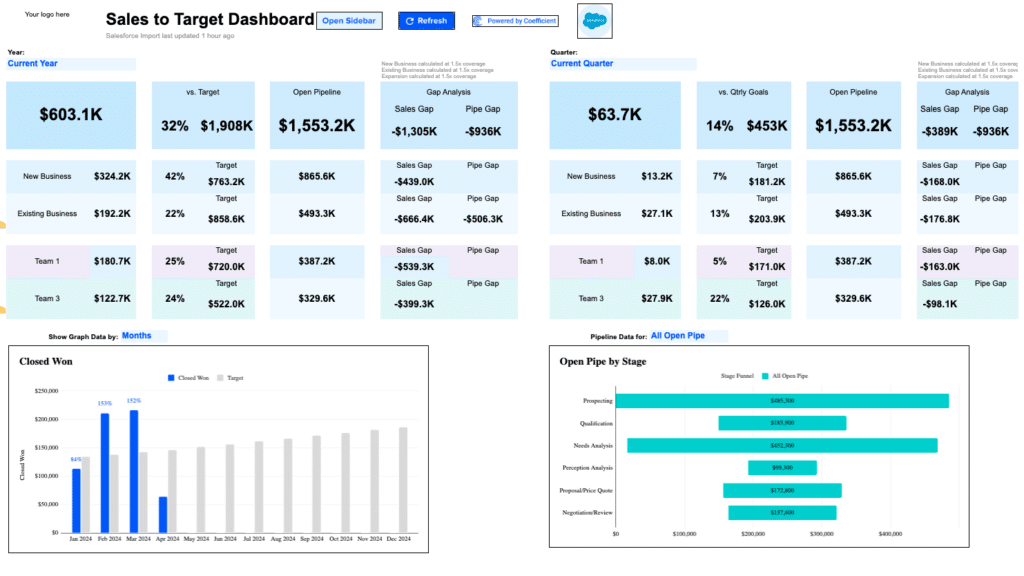
  • Build real-time dashboards that surface errors as they occur

Watch how to connect QuickBooks to your spreadsheet in under 3 minutes:

How Coefficient prevents common accounting mistakes

Eliminating data entry errors: When you import data directly from QuickBooks using Coefficient, you eliminate manual copy-paste operations. Your journal entries, account balances, and transaction data flow automatically into your spreadsheets with zero manual intervention.

Catching duplications early: Set up automated imports that refresh hourly or daily. Review new transactions as they come in rather than discovering duplicate entries weeks later during reconciliation.

Preventing omissions: Create comprehensive reports that pull all transactions within specific date ranges. Cross-reference against bank feeds to ensure nothing falls through the cracks.

Setting up automated QuickBooks imports

Getting started with Coefficient takes less than 5 minutes:

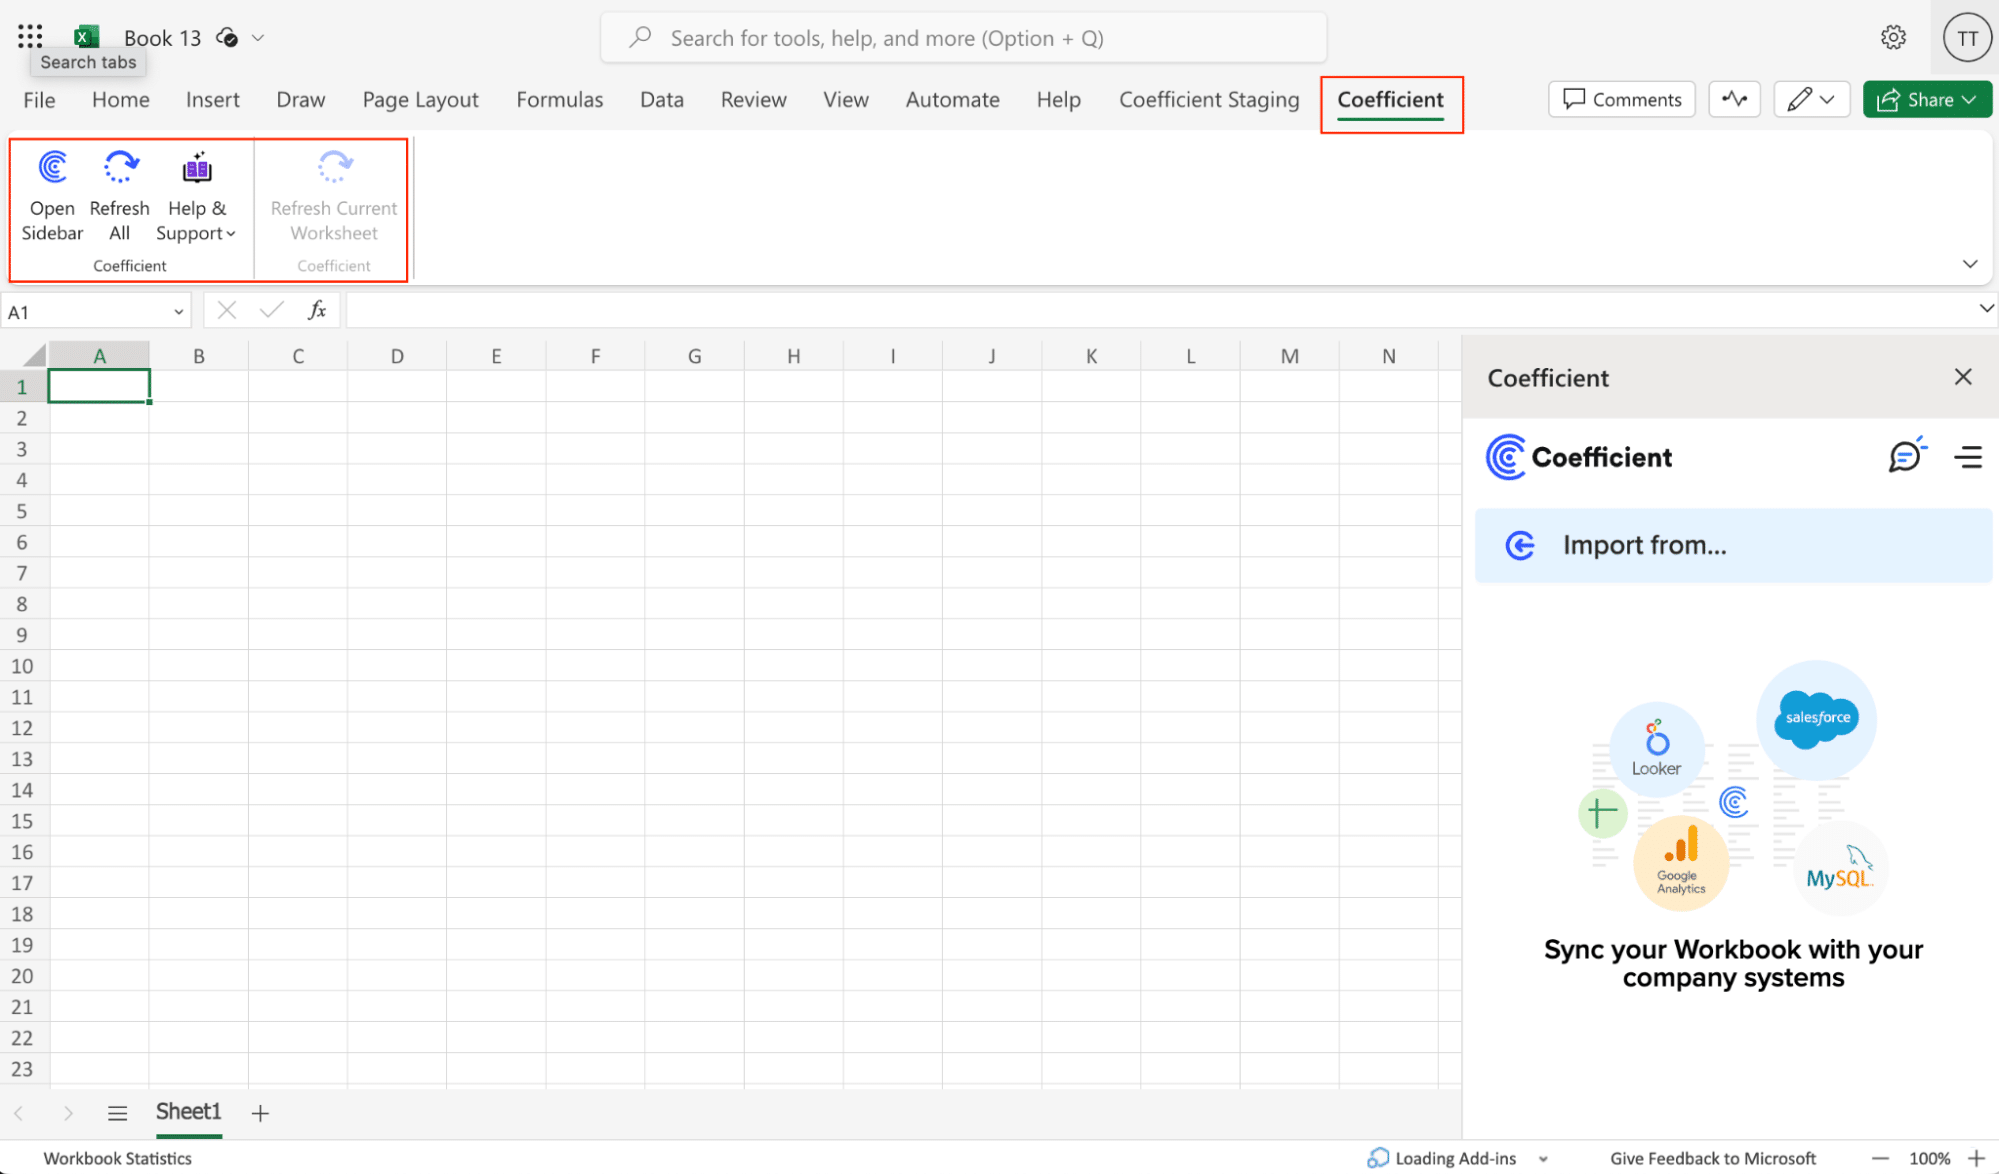
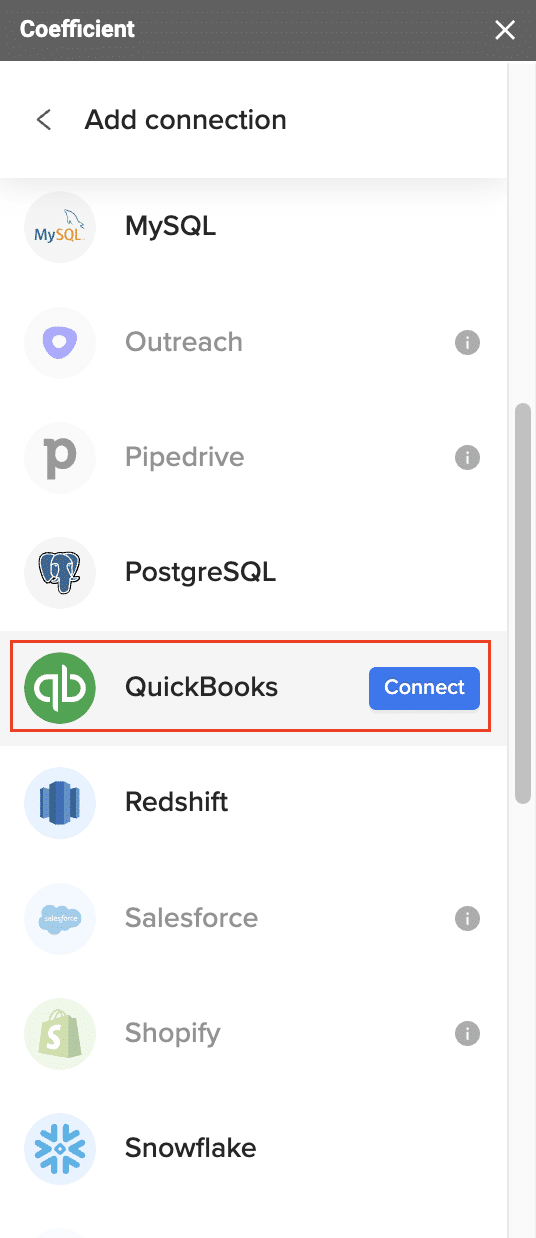
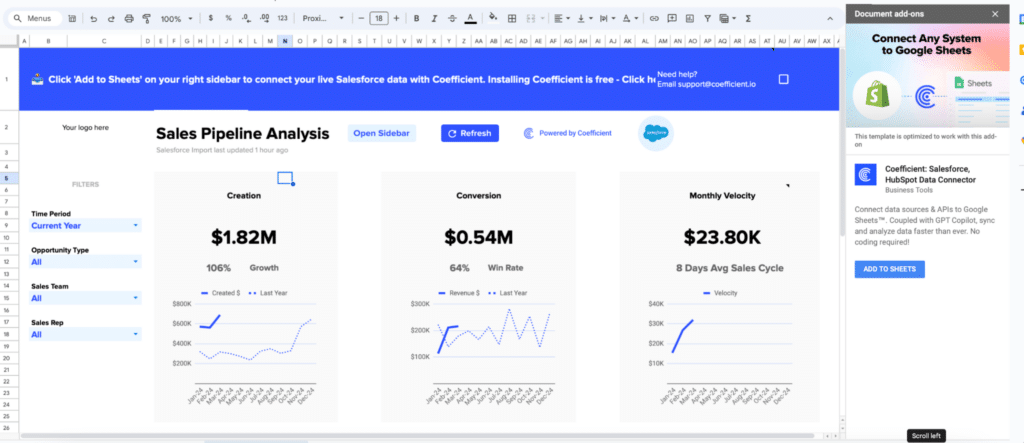
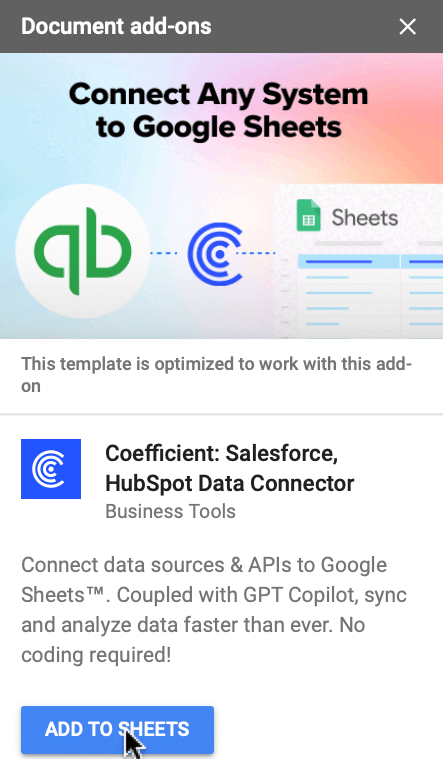
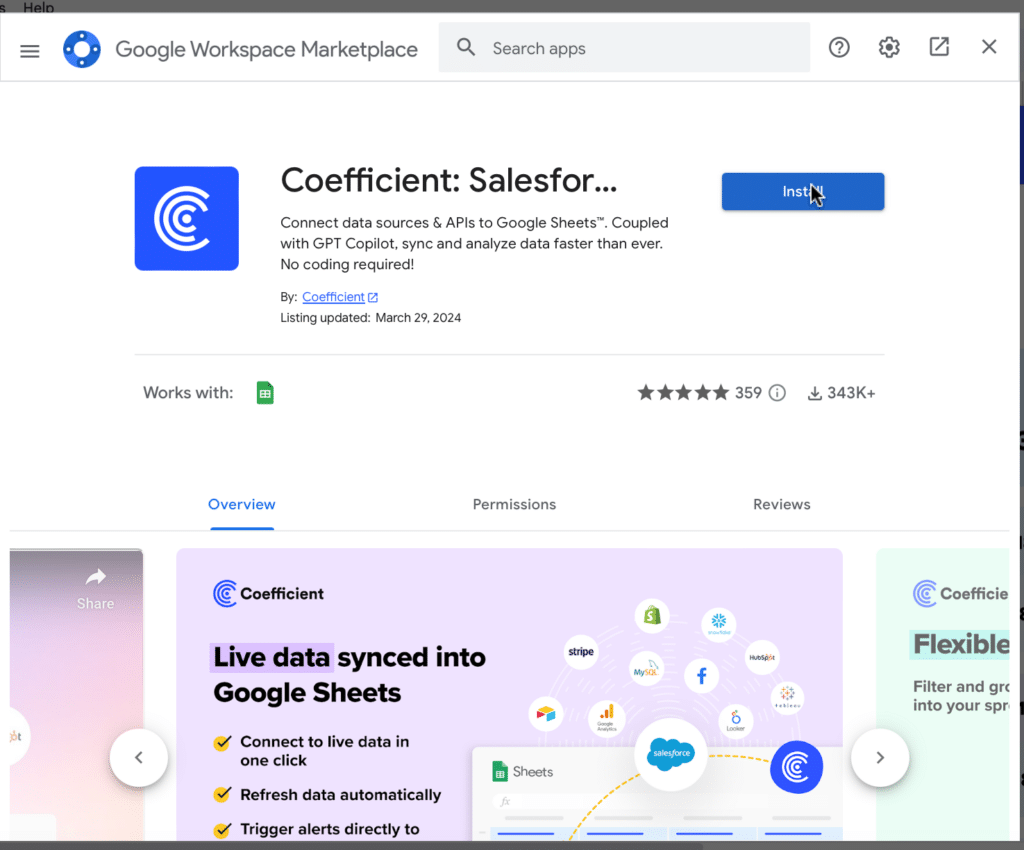
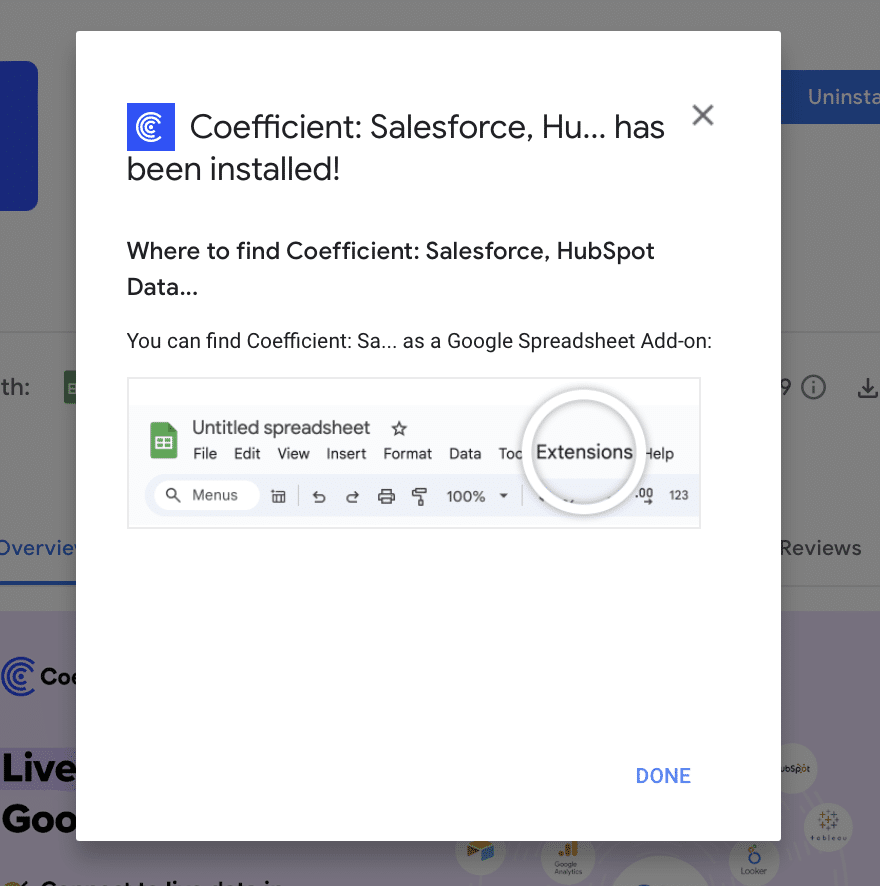
  1. Install Coefficient from the Google Workspace Marketplace or Microsoft AppSource
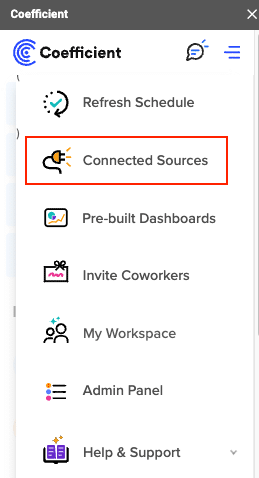
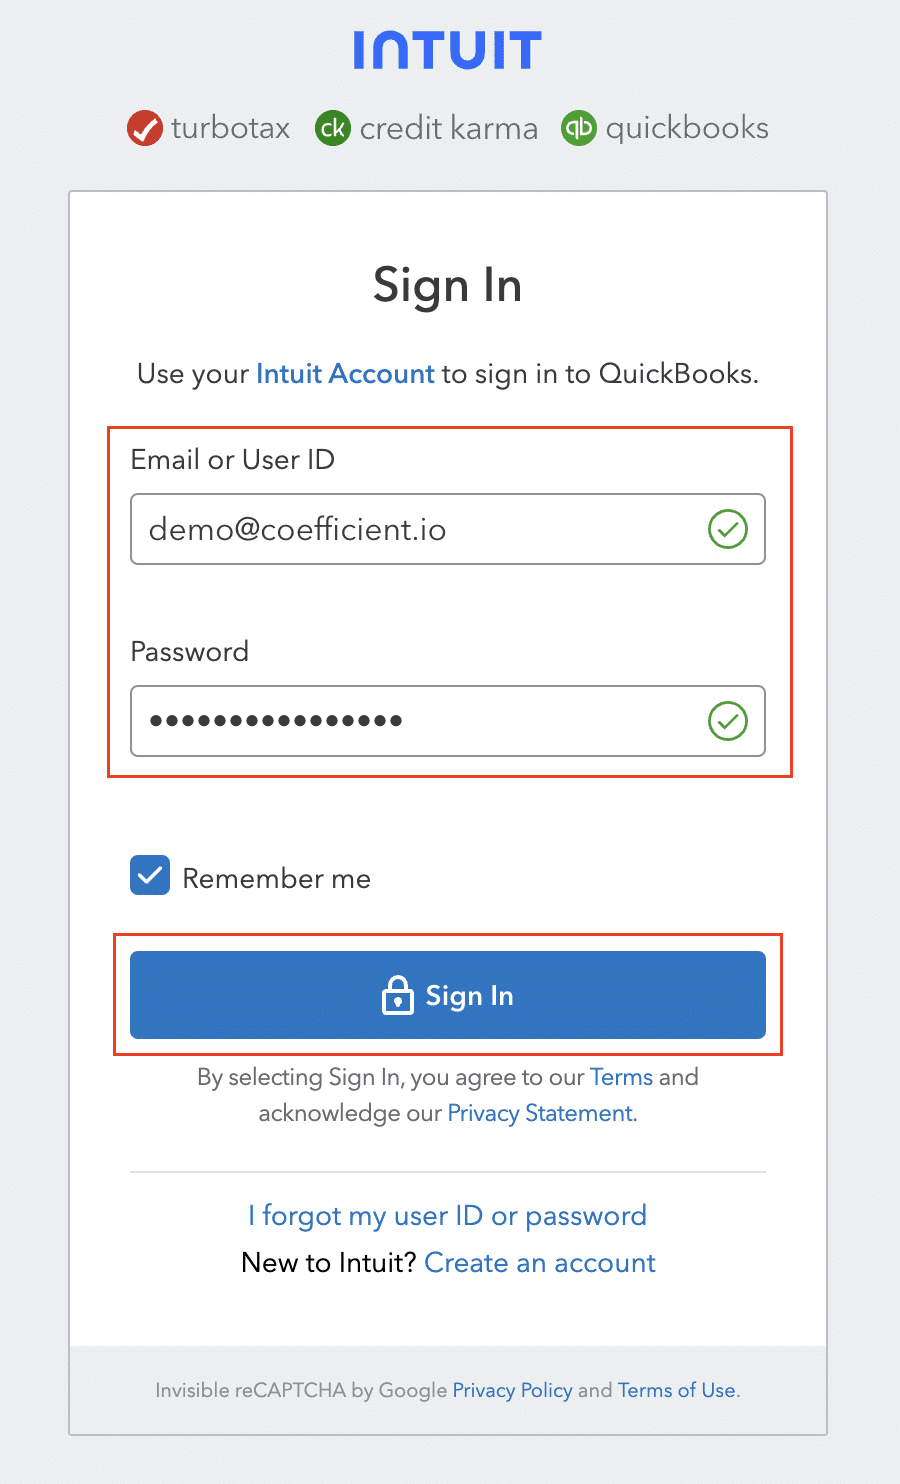
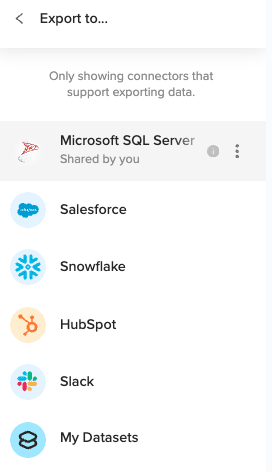
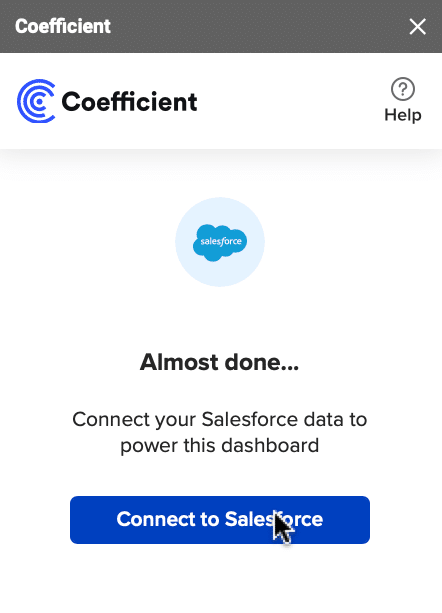
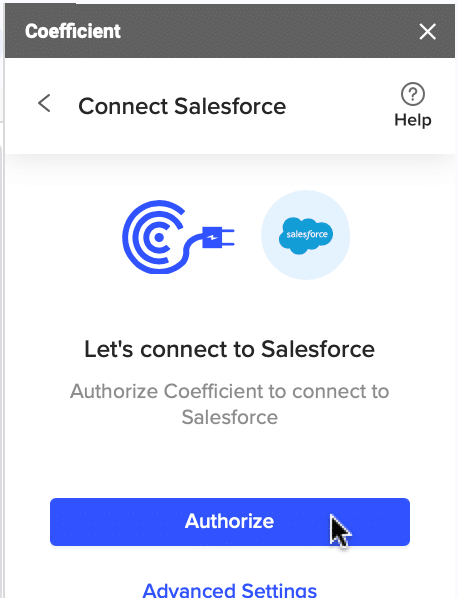
  2. Connect your QuickBooks account through the secure OAuth connection
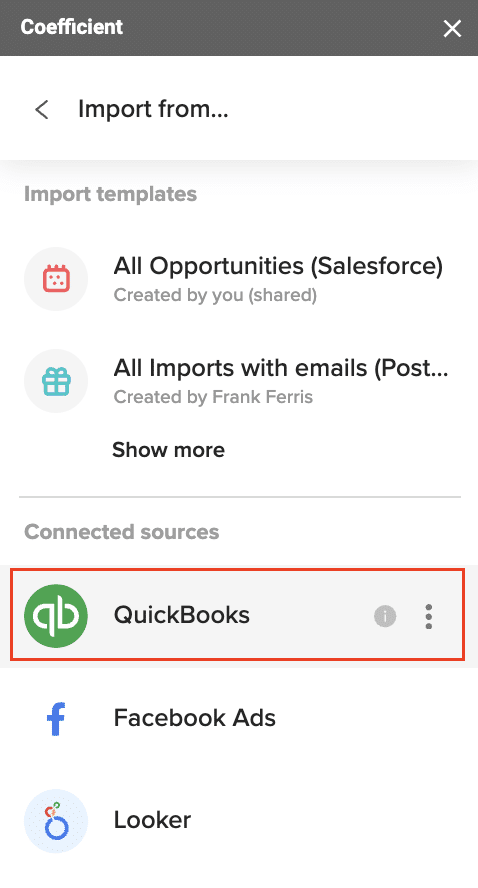
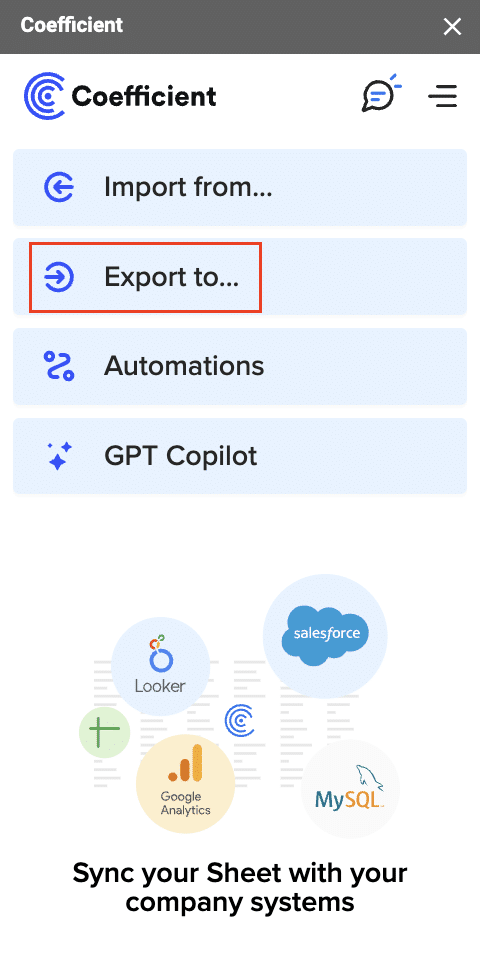
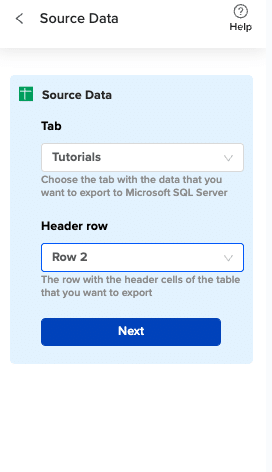
  3. Choose your import method:
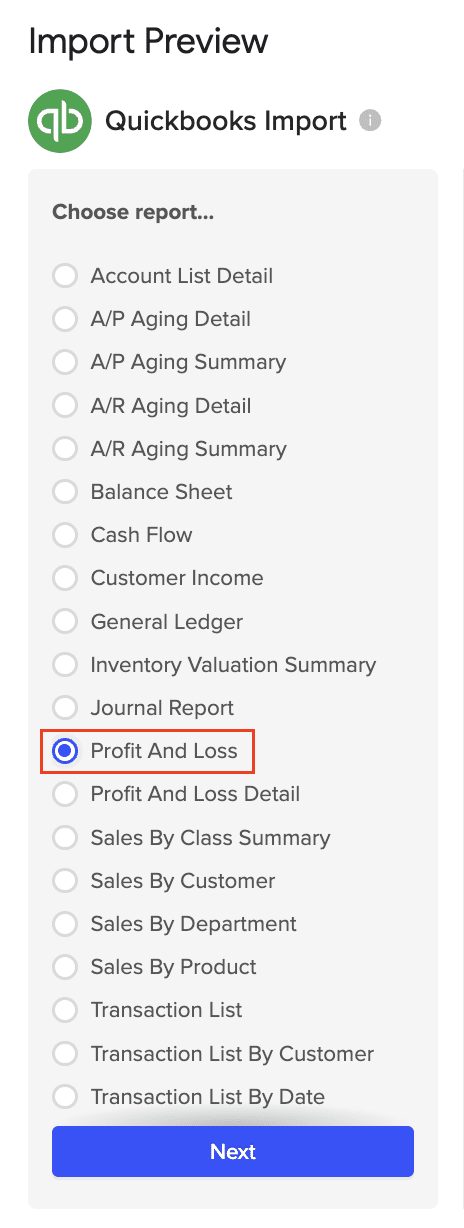
    • Import from existing QuickBooks reports
    • Build custom imports from any QuickBooks object (Invoices, Bills, Payments, etc.)
    • Write custom queries for complex data needs
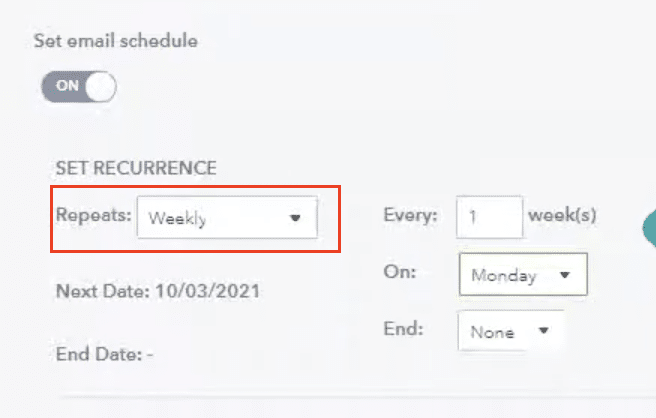
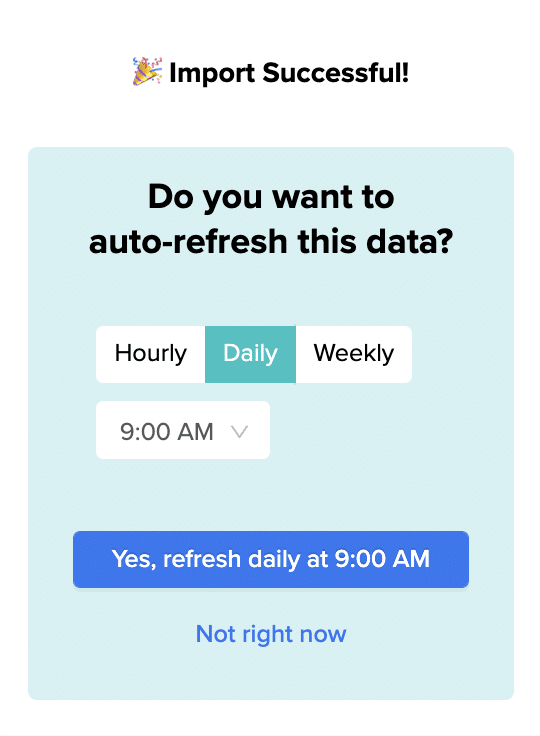
  4. Set your refresh schedule:
    • Hourly (every 1, 2, 4, or 8 hours)
    • Daily at a specific time
    • Weekly on selected days
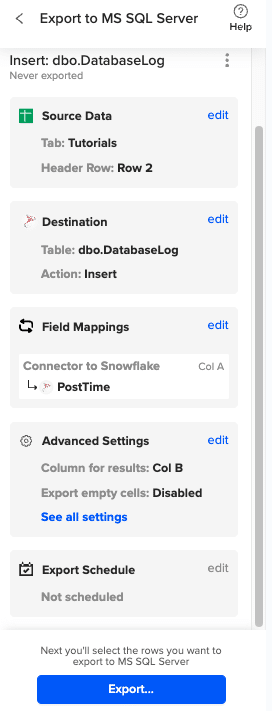
  5. Add validation formulas in adjacent columns to flag potential errors

Real results from real companies

“Before Coefficient, I was doing multiple data pulls a day. If you just add up those hours, week over week, month over month, it’s a huge time sink. It also disrupts your flow while analyzing data.”

— Christian Budnik, FP&A Analyst at Solv

Solv’s Success Story:

Solv’s FP&A team struggled with manual QuickBooks data exports that consumed hours every day. After implementing Coefficient, they:

  • Saved 364 hours per year across their 7-person team
  • Eliminated manual CSV exports and copy-paste operations
  • Gained real-time visibility into financial data
  • Enabled faster, data-driven decision-making across the organization

Christian Budnik was even promoted after introducing Coefficient to his team’s workflow. Read the full case study →

Benefits over manual methods

When you automate your QuickBooks data workflows with Coefficient, you get:

Time savings: No more manual exports, no more broken formulas when columns change, no more rebuilding dashboards before sharing them.

Real-time accuracy: Your spreadsheets always reflect current QuickBooks data. Schedule automatic refreshes and trust that your numbers are up-to-date.

Error prevention: Catch mistakes as they happen instead of discovering them during monthly closes. Set up alerts to notify you via Slack or email when specific conditions are met.

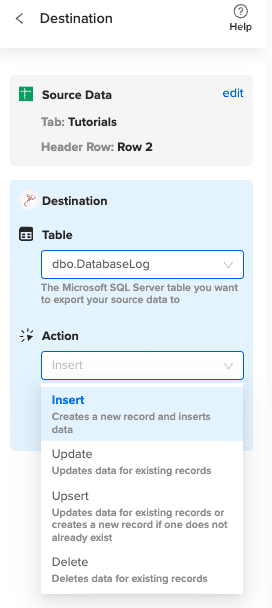
Two-way sync: Not only can you pull data from QuickBooks, but you can also push updates back. Update records, insert new transactions, or delete entries directly from your spreadsheet.

Audit trails: Every import includes timestamps and tracking columns so you know exactly when data was pulled and what changed.

Fixing Accounting Mistakes in Quickbooks

Having to investigate and fix accounting mistakes in any accounting software, including QuickBooks, can be time consuming and frustrating. Depending on the severity of the mistake and how long it has been occurring, it may take minutes or days to fully clean up.

There are several connectors that integrate with QuickBooks Online that make it possible to better report on and pull transactions out of QuickBooks Online in a digestible way. One such software is Coefficient.

By using Coefficient you may be able to identify and correct accounting mistakes sooner by slicing the data out of QuickBooks into easy to use financial reports. The speed of reporting out of Coefficient will also assist in identifying these mistakes sooner than if you are manually pulling and manipulating reports out of QuickBooks Online.

Get started with Coefficient to enhance your reporting capabilities and transform your accounting processes and reporting. Pull your transactional data into actionable business insights.

Ready to take your data analysis to the next level?

Try Coefficient to seamlessly integrate your Excel with live data from various business systems, enabling real-time analysis and more advanced financial modeling.

Connecting QuickBooks to SQL Server: A Comprehensive Guide for Businesses

Are you looking to enhance your financial data management by connecting QuickBooks to SQL Server? You’re in the right place. This guide will walk you through three proven methods to establish this connection, helping you choose the best solution for your business needs.

Why Connect QuickBooks to SQL Server?

Before we dive into the how-to, let’s explore why businesses are increasingly connecting QuickBooks to SQL Server:

  1. Advanced Financial Reporting: By combining QuickBooks financial data with other business metrics in SQL Server, you can create more comprehensive reports and perform in-depth analytics.
  2. Automatic Data Synchronization: Say goodbye to manual data entry. Connecting these systems ensures real-time accuracy between your accounting and operational data.
  3. Improved Data Management: SQL Server’s advanced capabilities allow you to handle large volumes of financial data while still using QuickBooks as your primary accounting system.

Now that we understand the benefits, let’s explore the top three methods to connect QuickBooks to SQL Server.

Top 3 Methods to Connect QuickBooks to SQL Server

SolutionBest For
CoefficientNon-technical users who need to sync QuickBooks data to SQL Server through spreadsheets with automated updates and no coding required
QODBC DriverTechnical teams requiring direct database connectivity and custom SQL queries for QuickBooks data
Hevo DataOrganizations needing enterprise-grade ETL capabilities with advanced data transformation features

#1 Coefficient: The No-Code Solution

Is ScreenShot at coefficient homepage?

Coefficient provides a user-friendly approach to connecting QuickBooks to SQL Server using spreadsheets as an intermediate layer. This method is perfect for business users who want to maintain data accuracy while using familiar tools.

Setting Up Coefficient

Step 1. Install Coefficient

For Google Sheets

  • Open a new or existing Google Sheet, navigate to the Extensions tab, and select Add-ons > Get add-ons.
  • In the Google Workspace Marketplace, search for “Coefficient.”
  • Follow the prompts to grant necessary permissions.
  • Launch Coefficient from Extensions > Coefficient > Launch.
  • Coefficient will open on the right-hand side of your spreadsheet.
Coefficient open in the Google side panel.

For Microsoft Excel

  • Open Excel from your desktop or in Office Online. Click ‘File’ > ‘Get Add-ins’ > ‘More Add-Ins.’
  • Type “Coefficient” in the search bar and click ‘Add.’
  • Follow the prompts in the pop-up to complete the installation.
  • Once finished, you will see a “Coefficient” tab in the top navigation bar. Click ‘Open Sidebar’ to launch Coefficient.
Coefficient open in the Excel side panel.

Step 2. Connect and Import Data from QuickBooks

Open Coefficient Sidebar and Click on the Menu icon.

Menu icon and coefficient toolbar.

In the menu, Select “Import From…” and Select “Connected Sources.”

Connected Sources selection menu

Select “Add Connection” at the bottom of the “Connected Sources” list and select QuickBooks.

QuickBooks Connection option screen?

Click on Connect. In the next window, you will be asked to authorize QuickBooks by providing your log in details and allowing data exchange to connect the Coefficient with the platform.

QuickBooks authorization window.

Open the Coefficient Sidebar and click the “Import from…” button to start the import. Choose “QuickBooks” from the provided list, and select  “From QuickBooks Report“.

Import menu with available sources?
QuickBooks Report Selection Screen

Pick the specific QuickBooks report you wish to import from your account (e.g., Profit and Loss).

Report type selection interface.

Personalize your import settings by selecting options for “Display Columns By, “”Report Period,” “Accounting Method,” and the necessary fields for this import.

The report settings configuration panel

Note: When adjusting your import settings, click “Refresh Preview” to see the updated sample data. The data will be sorted automatically based on the columns shown. For instance, “Customers” will appear alphabetically.

Click on Import in the top right corner, and you will have a spreadsheet synced with your QuickBooks!

Import confirmation interface

Step 3. Export Data from Your Spreadsheet to MS SQL

Before starting, make sure you’ve connected to MS SQL.

Then, navigate to Coefficient’s menu >Click “Export to…”

Export menu navigation screen?

Select MS SQL.

SQL Server selection interface?

Choose the tab in your workbook that contains the data you want to export and specify the header row that contains the database field headers.

Got a roadmap in window?

Specify the table in your database where you want to insert the data and choose the appropriate action (Insert, Update, Delete).

Database Table Configuration menu

Complete the field mappings for the export. Then, confirm your settings and click “Export” to proceed.

Field mapping confirmation.

Then, highlight the specific rows in your sheet that you want to export, or choose to export all rows.

Row selection. Export view?

Review your settings and follow the prompts to push your data back to MS SQL.

Pros:

  • No coding required
  • User-friendly interface
  • Automated scheduling
  • Real-time data updates

Cons:

  • Requires spreadsheet intermediate step
  • Limited to spreadsheet data volume constraints

Related Resources:

#2 QODBC Driver: For Direct Database Connection

QODBC driver configuration?

QODBC Driver enables a direct connection between QuickBooks and SQL Server through ODBC protocol, allowing for native database integration and custom SQL queries.

Setting Up QODBC Driver:

Let’s walk you through the complete process of setting up a direct connection between QuickBooks and SQL Server using QODBC:

  1. Install QODBC Driver First, let’s properly set up the QODBC environment:
  • Download the latest QODBC Driver from qodbc.com
  • Run the installer as administrator

Choose installation type:

Installation Type: Complete

Version: 64-bit (recommended for modern systems)

Features: Select all components including:

  – QODBC Driver

  – Sample Programs

  •   – Documentation
  • After installation, restart your computer to ensure all components are properly registered
  1. Configure QuickBooks Database Server Manager Now we’ll prepare QuickBooks for external connections:
  • Open QuickBooks Database Server Manager

Configure the server settings:

Server Settings:

– Monitor Path: C:QBData (or your QuickBooks company file location)

– Scan Interval: 60 seconds

– Allow remote connections: Yes

  • – Port: 8019 (default)

Set up security:

Security Settings:

– Enable SSL/TLS: Yes

– Authentication Mode: Mixed

– Create dedicated service account:

  Username: qbservice

  •   Password: [Strong Password]
  1. Set up ODBC Data Source Create and configure your ODBC connection:
  • Open ODBC Data Source Administrator (64-bit)

Add new System DSN:

Driver: QODBC Driver for QuickBooks

Data Source Name: QB_Production

Description: QuickBooks Production Connection

Connection Settings:

– Application: Your application name

– Connection Type: QODBC Desktop

  • – Company File: [Path to your .QBW file]

Configure advanced settings:

Advanced Options:

– Connection Pooling: Yes

– Max Pool Size: 100

– Connection Timeout: 30

– Command Timeout: 300

  • – Auto Reconnect: Yes
  1. Configure SQL Server Linked Server Set up the connection in SQL Server:

— Create the linked server

EXEC sp_addlinkedserver

    @server = ‘QUICKBOOKS’,

    @srvproduct = ‘QODBC for QuickBooks’,

    @provider = ‘MSDASQL’,

    @datasrc = ‘QB_Production’;

— Configure security

EXEC sp_addlinkedsrvlogin

    @rmtsrvname = ‘QUICKBOOKS’,

    @useself = ‘FALSE’,

    @locallogin = NULL,

    @rmtuser = ‘qbuser’,

    @rmtpassword = ‘your_password’;

— Set up distributed transaction support

EXEC sp_serveroption

    @server = ‘QUICKBOOKS’,

    @optname = ‘rpc out’,

    @optvalue = ‘true’;

  1. Test Connection and Execute Queries Let’s verify everything works and set up some useful queries:

— Test basic connectivity

SELECT * FROM OPENQUERY(

    QUICKBOOKS,

    ‘SELECT TOP 1 * FROM Customer’

);

— Create a stored procedure for data synchronization

CREATE PROCEDURE dbo.SyncQuickBooksData

AS

BEGIN

    BEGIN TRY

        BEGIN TRANSACTION;

        — Sync customers

        INSERT INTO dbo.QB_Customers

        SELECT * FROM OPENQUERY(

            QUICKBOOKS,

            ‘SELECT

                CustomerID,

                FullName,

                CompanyName,

                BillAddressStreet,

                BillAddressCity,

                BillAddressState,

                Balance

            FROM Customer

            WHERE TimeModified >= DATEADD(hour, -24, GETDATE())’

        );

        — Sync invoices

        INSERT INTO dbo.QB_Invoices

        SELECT * FROM OPENQUERY(

            QUICKBOOKS,

            ‘SELECT

                TxnID,

                CustomerID,

                TxnDate,

                DueDate,

                BalanceRemaining,

                IsPaid

            FROM Invoice

            WHERE TimeModified >= DATEADD(hour, -24, GETDATE())’

        );

        COMMIT TRANSACTION;

    END TRY

    BEGIN CATCH

        ROLLBACK TRANSACTION;

        THROW;

    END CATCH;

END;

Pros:

  • Direct database connection
  • Native SQL query support
  • No intermediate tools required

Cons:

  • Requires technical expertise
  • Complex setup process
  • Additional licensing costs

#3 Hevo Data: Enterprise-Grade ETL Solution

A screenshot of Hivo Data's homepage.

Hevo Data offers a cloud-based ETL platform for seamlessly moving data from QuickBooks to SQL Server with advanced transformation capabilities.

Hevo Data Setup Process:

Let’s set up your QuickBooks to SQL Server pipeline using Hevo Data:

  1. Create Hevo Data Account Begin by setting up your Hevo environment:
  • Visit Hevo Data website and sign up for an account
  • Choose “Enterprise” plan for full QuickBooks integration

Complete organization setup:

Organization Details:

  Name: Your Company

  Industry: Your Industry

  Data Volume: Estimated monthly records

  •   Time Zone: Your local timezone
  1. Configure QuickBooks as Source Connect your QuickBooks account:
  • In Hevo dashboard, go to “Sources” → “Add Source”
  • Select “QuickBooks Online”

Connect your QuickBooks account:

Connection Details:

  Name: QuickBooks Production

  Environment: Production

  Authentication: OAuth 2.0

Data Selection:

  Entities:

    – Customers

    – Invoices

    – Bills

    – Payments

    – Items

Sync Settings:

  Initial Sync: Full load

  Incremental Sync: Modified date

  •   Sync Frequency: 15 minutes
  1. Set up SQL Server as Destination Configure your target database:

Destination Configuration:

  Type: Microsoft SQL Server

  Name: Production DB

  Connection Details:

    Host: your-server.database.windows.net

    Port: 1433

    Database: your_database

    Schema: quickbooks

    Username: hevo_user

    Password: your_password

  Advanced Settings:

    Batch Size: 10000

    Connection Timeout: 300

    SSL Mode: require

  1. Define Data Mapping Create your data transformation rules:

Mapping Rules:

  Customers:

    Source: QB_Customer

    Target: dbo.Customers

    Transformations:

      – Name: CONCAT(FirstName, ‘ ‘, LastName)

      – Email: LOWER(Email)

      – ModifiedDate: TO_TIMESTAMP(LastUpdatedTime)

  Invoices:

    Source: QB_Invoice

    Target: dbo.Invoices

    Transformations:

      – Amount: CAST(TotalAmount AS DECIMAL(18,2))

      – Status: CASE WHEN IsPaid THEN ‘Paid’ ELSE ‘Outstanding’ END

  1. Schedule Data Pipeline Set up your automation:

Pipeline Schedule:

  Frequency: 15 minutes

  Retry Settings:

    Max Attempts: 3

    Delay: 5 minutes

  Error Handling:

    Failed Records: Load to error table

    Notification: Email and Slack

  Monitoring:

    Metrics:

      – Record count

      – Processing time

      – Error rate

    Dashboard: Enabled

    Alerts:

      – Pipeline failure

      – High latency (>30 min)

      – Error threshold (>1%)

Pros:

  • Enterprise-grade ETL features
  • Advanced data transformations
  • Scalable architecture

Cons:

  • Higher cost for small businesses
  • Requires technical configuration
  • May have learning curve

Choosing the Right Method for Your Business

When selecting the best method to connect QuickBooks to SQL Server, consider your team’s technical expertise, budget, and specific data needs.

For most small to medium-sized businesses, Coefficient offers the most straightforward approach. It’s user-friendly, requires no coding, and provides reliable data synchronization without technical complexity.

QODBC Driver is ideal for organizations with in-house technical teams that need direct database access and custom SQL queries.

Hevo Data suits larger enterprises requiring advanced ETL features and data transformations.

Start Syncing Your QuickBooks Data to SQL Server Today

Connecting QuickBooks to SQL Server doesn’t have to be complicated. While each method has its merits, Coefficient provides the most user-friendly approach for business users who need reliable data synchronization without technical complexity. Get started with Coefficient today to streamline your data integration process.

Frequently Asked Questions

How do I connect QuickBooks to SQL? 

While there are multiple methods, the easiest way is using Coefficient’s no-code solution that allows you to sync QuickBooks data to SQL Server through spreadsheets with automated updates.

Can QuickBooks be used as a database? 

Yes, QuickBooks has database capabilities through its Database Server Manager, but connecting it to SQL Server through Coefficient provides more robust database functionality and reporting capabilities.

Can you put QuickBooks desktop on a server? 

Yes, QuickBooks can be installed on a terminal server for network access, but using Coefficient eliminates the need for complex server setup while maintaining data synchronization.

Does QuickBooks Online use SQL? 

QuickBooks Online can be connected to SQL through various methods, with Coefficient offering the most straightforward approach for non-technical users.

By following this guide, you’ll be well on your way to leveraging the power of SQL Server with your QuickBooks data, opening up new possibilities for financial analysis and reporting in your business.

5 Ways to View QuickBooks Online Reports Without Full Access (With Tutorials)

Can you access QuickBooks Online reports without full permissions? Absolutely!

This comprehensive guide will show you seven proven methods to view QuickBooks Online reports, even without admin access. You’ll learn step-by-step processes, best practices, and discover how Coefficient can enhance your reporting capabilities without additional QuickBooks seats.

Let’s dive in!

Method 1: Share from Your Spreadsheet with Coefficient

Coefficient is a powerful spreadsheet add-on that connects your business data from various sources directly to Excel and Google Sheets. It offers a robust solution for accessing QuickBooks Online reports without needing additional QuickBooks seats. This method is particularly cost-effective for organizations looking to expand report access without increasing their QuickBooks subscription costs.

Setting Up Coefficient for QuickBooks Report Access

Step 1: Sign up for Coefficient.

  • Visit the Coefficient website and create an account.
  • Choose the plan that best fits your organization’s needs.

Step 2: Install the Coefficient add-on.

Step 3: Connect Coefficient to QuickBooks Online.

  • Open a new spreadsheet and launch the Coefficient add-on.
  • Select QuickBooks Online from the list of available integrations.
  • Follow the prompts to authenticate and connect your QuickBooks Online account.

Step 4: Import QuickBooks data into your spreadsheet.

  • Use Coefficient’s data import feature to select the reports or data you want to access.
  • Choose the specific fields and date ranges for your report.

Step 5 (optional): Set up automatic data refresh.

  • Configure Coefficient to automatically update your spreadsheet with the latest QuickBooks data.
  • Set the refresh frequency based on your reporting needs.

Step 6: Share your import.

Share the spreadsheet with team members using Google Sheets’ or Excel’s built-in sharing features. Your colleagues can view live QuickBooks data without needing their own QuickBooks login.

Method 2: Set Up a Reports-Only User in QuickBooks Online

Creating a Reports-Only user is an excellent way to provide limited access to QuickBooks Online reports.

Pros and Cons of Reports-Only User

Pros:

  • Built-in QuickBooks feature
  • Provides focused access to reports

Cons:

  • Limited customization options
  • Requires a QuickBooks Online subscription (Plus and Advanced subscription tier)

Step-by-Step Tutorial: Creating a Reports-Only User

Step 1: Log in to QuickBooks Online as an admin.

  • Access your QuickBooks Online account using administrator credentials.

Step 2: Navigate to user management.

  • Click on the gear icon in the top-right corner.
  • Select “Manage Users” under “Your Company.
User management settings page in QuickBooks Online

Step 3: Add a new user.

  • Click the “Add user” button.
Add user button interface?
  • Choose “Reports only” as the user type.
User type selection showing "Reports only" option?

Step 4: Enter user details.

  • Provide the new user’s email address and name.
Your entry form details.
  • Create a username or use their email address as the username.

Step 5: Set user permissions.

  • Review the default permissions for the Reports-Only user.
  • Adjust any specific report access settings if needed.

Step 6: Send invitation.

  • Click “Save” to create the user.
  • An invitation email will be sent to the new user with login instructions.

Reports Accessible to Reports-Only Users

Reports-Only users can access most standard QuickBooks Online reports, including:

  • Profit and Loss
  • Balance Sheet
  • Statement of Cash Flows
  • Accounts Receivable Aging
  • Accounts Payable Aging
  • Sales by Customer
  • Expenses by Vendor

Limitations and Considerations

While Reports-Only access is useful, it has some limitations:

  • Users cannot create or modify transactions.
  • Some advanced customization options may be restricted.
  • Access to certain sensitive reports (e.g., Audit Log) is not available.

Method 3: Share Specific Reports with Non-QuickBooks Users

QuickBooks Online allows you to share individual reports with users who don’t have a QuickBooks account.

Pros and Cons of Sharing Specific Reports

Pros:

  • No QuickBooks account required for recipients
  • Can set expiration dates for shared reports

Cons:

  • Limited to specific reports
  • Requires manual sharing for each report

Tutorial: Using the Shared Reports Feature

Step 1: Generate the desired report.

  • Open QuickBooks Online and navigate to the Reports section.
  • Select and customize the report you want to share.

Step 2: Access sharing options.

  • Click the “Share” button at the top of the report.
Report sharing options interface

Step 3: Configure sharing settings.

  • Enter the email addresses of the recipients.
  • Choose whether to allow recipients to view only or to view and export the report.

Step 4: Set an expiration date (optional).

  • Decide how long the shared link should remain active.

Step 5: Add a message (optional).

  • Include any necessary context or instructions for the report.

Step 6: Send the shared report.

  • Click “Send” to share the report with the specified recipients.

Setting Up Recurring Shared Reports

To automate report sharing:

Step 1: Open the report you want to share regularly.

Step 2: Click “Save customization” and then “Schedule.”

Save customization and schedule menu?

Step 3: Set the frequency (e.g., daily, weekly, monthly).

Report frequency. Interface

Step 4: Enter recipient email addresses.

Email entry interface.

Step 5: Choose the file format (e.g., PDF, Excel).

Configuration menus for exports

Step 6: Click “Save schedule” to activate recurring sharing.

Best Practices for Secure Report Sharing

  1. Regularly review and update your shared report list.
  2. Use expiration dates for sensitive reports.
  3. Avoid sharing reports with personal or sensitive information.
  4. Educate recipients on the confidentiality of shared reports.

Method 4: Use QuickBooks Online Accountant for Client Report Access

QuickBooks Online Accountant (QBOA) provides a way for accountants to access client reports without needing full access to the client’s QuickBooks Online account.

Pros and Cons of Using QBOA

Pros:

  • Designed specifically for accountants
  • Provides comprehensive access to client data

Cons:

  • Limited to accounting professionals
  • Requires separate QBOA account

Accessing Client Reports as an Accountant

Step 1: Sign up for QuickBooks Online Accountant.

  • Visit the QuickBooks Online Accountant website and create an account.

Step 2: Connect with your client.

  • In QBOA, go to the “Clients” tab and click “Add client.”
  • Enter your client’s QuickBooks Online information.

Step 3: Access client reports.

  • Once connected, select the client from your client list.
  • Navigate to the “Reports” section to view available reports.

Collaborating with Clients Through QBOA

  1. Use the “Work” tab to manage tasks and communicate with clients.
  2. Share report insights and recommendations through secure messaging.
  3. Schedule virtual meetings to discuss reports and financial strategies.

Tips for Maximizing QBOA Reporting Features

  1. Utilize the customizable client dashboard for quick financial overviews.
  2. Take advantage of the Accountant Toolbox for advanced reporting options.
  3. Use the “Books Review” feature to identify and resolve discrepancies in client reports.

Method 5: Utilize QuickBooks Online’s Report Export Feature

Exporting reports from QuickBooks Online allows you to share financial data without granting direct access to the system. For a more automated approach, consider exporting QuickBooks data to Google Sheets or Excel with Coefficient.

Pros and Cons of Report Exporting

Pros:

  • Easy to share reports with non-QuickBooks users
  • Allows for offline analysis of data

Cons:

  • Manual process for each report
  • Data may become outdated quickly

Step-by-Step Guide: Exporting Reports

Step 1: Generate the desired report in QuickBooks Online.

Step 2: Click the “Export” button at the top of the report.

Step 3: Choose the export format:

  • PDF: Best for preserving report layout
  • Excel: Ideal for further analysis
  • CSV: Suitable for importing into other systems

Step 4: Configure any additional export options:

  • For Excel/CSV: Choose to export formatted or raw data
  • For PDF: Select page orientation and paper size

Step 5: Click “Export” to download the report file.

Scheduling Automatic Report Exports

Step 1: Open the report you want to export regularly.

Step 2: Click “Save customization” and then “Schedule.”

Save customization and schedule menu?

Step 3: Set the export frequency and recipient email addresses.

Export setting configuration screen

Step 4: Choose the export format (PDF, Excel, or CSV).

Configuration menus for exports

Step 5: Click “Save schedule” to activate automatic exports.

QuickBooks Online Report Access 101: User Roles and Permissions Explained

Before diving into the methods, it’s crucial to understand how QuickBooks Online (QBO) manages user roles and permissions for report access.

Different User Roles in QuickBooks Online

QuickBooks Online offers several user roles, each with varying levels of access:

  1. Company Administrator
  2. Custom User
  3. Reports Only
  4. Time Tracking Only
  5. Vendor and Purchases Only

Specific Permissions for Report Access

Report access permissions vary depending on the user role:

  • Company Administrators have full access to all reports
  • Custom Users can be granted access to specific reports
  • Reports Only users can view and customize reports but can’t make changes to company data

The “Reports Only” User Role

The Reports Only role is designed specifically for users who need to view financial data without the ability to modify it. This role:

  • Can access and customize most reports
  • Cannot make changes to transactions or company settings
  • Is ideal for managers or stakeholders who need financial insights without full system access

Tips for Managing Exported Reports

  1. Create a consistent file naming convention for easy organization.
  2. Use cloud storage solutions to securely share exported reports.
  3. Implement version control for reports that are updated frequently.
  4. Regularly review and delete outdated exported reports.

Maximizing QuickBooks Online Report Access with Coefficient

Accessing QuickBooks Online reports without full access can be challenging, but the seven methods we’ve explored offer various solutions to this common problem.

While each method has its merits, Coefficient stands out as a comprehensive solution that addresses the limitations of other methods:

  • Seamless integration with QuickBooks Online
  • Cost-effective solution that doesn’t require additional QB seats
  • Advanced reporting and analysis capabilities
  • Easy sharing through familiar spreadsheet interfaces

 Ready to transform your QuickBooks Online reporting experience? Try Coefficient today and discover how it can streamline your financial reporting process while providing enhanced access and insights.

How to Move from QuickBooks Desktop to QuickBooks Online in 4 Steps

Whether you’re using QuickBooks Desktop Pro, QuickBooks Enterprise, or the Mac version of QuickBooks, this guide will help you transition to QuickBooks Online (QBO).

As a traditional accounting software, QuickBooks Desktop requires local installation on your computer, while QuickBooks Online from Intuit is a cloud-based solution preferred by many small business owners for its online version advantages.

One significant limitation of QB Desktop and other desktop versions is the installation requirement. Whether you’re running QuickBooks Desktop Enterprise or the standard version, this makes it challenging for QuickBooks Desktop users to collaborate across multiple devices.

This restriction has prompted many businesses to migrate to a new QuickBooks online version. Additionally, QBO offers enhanced functionality and integrates with numerous apps, providing continuous updates through its cloud-based platform at competitive pricing levels.

This comprehensive tutorial will guide you through the conversion process of moving from QuickBooks Desktop to your QuickBooks Online subscription.

Let’s get started!

Step-by-Step Guide: Migrating from QuickBooks Desktop to QuickBooks Online

Step 1: Making Sure QuickBooks Desktop is Up-to-Date

Before deciding to make the move from QuickBooks Desktop to QuickBooks Online, you will want to ensure the data in your QuickBooks Desktop instance is current. You will want to verify that any customers, vendors, or accounts that are no longer used are marked inactive. This will help prevent uploading unnecessary information and save you time as you move.

You will also want to clean up any unbilled charges, classify transactions that are still pending, and any other clean-up work that may be relevant to your bookkeeping. Depending on what functions you are performing out of your QB Desktop, you may also need to:

  • Terminate or deactivate employees that no longer are employed at your business if you are running online payroll out of QuickBooks Desktop. Additionally, you may want to wait a few days after running a payroll to move your company data to your QuickBooks Online subscription.
  • If you are using the software to track inventory or sales tax out of your QuickBooks Desktop, you may want to save a sales tax liability report in the event you need to enter adjustments in QuickBooks Online after you move.

While all of these may not be a necessity to move from QuickBooks Desktop to QuickBooks Online, having the most relevant and up-to-date information prior to converting will save time. It’s essential to review your chart of accounts and complete any pending reconciliations before proceeding.

Step 2: Download QuickBooks Desktop Information

Once you’re confident that your data file is clean and as up-to-date as possible, you will need to download your company file out of QuickBooks Desktop to upload into your QuickBooks Online company.

To do this, you will first need to export company file to QuickBooks Online. You will then select get started and will need to sign in as an administrator to your QuickBooks Online account.

If you have more than one company, you will then be prompted to select which company data you want to move to QuickBooks Online, and then will be able to export your QuickBooks Desktop company file to transfer to QuickBooks Online.

Step 3: Upload QuickBooks Desktop File to QuickBooks Online

Once you’ve set up and downloaded your QuickBooks Desktop data, you will need to log into your QuickBooks Online instance. You will be prompted to bring your company file to QuickBooks Online and can select “next” when you are ready.

Upload screen showing QuickBooks Next without file selection?

After selecting get started, you will be prompted to upload the QuickBooks Desktop file you previously downloaded in step 2. You can select the file at the path where you saved your backup file and begin the upload process.

After you’ve uploaded your file, you can determine what you would like to bring into QuickBooks Online.

Data selection screen for company file export

If you are doing a full migration of your company to QuickBooks Online, you can select to export all your company data. If you are only looking to move certain transactions, you can filter down to export specific data. This may be helpful for organizations that have a lot of transactions and only want to upload balances to QuickBooks Online.

Step 4: Set-Up QuickBooks Online

Once you’ve successfully migrated your QuickBooks Desktop information to QuickBooks Online, you will need to set up QuickBooks Online to function for your business.

To begin, you will need to connect your bank accounts and/or credit card accounts to QuickBooks Online to automatically pull in transactions. To do this, navigate to the transactions – bank transactions option in the main menu using the drop-down.

Bank Transactions Menu in QuickBooks Online

Once in the bank transactions section, you can select to link your account.

Bank account linking interface


You will be prompted to type in the name of your bank. QuickBooks Online has a pre-built connector with most major banks, which allows you to seamlessly upload transactions into QuickBooks Online. In the event that your bank doesn’t have a pre-built connection with QuickBooks Online, you may need to manually upload bank files to QuickBooks Online.

You will also need to verify that you are set up to create and send customer invoices. You can check the formatting of your invoices in QuickBooks Online by navigating to Sales – Invoices in the main menu.

Invoice Creation and Customization page

Once in the invoice section, you can select to create an invoice or change your current invoice formatting/template. This may be important for your customers who are accustomed to invoices coming out of QuickBooks Desktop. A customer may be less likely to think the invoice is legitimate if it is in a different format or doesn’t have the company’s logo in it.

If you were previously running your accounts payable out of QuickBooks Desktop, you will also want to get familiar with the bill payment functionality within QuickBooks Online. Navigate to Expenses – Bills in the main menu to manage this aspect.

Build payment status overview screen.

Once here you will be able to see which invoices you have that are in review, unpaid, and paid.

Contractors management interface.

You can also add any additional bills from the bills page as you operate the business out of QuickBooks Online.

Additionally, if you are paying 1099 contractors directly out of QuickBooks Online you will want to navigate to Expenses – Contractors from the main menu.

Contractors selected an interface.

Once here, you can verify that your contractors were imported correctly from QuickBooks Online and if you were previously paying via direct deposit to those contractors, ensure that their banking information is set up correctly and direct deposit is turned on for those vendors to pay out of QuickBooks Online.


These are just a few of the major set-up and learning items that you will need to look at as your business starts to operate out of QuickBooks Online instead of QuickBooks Desktop.

Benefits of Moving to QuickBooks Online

  • Cloud-based accessibility from any device, eliminating the need for specific desktop versions
  • Real-time collaboration with team members and your bookkeeping team
  • Automatic updates and enhanced functionality without manual installations
  • Integration with modern business apps and tools
  • Improved bookkeeping efficiency through automated features
  • Advanced reporting capabilities beyond traditional QuickBooks Desktop options
  • Automated bank feeds and reconciliations
  • Enhanced sales tax tracking and reporting
  • Better support for remote work and multi-user access

Improve Your Accounting Solution by Switching to QuickBooks Online

Running off of QuickBooks Desktop can be cumbersome and create issues for you and your organization. Many businesses are switching from on-premise downloadable platforms to cloud based solutions to allow more flexibility and ease of use.

Switching to QuickBooks Online creates an easier, more accessible platform to use across your organization and create efficiencies across your accounting team. QuickBooks Online also is able to connect to reporting tools such as Coefficient to seamlessly pull information out of QuickBooks Online. Coefficient also enhances your reporting capabilities out of QuickBooks Online so you aren’t reliant on reporting out of QuickBooks Desktop.

Ready to take your data analysis to the next level?

Try Coefficient to seamlessly integrate your Excel with live data from various business systems, enabling real-time analysis and more advanced financial modeling.

Meta data

Meta Title: How to Move from QuickBooks Desktop to QuickBooks Online: Step-by-Step Guide (2024)

Meta Description: Learn how to move from QuickBooks Desktop to QuickBooks Online

Top 5 Limitations in Reporting Using QuickBooks Online

QuickBooks Online, a popular accounting software from Intuit, is widely used by small businesses and freelancers for their business accounting needs. However, despite its user-friendly interface and basic functionality, many business owners encounter significant limitations when it comes to reporting. This article explores the top five cons of QuickBooks Online in reporting and offers potential solutions.

The Disadvantages of QuickBooks: Reporting Challenges

1. Customization Constraints in QuickBooks Online Reporting

Limited Built-in Custom Reports

While QBO provides standard reports, users often struggle to tailor them to specific business needs. This limitation becomes apparent when trying to create:

  • Department-specific reports
  • Granular details by product line
  • Custom financial reports

Many businesses resort to third-party apps or extensive manual work to achieve the level of customization they need. The lack of advanced reporting options in QuickBooks Online often leads to inefficiencies and frustration among entrepreneurs and bookkeepers.

Lack of Advanced Filtering and Grouping Options

QuickBooks Online restricts users’ ability to filter data using complex conditions. This limitation becomes evident when trying to:

  • Apply multi-layered filters (e.g., by date, location, and product category simultaneously)
  • Create advanced groupings beyond basic levels
  • Sort data using multiple criteria

These constraints can significantly impact the functionality of the accounting solution for businesses with complex reporting needs, especially when compared to the QuickBooks Desktop version.

2. File Size and Data Handling Limitations

Struggles with Large Datasets

QuickBooks Online reports often struggle to process large volumes of data efficiently. This limitation leads to:

  • System crashes when generating comprehensive reports
  • The need to break up reports into smaller chunks
  • Reduced date ranges to avoid performance issues

For businesses managing large volumes of transactions, this limitation causes significant inefficiencies in their accounting and bookkeeping processes, particularly for those dealing with ecommerce or multiple bank accounts.

Limited Date Ranges for Reports

QuickBooks Online frequently encounters issues when handling year-long or multi-year reports. Users experience:

  • System crashes or timeouts when attempting to generate long-term reports
  • The need to export data month by month for accurate reporting
  • Difficulties in analyzing long-term trends or year-over-year comparisons

These limitations are particularly problematic for businesses that need to analyze historical financial data or prepare comprehensive financial reports for profitability analysis.

3. Integration Limitations

Difficulty Syncing with External Tools

Users face challenges when trying to integrate QuickBooks Online with other platforms to generate comprehensive reports. This limitation affects:

  • Syncing with CRM systems
  • Integration with inventory management software
  • Consolidating data for project management and job costing

Businesses relying on multiple systems find QuickBooks Online’s limited integration capabilities to be a major bottleneck for creating consolidated reports that provide a holistic view of their operations.

Reliance on Manual Processes Due to Limited Integration

The lack of seamless integration often forces users to resort to manual data transfers or rely heavily on spreadsheets like Excel. This workaround:

  • Increases the chance of human error
  • Consumes valuable time and resources
  • Limits real-time reporting capabilities

Many businesses find themselves spending excessive time on manual data entry and consolidation due to these integration limitations, which can be particularly challenging for medium-sized businesses with complex workflows.

4. Performance Issues with Larger Data

Lagging and Sluggish Performance

As businesses scale and their data grows, QuickBooks Online’s performance often degrades. Users experience:

  • Slower response times when generating reports
  • Difficulties handling multiple users accessing the system simultaneously
  • Increased wait times for routine financial analysis

These performance issues can lead to significant inefficiencies, especially for businesses that rely on timely financial information for decision-making. The problem is often exacerbated for companies using the Simple Start or basic versions of QuickBooks Online.

Inconsistent Load Times for Reports

Users report varying load times when running complex or multi-year reports in QuickBooks Online. This inconsistency results in:

  • Unpredictable wait times for report generation
  • System crashes during report creation
  • Difficulties in scheduling regular financial reviews

These issues can disrupt workflows and make it challenging to maintain consistent reporting schedules, particularly for businesses that require frequent bank reconciliation or detailed expense tracking.

5. Inadequate Support for Complex Businesses

Multi-EntityReporting

QuickBooks Online struggles to provide sufficient support for businesses with multiple locations, divisions, or entities. This limitation affects:

  • Generating consolidated reports across multiple business units
  • Providing detailed breakdowns by division or location
  • Comparing performance across different segments of the business

Users face significant challenges when trying to create reports that offer a comprehensive view of their complex business structures, often requiring add-ons or separate instances of QuickBooks Online for each entity.

Lack of Granular Control over User Permissions for Reporting

QuickBooks Online‘s limited permissions framework complicates reporting for businesses with multiple users needing different levels of access. This results in:

  • Difficulties in restricting sensitive financial data
  • Challenges in delegating report creation tasks
  • Inability to customize user access based on roles or departments

These limitations can lead to security concerns and inefficiencies in report distribution and management, especially for businesses with a higher number of users or those requiring strict financial controls.

Addressing QuickBooks Online Reporting Challenges

While QuickBooks Online offers many advantages for small businesses and self-employed individuals, its reporting limitations can be significant for growing companies. To overcome these challenges, businesses can consider the following solutions:

Expand Report Customization Options

To overcome QuickBooks Online’s built-in limitations, businesses can leverage cloud-based solutions like Coefficient that integrate with spreadsheet software, enabling highly customizable reports. With Coefficient, users can:

  • Create tailored reports with advanced filtering and sorting options
  • Design custom layouts and formats without switching between tools
  • Incorporate data from multiple sources into a single report

Automate Data Syncing 

Cloud-based solutions can automate the data import and export process, making it easier to handle large datasets without breaking reports into smaller chunks. This approach:

  • Eliminates the need for manual data entry or exports
  • Reduces the risk of errors associated with manual data handling
  • Allows for real-time data sync from multiple sources

Integrate QuickBooks Online with Other Business Tools

By using Coefficient to integrate QuickBooks Online with other platforms like HubSpot, businesses can gain a deeper understanding of their overall performance and financial health:

  • Combine financial data with sales and marketing metrics for comprehensive insights
  • Automate data syncing to ensure real-time accuracy across all reports
  • Create custom dashboards that blend data from multiple sources for holistic analysis

Evaluate Your Options: When to Consider Alternatives

For businesses that find QuickBooks Online’s limitations too restrictive, it may be worth exploring alternative accounting software options such as Xero or upgrading to QuickBooks Pro or Enterprise solutions. However, this decision should be weighed carefully, considering factors such as:

  • The learning curve associated with new software
  • Pricing plans and monthly subscription costs
  • Scalability and long-term business needs
  • Availability of customer support and resources

Overcoming QuickBooks Accounting Limitations: The Path Forward

While QuickBooks Online offers many benefits for small businesses, its reporting limitations can hinder growth and efficiency for some users. By understanding these challenges and exploring solutions like cloud-based integrations, businesses can significantly enhance their reporting capabilities. 

To overcome these limitations and streamline your business accounting process, consider getting started with Coefficient. With Coefficient’s powerful integration and reporting tools, you can unlock the full potential of your QuickBooks Online data and gain deeper insights into your business performance.

B2B Sales Pipeline Coverage – From Prospect to Profits (Insights from RevOps Expert)

In B2B sales, mastering your pipeline coverage isn’t just important—it’s essential. But with ever-evolving market dynamics and shifting customer behaviors, no two sales cycles are the same.

How can sales leaders navigate these complexities and set their teams up for success?

This guide discusses pipeline coverage best practices to ensure consistent growth by using insights from seasoned RevOps experts Emerson McCuin, Saahil Dhaka, and Cody Kimball.

Let’s dive in.

What is Pipeline Coverage?

At its core, pipeline coverage is a metric that offers a ratio of the total opportunities present in your sales pipeline compared to the sales quota set for a specific time period.

This sales pipeline coverage ratio is often used as a rule of thumb by sales leaders to gauge the health of their pipeline.

A foundational understanding of the pipeline is essential, as it’s “everything you need to know” when evaluating the effectiveness of a sales strategy.

How to Calculate Pipeline Coverage?

The formula for pipeline coverage is: Pipeline Coverage = Total Pipeline / Sales Quota for the Period

Example: If your sales team has a total pipeline value of $320,000 and a quota of $100,000 for the month, the pipeline coverage is 3x.

How to Calculate Sales Pipeline Coverage in Coefficient 

Coefficient’s Pipeline Analysis Dashboard for Google Sheets is your gateway to understanding and optimizing pipeline coverage.

Follow these steps to get started: 

Step 1: Download the template

To start, head to Coefficient.io. Enter your work email in the box and click ‘Get Free Template.’ 

User entering email to receive a free template on Coefficient.io homepage.

You can save the template to your Google account by clicking the ‘Use Template’ button at the top right corner of your screen.

Clicking 'Use Template' button to save the template to Google account.

Your dashboard will open in a new spreadsheet associated with your Google account.

New spreadsheet dashboard opening in Google Sheets for Coefficient.

If this is your first time using Coefficient, you’ll need to add it as an add-on to Google Sheets. Click ‘Add to Sheets’ to continue.

Clicking ‘Add to Sheets’ to integrate Coefficient add-on with Google Sheets.

Hit the ‘Install’ button and follow the prompts to complete the installation.

Installing Coefficient add-on by hitting the ‘Install’ button in Google Sheets.

Step 2: Connect Coefficient to Salesforce

After installation is complete, hit ‘Done’ to return to your spreadsheet. 

Completing Coefficient installation and returning to spreadsheet by hitting ‘Done’.

Click ‘Connect to Salesforce’ from the Coefficient menu on the right-hand side of your spreadsheet. 

Using Coefficient menu to connect to Salesforce account from a spreadsheet.

Follow the prompts to authorize Coefficient to your Salesforce account.

Authorizing Coefficient access to Salesforce account through spreadsheet prompts.

If successful, you’ll see the following notification at the top of your spreadsheet. 

Notification showing successful connection to Salesforce in spreadsheet.

To update your data, navigate to the ‘Salesforce Import’ tab of your spreadsheet and click ‘Refresh.’

Navigating to Salesforce Import tab in spreadsheet to refresh data.

You can also auto-refresh your data by clicking ‘Set Refresh Schedule.’ 

 clicking ‘Set Refresh Schedule.’

Set up an hourly, daily, or weekly auto-refresh schedule, and Coefficient will automatically update your data based on that time interval.

Setting auto-refresh schedule from the Coefficient menu in a spreadsheet.

Set up an hourly, daily, or weekly auto-refresh schedule, and Coefficient will automatically update your data based on that time interval.

Step 3. Customize Your Dashboard

Tailor the template to your organization’s unique needs by navigating to the ‘Settings’ tab. 

Tailor the template to your organization's unique needs by navigating to the 'Settings' tab. 

Company Information 

Customize your company information, pipeline coverage ratios, pipeline stages, and team member details for a more personalized analysis.

Customizing company information on Coefficient's dashboard for personalized analysis.

Personalize your dashboard by including your company’s domain URL, logo, and the start of your fiscal year. This ensures that the data and insights are specific to your organization and aligned with your financial reporting periods.

Pipeline Coverage Ratios 

Fine-tune your pipeline coverage ratios based on your historical win rates. 

Adjusting pipeline coverage ratios based on historical win rates in Coefficient.

These ratios help you determine the number of opportunities needed in your pipeline to meet your sales targets, ensuring that you have a sufficient volume of potential deals to achieve your goals.

Pipeline Stages 

Customize the pipeline stages in the template to mirror those in your Salesforce setup. 

Customizing pipeline stages in Coefficient template to match Salesforce setup.

By aligning the stages in the dashboard with your sales process, you can gain accurate insights into the performance and velocity of your pipeline at each stage.

Team members 

Add details about your sales team members to the dashboard for a more personalized analysis. 

This allows you to track individual performance, identify top performers, and pinpoint areas where team members may need additional support.

With just a few simple customizations, you can transform the Pipeline Analysis Dashboard Template into a powerful tool tailored to your organization’s specific needs. 

Deep Dive: Coefficient’s Sales Pipeline Analysis Templates

Coefficient’s Pipeline Analysis Dashboard provides two powerful dashboards that give you a comprehensive view of your sales pipeline: the Sales Pipeline Analysis dashboard and the Sales to Target dashboard. 

Let’s dive into how these dashboards can help you optimize your sales process and drive revenue growth.

The Sales Pipeline Analysis Dashboard 

View of the Sales Pipeline Analysis dashboard provided by Coefficient for tracking sales metrics.
  • Understand pipeline creation trends: Track the amount of pipeline generated each month and compare it to the previous year’s performance. This allows you to identify growth trends and seasonality in your pipeline generation.
  • Evaluate pipeline conversion effectiveness: Monitor the percentage of pipeline that converts to won deals each month and compare it to the previous year. Use this insight to assess the health of your sales process and identify areas for improvement.
  • Optimize your sales cycle: Keep an eye on the average number of days it takes for a deal to move through your sales cycle each month. This metric, known as sales velocity, helps you identify bottlenecks and optimize your sales process for faster closes.
  • Perform in-depth pipeline analysis: Dive into the granular revenue operations data provided in the table beneath the graphs. This detailed data on pipeline creation, conversion rates, revenue, sales cycle length, deal value, and more allows you to pinpoint specific areas for improvement and take targeted action.

The Sales to Target Dashboard

Overview of the Sales to Target dashboard in Coefficient highlighting goal progress.
  • Monitor performance against targets: Quickly see how you’re performing against your targets for key metrics like revenue, new business, existing business, and team-level performance. This at-a-glance view helps you stay on track and identify areas that need attention.
  • Identify the sales gap: Compare your actual sales performance to your targets and see the gap between the two. This insight helps you prioritize efforts to close the gap and hit your goals.
  • Ensure sufficient pipeline coverage: Check if you have enough open pipeline to meet your targets. The “Gap Analysis” section shows you the difference between your current open pipeline and the amount needed to reach your goals, informing your prospecting efforts.
  • Monitor closed won deals: Track your progress towards hitting revenue goals by keeping an eye on the amount of closed won business each month compared to your targets. This graph helps you identify trends and make data-driven decisions.
  • Analyze pipeline composition: See how your open pipeline is distributed across each stage of your sales process. This breakdown helps you identify where deals are getting stuck, so you can allocate resources effectively and improve your forecasting accuracy.

What is the Ideal Pipeline Coverage Ratio for B2B?

While there’s no one-size-fits-all answer, the overarching goal is predictability. Sales managers and leaders aim for a figure that ensures consistent achievement of revenue goals every sales cycle.

Effective pipeline management is the cornerstone of accurate sales forecasting, allowing for strategic adjustments to ensure sales goals are consistently met.

What is 3x Pipeline Coverage or 4x Pipeline Coverage?

A 3x pipeline coverage ratio indicates that the total value of opportunities in the pipeline is three times the sales quota, while a 4x pipeline coverage suggests that the total value is four times the sales quota.

Understanding pipeline coverage goes beyond these benchmarks. It’s about recognizing the nuances and intricacies of the sales cycle.

How Does Pipeline Coverage Influence Our Sales and Forecasting Strategies?

Effective pipeline management is foundational for accurate forecasting. It’s about gauging where you stand in relation to your sales goals. By being vigilant about sales forecasts, strategies can be quickly adjusted to ensure revenue targets are achieved.

How to Track Sales Pipeline Coverage Accurately?

Sales Pipeline Coverage Templates

Monitoring pipeline coverage accurately requires the integration of robust tools such as HubSpot and Coefficient. These platforms help salespeople bridge gaps in their reporting, track pipeline metrics accurately and consistently, ensuring everything you need to know is at your fingertips.

Checkout Coefficient’s free Sales Pipeline template!

5 Common Missteps in B2B Pipeline Management

1. Over-Reliance on a Few Big Deals

In B2B sales, it’s tempting to focus on a handful of high-value deals, thinking they’ll be the ticket to meeting quotas. However, this strategy can be a double-edged sword.

While big deals can significantly boost revenue, putting all your eggs in one basket can jeopardize predictability. It’s essential to diversify the pipeline with various deal sizes, ensuring a more stable and predictable sales outcome.

2. Sales and Marketing Misalignment

A common pitfall in many organizations is the disconnect between marketing teams and sales teams. Each department might be operating with different objectives, leading to disjointed efforts and missed opportunities.

To ensure a seamless sales process, it’s crucial for both teams to have aligned goals, collaborate closely, and share insights. This alignment can bridge the gap and drive more cohesive pipeline management strategies.

3. Poor CRM Hygiene

A sales pipeline management tool or CRM, like Salesforce, is the backbone of effective pipeline management. However, its efficacy diminishes if not regularly updated. Outdated or incorrect data can lead to missed opportunities and misinformed strategies.

To maximize the benefits of a CRM, sales reps should be diligent in maintaining its hygiene, ensuring that all data is current and accurate.

4. Inconsistent Follow-Ups

The importance of consistent communication in sales cannot be overstated. Without a structured follow-up process, potential clients might slip through the cracks, leading to missed opportunities or even a loss of trust.

Implementing a consistent follow-up schedule, aided by CRM reminders, can ensure timely communication, nurturing leads towards becoming closed deals.

5. No Lead Nurturing

Focusing solely on leads that appear ready to buy can be a short-sighted approach. Many qualified leads might need more time, information, or persuasion before they’re ready to commit.

 Neglecting these leads means potentially losing out on deals that, with a bit more effort, could have been sealed. A robust lead nurturing strategy, involving regular check-ins and content sharing, can warm up these leads, increasing their likelihood to convert.

6. Over-Optimism

Setting ambitious sales targets can be motivating for sales reps. However, being overly optimistic can backfire. If sales targets are consistently unrealistic and unmet, it can demoralize the sales team and skew pipeline management strategies.

It’s essential to set realistic targets based on past performance, market conditions, and current capabilities, ensuring that they’re both challenging and achievable.

9 Strategies to Boost Pipeline Coverage in B2B Sales

Our experts recommend a combination of lead generation and enablement tactics to enable optimal sales efficiencies. The importance of automation and pricing adjustments is also highlighted, along with an emphasis on refining the sales process and improving conversion rates.

Let’s dive into each.

1. Enhanced Prospecting

To effectively reach the right audience, it’s essential to harness the power of intent data. Engaging in social selling, employing lead scoring, and utilizing targeted remarketing can further refine your prospecting efforts, ensuring you’re connecting with potential clients who are genuinely interested.

2. Referrals: Building Trust through Existing Connections

Referrals are a goldmine in B2B sales. By leveraging satisfied customers and partners, you can expand your network and tap into high-quality leads that come with an inherent level of trust.

3. Affiliate Programs & Partnerships: Collaborating for Growth

Establishing meaningful partnerships, especially with consultants, can open doors to new opportunities. By leveraging their networks and expertise, you can amplify your reach and tap into new customer bases.

4. Cross-Selling and Upselling: Maximizing Existing Relationships

Your existing customer base is a treasure trove of opportunities. By identifying areas for cross-selling and upselling, you can not only increase your sales quota but also solidify and deepen your relationships with clients.

5. New Market Expansion: Diversifying Sales Territories

Expanding into new regions or industries can be a strategic move to diversify your sales territories. This approach not only spreads risk but also uncovers fresh revenue streams, ensuring sustained growth.

6. Channel Experimentation: Broadening Sales Strategies

Diversifying your sales strategies can lead to unexpected success. If you’ve been primarily focused on either inbound or outbound tactics, consider blending the two. This hybrid approach can reach a broader audience and bring in diverse leads.

7. Better Sales Training: Investing in Your Salespeople

Your sales team is only as good as their training. By equipping them with the latest strategies, tools, and insights, you’re investing in their success, boosting your company’s performance.

8. Improving Sales Enablement: Streamlining the Sales Process

A well-equipped sales team is a successful one. Streamlining the sales process by providing your team with the necessary resources, tools, and information ensures they can close deals efficiently and effectively.

9. Thought Leadership: Establishing Market Authority

Positioning your brand as a thought leader can set you apart in a crowded market. Collaborate with recognized industry entities like Forrester, G2, and McKinsey to bolster your brand’s authority and trustworthiness.

Weighted vs. Unweighted Sales Pipeline

Both the weighted and unweighted sales pipelines are crucial metrics that businesses use to predict future sales and revenue. However, they approach this prediction from different perspectives.

By comparing the unweighted and weighted sales pipelines, businesses can gain insights into the quality of their leads and the effectiveness of their sales strategy. The disparity between the two values can also shed light on potential challenges in the sales cycle and areas for improvement.

How is the Unweighted Sales Pipeline Calculated?

An unweighted sales pipeline simply adds up the value of all deals in the pipeline, irrespective of their stage or likelihood of closing.

  1. List all active deals: Begin by listing out all the deals currently in your pipeline.
  2. Assign a value to each deal: This is typically the potential revenue from each deal.
  3. Sum up the values: Add together the values of all the deals.

Example:

  • Deal A is worth $10,000
  • Deal B is worth $15,000
  • Deal C is worth $5,000

Unweighted Sales Pipeline = Deal A + Deal B + Deal C = $30,000

How is the Weighted Sales Pipeline Calculated?

The weighted sales pipeline takes into account the stage of each deal and assigns a probability to each stage. This provides a more realistic view of the potential revenue, as not all deals will close.

  1. List all active deals: As with the unweighted pipeline, start by listing all deals.
  2. Assign a value to each deal: Determine the potential revenue from each deal.
  3. Assign a closing probability to each deal: Based on the deal’s stage in the sales funnel. For instance, a deal in the “Prospect” stage might have a 10% chance of closing, while one in the “Negotiation” stage might have an 80% chance.
  4. Multiply the deal value by its closing probability: This gives you the weighted value of each deal.
  5. Sum up the weighted values: Add together the weighted values of all the deals.

Example:

  • Deal A is worth $10,000 and is in the “Prospect” stage with a 10% closing probability. Weighted value = $10,000 * 0.10 = $1,000
  • Deal B is worth $15,000 and is in the “Negotiation” stage with an 80% closing probability. Weighted value = $15,000 * 0.80 = $12,000
  • Deal C is worth $5,000 and is in the “Proposal” stage with a 50% closing probability. Weighted value = $5,000 * 0.50 = $2,500

Weighted Sales Pipeline = $1,000 + $12,000 + $2,500 = $15,500

Master Pipeline Coverage for Predictable Sales

By following the pipeline coverage best practices outlined in this guide, businesses can ensure a more streamlined, efficient, and effective sales process. These strategies not only provide clarity on the journey from prospect to profit but also make it more predictable and manageable.

Try Coefficient for free today to see how it can streamline your pipeline coverage analyses and more.

About the Experts

Emerson McCuin, RevOps Manager at HAAS Alert: 

Emerson is a seasoned RevOps professional with a passion for CRM and automation tools like HubSpot. With a keen focus on collaborating with GTM leaders, Emerson’s expertise lies in strategizing around goals, KPIs, and action plans. He’s an active member of the RevOps community, sharing insights and knowledge to elevate businesses by optimizing expenses and costs and maximizing revenue. (LinkedIn)

Saahil Dhaka, Founder and CEO, Clientell:

Saahil is an entrepreneur dedicated to helping business leaders harness the power of machine learning for smarter decision-making. With a background spanning startups to AI in sales, he offers a scientific approach to sales processes and pipeline management. Saahil is passionate about crafting competitive GTM strategies that give revenue teams an edge. (LinkedIn)

Cody Kimball, RevOps and GTM Leader, Entrata: 

With over a decade of experience in data and technology, Cody is a corporate development leader specializing in analytics, operations optimization, and preparing organizations for enterprise growth. He’s adept at aligning organizations with business processes backed by relevant KPIs. Cody’s strengths encompass data analytics, leadership, and brand cultivation. He’s known for bridging the gap between technical and business aspects, ensuring seamless integration of technology, strategy, and operations. You can tap on his skills at getthedataguy.com (LinkedIn)

How to Fix Zero Values When Exporting QuickBooks Online Reports to Excel

QuickBooks Online (QBO) from Intuit is cloud accounting software used by many business owners. QuickBooks Online allows you to export reports directly from their platform into Excel so you can manipulate or analyze the report data.

One common issue when exporting reports to Excel is that zero values will appear in your Excel file. This issue can lead to extensive troubleshooting steps to determine why your Excel reports are displaying zero values.

This guide will walk through how to run and create QuickBooks export files and provide workarounds for common issues that cause zero values in your workbook.

Let’s get started!

TLDR

  • Step 1:

    Check for the Top 5 potential issues

  • Step 2:

    Potential Issue 1: Protected view settings. If this issue occurs, you’ll see an “Enable editing” button at the top of your Excel file. Click this button to resolve the issue.

  • Step 3:

    Potential Issue 2: Excel version compatibility. To check whether you need to update your version of Excel, navigate to File > Account.

  • Step 4:

    Potential Issue 3: Browser cache and cookies To check for this issue, navigate to the settings section of your web browser and modify site permissions.

  • Step 5:

    Potential Issue 4: Excel calculation settings. To check if your Excel is set to manually calculate formulas, you will want to navigate to the formulas section at the top of your Excel file. Use Ctrl + Alt + F5 to refresh your worksheet and totals if needed.

  • Step 6:

    Potential Issue 5: Out-of-date browsers. If you have already gone through troubleshooting other common issues and it hasn’t fixed your Excel export try switching your web browser.

Step-by-Step Guide: Exporting QBO Reports to Excel

Step 1: Navigate to the Reports Section in QBO

Within QBO navigate to the reports section in the menu section. This process works across platforms, including Mac and Quickbooks Enterprise systems. Use the drop-down menu to access report options.

quickbooks reports section

Step 2: Select the Report to Run

Before diving into solutions, it’s important to understand that QuickBooks Online can generate various types of reports, including:

  • Profit and Loss statements
  • Balance sheet reports
  • Accounts Receivable Aging
  • Accounts Payable Aging
  • Custom reports

These reports can be exported to different formats, including Excel files, CSV files, and PDFs. While QuickBooks Desktop users might have different experiences, this guide focuses specifically on QBO exports.

In this example, we are going to select the Profit and Loss report to run.

run report to test zero values

Once you’ve selected your QuickBooks report and filled out the relevant data (date range, columns displayed, cash vs accrual method, etc.), you can export your reports to Excel. Click the export dropdown at the top of your report and select export to Excel.

export quickbooks to excel to test zero values

Common Issues and Solutions

Potential Issue 1: Check Protected View Settings

The first issue you may encounter when exporting reports to Excel is that the Excel file is in protected view. If this occurs, you’ll see an “Enable editing” button at the top of your Excel file. Clicking this button should resolve the issue and display values in your QuickBooks export.

This is the most common issue, and most reports you export from QuickBooks Online will have this protection enabled.

protected view in excel blocking zero values

Potential Issue 2: Excel Version Compatibility

Another common issue when exporting a report from QuickBooks Online to Excel is an outdated version of Excel. Depending on your Microsoft Excel version, you may need to upgrade for compatibility with QBO’s export capabilities.

To check whether you need to update your version of Excel, navigate to File > Account.

quickbooks account in navigation

Select update options dropdown and click “Update Now.” Press Ctrl + F5 to refresh if needed.

excel version compatibility to support zero values

Once you’ve selected update now Excel will let you know that you have been updated to the most recent version of Excel, which should fix the zero values export issue out of QuickBooks Online.

Potential Issue 3: Browser Cache and Cookies

A third potential issue is that your browser cache and cookies may be interfering with and not allowing you to export Excel reports out of QuickBooks Online. To check if that is the issue you will want to navigate to the settings section of the web browser you are using. In this example we are using Google Chrome or Firefox as our web browser.

First navigate to the setting section, which is in the dropdown in the top right corner of the browser.

browser settings to support quickbooks zero values in excel

Once you’ve selected settings there is a cookies and site permissions section that you will need to select.

check browser settings blocking quickbooks import

In the cookies and site permissions section you can then clear any cookies and modify site permissions to allow exports out of Quickbooks with values instead of zero value reports.

Potential Issue 4: Excel Calculation Settings

Another potential issue that may be causing your Excel report out of QuickBooks Online to be zero values is the calculation settings set-up in your workbook. Excel has the option to either manually or automatically calculate formulas.

To check if your Excel is set to manually calculate formulas, you will want to navigate to the formulas section at the top of your Excel file. Use Ctrl + Alt + F5 to refresh your worksheet and totals if needed.

excel calcualation settings blocking zero values

In the formulas section you will then need to select the calculation options dropdown in the far right side of the formulas section. In this dropdown you will see a checkbox by which calculation option your Excel file is currently set-up as.

If your file is set-up to manually or partially calculate, you will want to switch the calculation method to automatic.

automatic calculations in excel

Potential Issue 5: Out-of-Date Browsers

The web browser you are using Quickbooks Online on may also be causing the export zero values issue in Excel. Most of the common web browsers support exporting Excel files out of Quickbooks Online, if you have already gone through troubleshooting other common issues and it hasn’t fixed your Excel export try switching your web browser.

Improve Your Excel Reporting out of Quickbooks Online

Running into zero values or other issues in your Excel reporting out of Quickbooks Online can be frustrating and cause a lot of troubleshooting for you and your organization. This can be a waste of both time and resources on non value-add work for you and your team.

One solution to this issue is to use a tool that integrates with Excel to help alleviate some of the issues that you can run into exporting Quickbooks Online reports out of Excel. One such tool is Coefficient, which is a data connector and can seamlessly pull information out of Quickbooks Online. Coefficient also enhances your reporting capabilities out of Quickbooks Online so you are less reliant on the standard reporting out of the system.

Ready to take your data analysis to the next level?

Try Coefficient to seamlessly integrate your Excel with live data from various business systems, enabling real-time analysis and more advanced financial modeling.

How to do Job Costing in Quickbooks Online?

QuickBooks Online (QBO) from Intuit is cloud-based accounting software trusted by business owners and CPAs. As a complete accounting system, QBO offers powerful job costing capabilities that help track expenses and revenue for each specific job.

Job costing is a bookkeeping method that assigns costs to specific jobs or work orders. This feature helps organizations analyze their finances at a granular level and understand what each particular job is costing them, leading to more informed business decisions.

Before Getting Started

To do job costing in QuickBooks Online, you’ll first need these key pieces of information in your QBO instance:

  • Labor costs – Track hours worked on a particular job to calculate wage expenses
  • Material costs – Record dollars spent on materials for each individual job
  • Overhead costs – Track expenses not directly tied to production, such as rent, insurance, and utilities

Step-by-Step Guide: Job Costing in QBO

Step 1: Enable Job Costing

Within QBO, navigate to the gearbox in the top right of your screen to open settings.

QuickBooks Online settings gear icon location in top-right corner of dashboard

Click the gearbox to see a drop-down menu. Select ‘Account and Settings’ under Your Company.

QuickBooks Online account and settings menu under company settings

In the Sales section, turn on Custom Transaction Numbers.

 Enabling custom transaction numbers in QuickBooks Online sales settings

In the Expenses section, enable ‘Track expenses and items by customer’.

QuickBooks Online customers section in main sales menu

Step 2: Add Customers / Projects

In order to calculate job costs by customer and project, you will need to add the corresponding customer and project in QuickBooks.

To add a customer, navigate to the sales section of the menu and select customers.

New customer button located in top-right corner of QuickBooks Online

Select ‘New Customer’ in the top right corner.

Customer information input form with contact and payment fields

You will then be prompted to fill in your customer’s information, including name and contact, address, payment method, tax information, etc.

Project module selection in QuickBooks Online main dropdown menu

Once you’ve set up your customer, you can set-up your project. The project module is in the main drown-down menu.

Project setup screen showing customer, email, and date fields

Once you’ve selected the project you will be prompted to add the project name, customer that you just set-up, email, and then the start and end date.

Creating new estimate using plus button in QuickBooks Online homepage

Step 3: Add Job Estimate

Now that you’ve got your customer and project set-up you can create an estimate for the job. This will allow you to add quotes from vendors and track how well you are performing against that estimate as actual expenses come in for that job.

To add an estimate for the job you click the + New button on the QBO homepage and select estimate under the customers column.

Estimate module with vendor details and payment options fields

Once in the estimate module you will have multiple fields to fill out including the customer, notes from the vendor, copy of a quote, dates, scheduling, payment options, and many more.

Customer and project selection dropdown in estimates screen

Once you’ve filled out the relevant information in the estimate module for your vendor and project, you can assign the estimate to the project/job previously created.

To do this you have to select the correct customer/project within the add customer dropdown on the estimates screen.

Vendor invoice processing screen with project assignment options

Once you’ve added the customer and project you can get more granular and provide additional details on what that vendor is doing as a part of this project. You can select if they are performing services or providing products & services, and add the corresponding cost associated with those goods or services.

Step 4: Vendor Invoicing

Now that your customer, particular job, and estimate are set-up in QBO, the invoicing process will provide actual costs and revenue information for accurate job costing. This is especially important for construction companies managing multiple construction projects.

On the vendor side, you receive invoices that you’ll match against the corresponding project. As you process credit card transactions or vendor invoices, assign the customer and project from steps 1 and 2 to each transaction.

This track expenses feature ensures each expense pulls through into your job costing reports and helps monitor project costs in real-time.

New invoice creation screen with products and services options

Step 5: Customer Invoicing

While processing vendor invoices, you’ll need to create invoices for your customers. The method and frequency depend on your contractual terms and agreed billing method.

For construction accounting, some clients prefer progressive billable hours tracking, while others want a single invoice upon project completion. Always refer to your agreement for proper invoicing terms.

To create an invoice from your estimated costs:

  1. Select the + New button in the main menu
  2. Choose invoice under the customers column
  3. Import your previous estimate into the invoice module
  4. Add your products & services
Importing previous estimate into invoice module screen

Once you’ve added the estimate, you can adjust as needed. If scope changes occur, you may need to modify costs or add services before sending. This flexibility helps maintain accurate project profitability tracking.

Invoice modification screen showing cost and service adjustments

Once you’ve added the estimate to your invoice you can make any necessary changes to the estimate you need to. If there was a change in scope from the initial estimate you may need to add incremental cost or an additional service/product to your invoice before sending it.

 QuickBooks Online reports section navigation menu

Step 6: Job Cost Reporting

As you invoice your customers and receive invoices from your vendors you will be able to do job costing reports out of QBO to see the profitability and profit margin of each particular job. In order to do this you will want to navigate to the reports section in QBO.

Profit and Loss report customization screen with filters

Once in the reports module you can select the financial reports and Profit and Loss Report and then select customize in the top right corner of the report.

Image5

Once in the customize section you will be able to select that particular job and project within the customer filter. This will allow you to pull in all of the corresponding revenue and actual costs associated with that specific job during the time period you’ve specified.

Job cost reporting screen with time period and project filters

After you’ve done this you are able to do job cost reporting that can be shared in real-time with stakeholders throughout your organization.

Use Cases for Job Costing in QuickBooks Online

Job costing provides valuable insights for business owners and CPAs using this accounting system. It helps:

  • Distribute real-time information to stakeholders tracking multiple projects
  • Track costs and revenue precisely, especially useful for construction business operations
  • Monitor project profitability across different customer segments
  • Integrate with timesheets for accurate labor costs tracking
  • Generate detailed job costing reports for better business decisions
  • Improve cash flow management and project planning
  • Support comprehensive construction accounting needs
  • Monitor actual costs against estimated costs
  • Maintain accurate profit margin calculations
  • Enable precise time tracking for billable hours

Improve Your Job Costing

Job costing is a very important tool for business planning and decision making. It can help an organization look at their financials at a more granular level to see which jobs, projects, or customers are more profitable than others. It can also help organizations estimate more accurately to improve pricing and reduce the variance in estimates to customers. By following this guide, you will be able to do job costing across all of the jobs/projects your organization performs.

Ready to take your data analysis to the next level?

Try Coefficient to seamlessly integrate your Excel with live data from various business systems, enabling real-time analysis and more advanced financial modeling.

How to Automate QuickBooks

QuickBooks Online (QBO) from Intuit is cloud-based accounting software that helps small business owners manage their finances. By implementing automation in QBO, you can eliminate manual data entry, reduce human error, and focus on growing your business.

This guide walks through five practical ways to automate your accounting processes in QuickBooks Online, from basic features to advanced integrations.

Built-in Automation Features in QuickBooks Online

QBO includes several automation options within its core functionality. These built-in features offer cost-effective solutions for small businesses looking to reduce manual work. You can also connect additional apps to enhance your automation capabilities for tasks like payroll, timekeeping, accounts payable, and invoicing.

QuickBooks Online (QBO) from Intuit is cloud accounting software used by many business owners. QuickBooks Online allows accountants to do job costing within their software.

Automation 1: Payroll

To search for apps that QuickBooks Online may already have a pre-built connection with, navigate to the nine dots in the top right of your QBO home page.

QuickBooks Online apps menu accessed through nine dots in top-right corner

Once you’ve opened that prompt, select “go to apps overview” to review applications that integrate with QuickBooks Online. On this page, you can search for whatever application you want to connect.

If you’re using QBO and don’t yet have a payroll, invoicing, timekeeping, or other system, first check if QuickBooks Online has an existing connection with that application.

QuickBooks Online apps overview page showing integration options

In this example, we searched and selected Gusto, which is a payroll and human resources application. After selecting Gusto, choose “get the app now” to connect it to your QBO instance.

For existing users, you’ll need to provide login credentials and other relevant information such as general ledger coding and data you want to import into QuickBooks Online.

Gusto payroll app integration setup screen in QuickBooks Online

The more apps you have that integrate with QBO, the more you can automate.

In the Gusto example, any payroll you process will automatically pull into QuickBooks Online and code to the correct account based on your business rules.

Automation 2: Accounts Receivable / Invoicing

Automating your accounts receivable and invoicing processes can be extremely beneficial, especially for recurring invoices every month.

One way to automate your accounts receivable process is to automatically send out invoices to subscribers. This works particularly well for subscription models where the QuickBooks invoice goes out the same day each month.

To set this up:

  1. Navigate to the “+ New” button on the top left of your QBO home page
  2. Select the invoice module under the customer column
Creating new invoice using plus button in QuickBooks Online homepage

Once you’ve navigated to the invoice page and filled out the relevant customer and invoice information, you can set-up the invoice as recurring the scheduling drop-down. This creates automated workflow for regular billing.

Setting up recurring invoice schedule in QuickBooks Online

Within the accounts receivable/invoicing process another area that can be automated is the past due invoice reminders for customers. This is helpful to improve your company’s cash flow and get paid by customers on time.

In order to automate the past due reminders to customers you first navigate to the settings gearbox in the top right corner of QuickBooks Online and select account and settings under the your company column.

Image5

Once in account and settings you can select the edit button in reminders under the sales section.

QuickBooks Online settings menu accessed through gear icon

Then, toggle the automatic invoice reminders option. You will have the option to customize when you would like the past-due reminders to be sent out. You can select before the invoice due date, on the invoice due date, after the invoice due date, or a combination of all three. It may be helpful to send a reminder before the due date so customers to have ample time to process the invoice through their accounts payable system and bank.

Invoice reminders settings under sales section in QuickBooks

Automation 3: Financial Reporting

QuickBooks Online houses a plethora of reports that you can send to internal and external stakeholders.

A lot of times, businesses send out monthly, quarterly, or annual reports on a regular, scheduled basis. Instead of logging in and running each report everytime you need to send it, you can automate reports being sent directly out of QuickBooks Online.

To automate sending a report out of QuickBooks Online you first must navigate to the report section of the menu.

Configuring automatic invoice reminder options and timing

Once in the reports menu, you can select the report or reports that you would like to send out automatically. In this example, I’ve selected the profit and loss report and then hit customize.

QuickBooks Online reports menu navigation screen

Once in the customize report screen, adjust your time period and formatting to match your reporting needs. This creates near real-time access to financial data.

Profit and Loss report customization screen with time period options

,

Once you’ve customized your report to your liking, you can navigate back to the reports list and select the custom report you created.

Custom reports list showing available report templates

Next, select Edit in the action column for that particular report and toggle the set email schedule on.

Setting up automated email schedule for recurring reports

Once toggled on you can set the recurrence, end date, recipients, subject, and message that are sent out on a recurring basis.

You will want to make sure you give yourself ample time to record all transactions in a timely manner before scheduling the report to be sent out. For example, if your month-end close process is typically 5 days, you will want to wait until at least day 6 to automatically send out the report.

Report email configuration screen with recipient and timing options

Automation 4: Accounts Payable

Along with the accounts receivable/invoicing process, the accounts payable and bill payment process can also be automated within QuickBooks Online. This helps ensure timely invoice payments for your routine vendors and eliminates manual data entry in your accounting processes.

To automate a recurring bill in QBO, first navigate to the expenses and bills section of the menu.

QuickBooks Online expenses and bills menu navigation

Once in the bills module, select the create recurring bill option in the add bill dropdown.

Creating recurring bill template in QuickBooks Online

After selecting the recurring bill option, build out the bill with vendor and payment information. You’ll need to:

  1. Name the template
  2. Choose the vendor for payment
  3. Set up payment frequency
  4. Define start and end dates

This workflow automation is particularly helpful when setting up recurring bills for vendors with specific contract periods. The end date feature automatically stops payments when the contract ends, reducing human error in vendor management.

Next, categorize how you want the recurring bill coded in your general ledger by selecting the expense category and adding a description. This supports accurate bookkeeping and financial reporting.

General ledger coding screen for recurring bill setup

Beyond recurring bills, you can also:

  • Create reminders for non-regular invoices
  • Set up automated workflows for purchase orders
  • Manage credit card payments
  • Track vendor expenses in real-time

To set up automatic reminders in your QuickBooks Online account for upcoming bills, select “reminder” as the type instead of “scheduled.” This allows your team to review and adjust amounts or dates as needed.

Setting up bill payment reminders in QuickBooks Online

You can also automate the template creation and set it to unscheduled in the type dropdown. This is useful for infrequent vendor payments, saving less time on repetitive setup tasks.

Automation 5: Transaction Matching

Small business owners often receive transactions from regular vendors that need consistent general ledger coding. Instead of manually matching transactions from recurring vendors, you can set up automatic matching in QuickBooks Online.

This process automation reduces manual touches and helps your bookkeeping team work more efficiently.

To automatically match transactions:

  1. Navigate to the transactions section of the menu
  2. Select the rules header
Transaction rules setup screen for automated matching

In the rules header, click the new rule button. This opens the create rule prompt where you’ll:

  1. Name the rule
  2. Define applicable transaction types
  3. Set up assignment criteria
  4. Specify coding preferences

For regular vendor invoices, set up the rule as a money out transaction with the corresponding description. This automation helps maintain consistent accounting processes across your business.

Next, configure your transaction coding preferences, including:

  • Transaction type
  • Expense category
  • Payee information
  • Cash flow tracking

Test each rule thoroughly before activation. Once set up, transactions matching your criteria will automatically code as they enter your QBO system, supporting efficient accounting tasks and accurate financial reporting.


Configuring automated transaction matching rules

You can create multiple rules for both deposits and withdrawals, and adjust existing rules as your business needs change. This flexibility ensures your automated workflows evolve with your growing business while maintaining accurate transaction categorization in your QuickBooks Online instance.

Automate QuickBooks and Combine with All Your Business Data

While manual exports work well for occasional use, businesses that require frequent data updates or real-time reporting can benefit from using Coefficient.

Coefficient is a powerful tool that integrates seamlessly with QuickBooks, allowing for effortless and automated data exports to spreadsheets like Google Sheets and Microsoft Excel.

Key benefits of using Coefficient for QuickBooks exports:

  • Real-time data syncing
  • Automated scheduled refreshes
  • Custom data transformations
  • Advanced filtering and sorting capabilities

Watch this video to see how Coefficient simplifies the process of connecting QuickBooks to your spreadsheets:

Use Cases for Automation in QuickBooks Online

Automating processes within QBO helps businesses:

  • Eliminate manual data entry and human error
  • Create more efficient accounting processes
  • Generate accurate reports for stakeholders
  • Improve cash flow management
  • Save valuable time on routine tasks

Improve QuickBooks Online with Automation

Automation helps organizations reduce costs and improve efficiency. It allows your team to focus on strategic work instead of routine accounting tasks. By implementing these automated workflows, you’ll streamline your QuickBooks Online processes significantly.

Ready to take your data analysis further? Try Coefficient to seamlessly integrate your Excel and Google Sheets with live data from QuickBooks Online, enabling real-time analysis and advanced financial modeling. Get started with Coefficient today.

How to Build a Dashboard in QuickBooks (2026 Update)

Building effective dashboards in QuickBooks helps you track your business’s financial health and make better decisions. This comprehensive guide walks you through creating and customizing QuickBooks dashboards to get the insights you need.

Common QuickBooks Report Types

QuickBooks includes several built-in reports to help you track different aspects of your business. Here are the key report types and how to use them effectively:

Financial Reports

Profit & Loss (Income Statement)

Shows your revenue, costs, and expenses over time to help you understand profitability.

Key information:

  • Total income
  • Cost of goods sold
  • Operating expenses
  • Net profit/loss

Best for: Monthly, quarterly, and annual performance review

Balance Sheet

Provides a snapshot of your business assets, liabilities, and equity at a specific point in time.

Key information:

  • Current assets and liabilities
  • Long-term assets and debts
  • Owner’s equity
  • Account balances

Best for: Understanding your overall financial position

Statement of Cash Flows

Tracks how money moves in and out of your business through operating, investing, and financing activities.

Key information:

  • Operating cash flow
  • Investment spending
  • Financing activities
  • Net cash position

Best for: Cash flow management and planning

Sales & Customer Reports

Sales by Customer Summary

Shows total sales by customer over a specific period.

Key information:

  • Sales by customer
  • Payment history
  • Sales trends
  • Customer rankings

Best for: Customer relationship management and sales analysis

Accounts Receivable Aging

Groups unpaid customer invoices by how long they’ve been outstanding.

Key information:

  • Current amounts due
  • Overdue payments (30/60/90 days)
  • Collection priorities
  • Customer payment patterns

Best for: Managing collections and cash flow

Vendor & Purchasing Reports

Accounts Payable Aging

Lists unpaid bills grouped by due date.

Key information:

  • Current bills due
  • Overdue payments
  • Vendor payment history
  • Payment priorities

Best for: Managing vendor payments and cash outflow

Vendor Balance Summary

Shows amounts owed to each vendor and payment history.

Key information:

  • Total owed by vendor
  • Payment history
  • Outstanding bills
  • Vendor spending trends

Best for: Vendor relationship management

Inventory Reports

Inventory Valuation Summary

Shows the value and quantity of items in stock.

Key information:

  • Current stock levels
  • Item costs
  • Total inventory value
  • Stock movement

Best for: Inventory management and ordering

Stock Status

Lists items that need reordering based on set reorder points.

Key information:

  • Low stock alerts
  • Reorder points
  • Quantity on hand
  • Recent sales history

Best for: Purchase planning and stock management

Exporting Reports From QuickBooks

While QuickBooks offers robust reporting capabilities, many businesses find it beneficial to export their data for further analysis or custom reporting. Here’s how you can export reports from QuickBooks:

Different export options

QuickBooks allows you to export reports in various formats, including:

  1. CSV (Comma-Separated Values): This format is ideal for importing data into spreadsheet applications or other data analysis tools.
  2. XLSX (Excel Spreadsheet): This format is perfect for users who prefer working with Microsoft Excel for further analysis and visualization.
  3. PDF: This format is perfect for sharing with stakeholders.

How to export a report from QuickBooks

  1. Open the desired report in QuickBooks
  2. Click on the “Export” button
  3. Choose your preferred format (CSV or XLSX)
  4. Select a location to save the exported file

While manual exports work well for occasional use, businesses that require frequent data updates or real-time reporting can benefit from using Coefficient.

Coefficient is a powerful tool that integrates seamlessly with QuickBooks, allowing for effortless and automated data exports to spreadsheets like Google Sheets and Microsoft Excel.

Key benefits of using Coefficient for QuickBooks exports:

  • Real-time data syncing
  • Automated scheduled refreshes
  • Custom data transformations
  • Advanced filtering and sorting capabilities

Watch this video to see how Coefficient simplifies the process of connecting QuickBooks to your spreadsheets:

How to Build a Custom Report in QuickBooks

Creating custom reports in QuickBooks allows you to tailor your financial data to your specific business needs. Here’s a step-by-step guide to building a custom report in QuickBooks:

  1. Access the Reports Center:
    • Go to the Reports menu in QuickBooks
    • Select “Custom Reports” or “Customization”
  2. Choose a Report Type:
    • Select the base report type you want to customize (e.g., Profit and Loss, Balance Sheet, Sales by Customer)
  3. Set the Date Range:
    • Choose the time period for your report (e.g., This Month, Last Quarter, Custom Range)
  4. Customize Columns:
    • Add or remove columns to display the specific data points you need
    • Rearrange columns by dragging and dropping
  5. Apply Filters:
    • Use filters to focus on specific data subsets (e.g., particular customers, products, or accounts)
  6. Adjust Display Settings:
    • Modify how data is grouped or sorted
    • Choose to show or hide subtotals and totals
  7. Format the Report:
    • Customize fonts, colors, and header/footer information
    • Add your company logo if desired
  8. Save and Name Your Custom Report:
    • Give your report a descriptive name
    • Save it for future use
  9. Schedule Regular Runs (optional):
    • Set up automatic generation and email delivery of your custom report

Building Advanced Reports & Dashboards in QuickBooks

Let’s walk through creating a cash flow projection report that combines accounts receivable, accounts payable, and historical payment patterns. This type of report helps predict your future cash position.

Creating a Cash Flow Projection Report

Step 1: Gather Required Base Reports

First, you’ll need to pull several reports to get the necessary data:

  1. Accounts Receivable Aging Detail
    • Go to Reports > All Reports > Accounts Receivable
    • Select “A/R Aging Detail”
    • Customize date range to include all open invoices
    • Add columns: Due Date, Days Open
    • Sort by: Customer, then Due Date
  2. Accounts Payable Aging Detail
    • Go to Reports > All Reports > Accounts Payable
    • Select “A/P Aging Detail”
    • Add all open bills
    • Add columns: Due Date, Terms
    • Sort by: Due Date
  3. Payment History Report
    • Go to Reports > Custom Reports
    • Select “Transaction List by Customer”
    • Filter for: Received Payments only
    • Add columns: Original Invoice Date, Payment Date
    • Date Range: Last 6 months

Step 2: Calculate Historical Payment Patterns

Since QuickBooks doesn’t automatically calculate this, you’ll need to:

  1. Export Payment History to Excel
    • Click Export on the Payment History report
    • Choose Excel format
    • In Excel, calculate:
      • Average days to pay per customer
      • Payment probability by aging bucket
      • Historical collection rate
  2. Create Aging Buckets
    • Current
    • 1-30 days
    • 31-60 days
    • 61-90 days
    • Over 90 days

Step 3: Project Expected Cash Inflows

  1. For Each A/R Aging Bucket:
    • Export A/R Aging Detail to Excel
    • Sort by due date
    • Apply historical collection rates
    • Group by expected payment week
    • Sum projected collections
  2. Adjust for Known Variations:
    • Large customer payments
    • Seasonal patterns
    • Payment term changes

Step 4: Project Expected Cash Outflows

  1. From A/P Aging Report:
    • Export to Excel
    • Group bills by due date
    • Add known recurring payments:
      • Rent
      • Utilities
      • Payroll
      • Loan payments
  2. Add Planned Expenditures:
    • Upcoming purchase orders
    • Scheduled payments
    • Contract renewals

Step 5: Combine into Final Projection

Since QuickBooks can’t combine these reports natively, you’ll need to:

  1. Create a Weekly Projection Worksheet:
    • Week 1-12 columns
    • Sections for:
      • Beginning cash
      • Projected inflows
      • Projected outflows
      • Net cash position
  2. Add Formula Calculations:
    • Weekly cash position
    • Cumulative position
    • Minimum cash threshold alerts
  3. Update Source Reports:
    • Refresh all QuickBooks reports
    • Re-export to Excel
    • Update calculations
    • Adjust projections

Step 6: Maintain and Update

The projection requires regular maintenance:

  1. Daily Updates:
    • Log into QuickBooks
    • Run fresh A/R and A/P reports
    • Export new data
    • Update Excel calculations
  2. Weekly Reviews:
    • Compare projections to actuals
    • Adjust collection rates
    • Update payment patterns
    • Modify future projections

Simplifying Cash Flow Projections with Coefficient

While the above process gives you detailed cash flow projections, it requires significant manual work and constant updating. Many businesses connect QuickBooks directly to their spreadsheets for a more streamlined approach.

Using a tool like Coefficient, you can:

  • Pull live A/R and A/P data directly into your spreadsheet
  • Maintain historical payment patterns automatically
  • Refresh projections with a single click
  • Create real-time cash flow dashboards

Automating QuickBooks Reporting

Automating your QuickBooks reporting can save time, reduce errors, and provide timely insights. Let’s explore the automation features available in QuickBooks and how Coefficient can further enhance these capabilities.

QuickBooks automation features

QuickBooks offers several built-in automation features for reporting:

  1. Scheduled Reports: Set up recurring reports to be automatically generated and emailed to specified recipients at regular intervals.
  2. Memorized Reports: Save customized report settings for quick access and consistent formatting.
  3. Bank Feeds: Automatically import and categorize transactions from linked bank accounts and credit cards.
  4. Rules: Create rules to automatically categorize recurring transactions based on specific criteria.
  5. Recurring Transactions: Set up automatic creation of regular invoices, bills, or journal entries.

While these features provide a good starting point for automation, many businesses find they need more advanced capabilities to fully streamline their reporting processes.

Real-time data syncing and scheduled refreshes

One of the most powerful features of Coefficient is its ability to provide real-time data syncing between QuickBooks and your spreadsheets. This means your reports and dashboards are always showing the most current financial data.

Additionally, Coefficient allows you to set up scheduled refreshes, ensuring your reports are updated at the frequency you need:

  • Hourly updates for time-sensitive metrics
  • Daily refreshes for regular reporting
  • Weekly or monthly updates for long-term trend analysis

By leveraging these automation capabilities, you can:

  • Reduce manual data entry and associated errors
  • Save time on repetitive reporting tasks
  • Ensure consistent and timely reporting across your organization
  • Focus on analysis and decision-making rather than data preparation

Automating your QuickBooks reporting with Coefficient not only saves time but also provides more accurate and timely insights, enabling you to make data-driven decisions with confidence in 2026 and beyond.

Limitations of QuickBooks Reporting and How to Overcome Them

While QuickBooks serves as a fundamental accounting tool for many businesses, its reporting capabilities often fall short for growing organizations. Understanding these limitations is crucial for businesses looking to scale their financial operations effectively and make data-driven decisions.

Customization and Control Constraints

QuickBooks’ approach to report customization presents significant challenges for businesses requiring detailed financial analysis. While the platform offers standard reports, users frequently struggle to adapt these templates to their specific needs.

Creating department-specific reports or drilling down to granular product line details often requires complex workarounds. Most businesses end up spending hours manually modifying reports to get the insights they need.

The platform’s rigid structure makes it particularly difficult to implement multi-layered filters. Imagine trying to analyze sales data across different locations, product categories, and date ranges simultaneously—a task that should be simple but requires extensive manual work in QuickBooks.

Data Management and Performance Issues

As businesses grow and accumulate more financial data, QuickBooks’ performance limitations become increasingly apparent. The system struggles notably with large datasets, often resulting in sluggish performance or complete system crashes when generating comprehensive reports.

This challenge becomes particularly acute when attempting to analyze long-term financial trends. Many businesses find themselves breaking down their reporting into smaller time chunks just to get the system to work.

Common performance issues include:

  • System timeouts during report generation
  • Unpredictable load times for complex reports
  • Crashes when handling multi-year data
  • Difficulty maintaining consistent reporting schedules

Integration and Cross-System Analysis

Modern businesses rely on multiple systems to run their operations efficiently. However, QuickBooks’ limited integration capabilities create significant obstacles in generating comprehensive financial insights.

Connecting QuickBooks with CRM systems, inventory management software, or project management tools often requires manual intervention. This limitation forces many organizations to maintain separate spreadsheets and manually transfer data between systems.

The result? Teams spend countless hours on data entry and consolidation. What should be a seamless flow of information becomes a time-consuming exercise in data management.

Complex Business Structure Support

For businesses with multiple entities or locations, QuickBooks’ reporting capabilities prove especially restrictive. Creating consolidated reports across different business units often requires maintaining separate QuickBooks instances.

Consider a business with three locations trying to understand their overall performance. Instead of pulling a single comprehensive report, they need to export data from each location individually and manually combine it.

Permission settings add another layer of complexity. QuickBooks offers limited options for controlling who can access and modify reports, making it difficult to:

  • Restrict access to sensitive financial data
  • Delegate report creation tasks
  • Customize user permissions based on roles
  • Manage team collaboration effectively

Free QuickBooks Reporting Dashboards

To help businesses leverage their QuickBooks data more effectively, Coefficient offers a range of free, ready-to-use reporting templates and dashboards. These templates are designed to work seamlessly with QuickBooks data and can be easily customized to suit your specific business needs.

#1 Cash Runway Template

The Cash Runway Template is an essential tool for businesses focused on cash flow management and forecasting. This report provides a clear picture of how long your current cash reserves will last based on your current burn rate and projected income.

Use case: Cash flow management and forecasting

Key metrics tracked:

  • Current cash balance
  • Monthly burn rate
  • Projected income
  • Estimated runway (in months)

While QuickBooks doesn’t provide a built-in Cash Runway Template, you can create one using the data exported from QuickBooks. Tools like Coefficient offer pre-built templates that can be easily connected to your QuickBooks data for real-time cash runway analysis.

Get the QuickBooks Cash Flow Projections Template

#2 Quickbooks Profit and Loss Dashboard

The Profit and Loss (P&L) Dashboard is a cornerstone of financial performance analysis in QuickBooks. It provides a comprehensive overview of your company’s revenues, costs, and expenses over a specified period.

Use case: Financial performance analysis

Key metrics tracked:

  • Total revenue
  • Cost of goods sold (COGS)
  • Gross profit
  • Operating expenses
  • Net income

QuickBooks offers a built-in P&L Dashboard, which can be customized to suit your specific needs. However, for more advanced analysis and visualization, many businesses opt to export this data and create custom dashboards using tools like Coefficient.

Access the QuickBooks Profit and Loss Dashboard

#3 SaaS P&L Template

For Software as a Service (SaaS) companies, a specialized P&L template is crucial for accurately tracking and analyzing financial performance. The SaaS P&L Template incorporates metrics specific to the SaaS business model.

Use case: SaaS financial analysis

Key metrics tracked:

  • Monthly Recurring Revenue (MRR)
  • Annual Recurring Revenue (ARR)
  • Customer Acquisition Cost (CAC)
  • Lifetime Value (LTV)
  • Churn rate

You can access a comprehensive SaaS P&L Template designed to work seamlessly with QuickBooks data at Coefficient’s SaaS Profit and Loss Template.

#4 QuickBooks Accounts Payable Template

Effective vendor payment management is crucial for maintaining healthy business relationships and cash flow. The Accounts Payable Template helps you track and manage your outstanding bills and payments to vendors.

Use case: Vendor payment management

Key metrics tracked:

  • Total outstanding payables
  • Payables aging
  • Upcoming due dates
  • Payment history

Coefficient offers a ready-to-use QuickBooks Accounts Payable Dashboard that you can find here. This template provides a comprehensive view of your accounts payable, helping you stay on top of your vendor payments.

#5 QuickBooks Accounts Receivable Dashboard

Tracking customer payments is essential for maintaining a healthy cash flow. The Accounts Receivable Dashboard helps you monitor outstanding invoices and customer payment patterns.

Use case: Customer payment tracking

Key metrics tracked:

  • Total outstanding receivables
  • Receivables aging
  • Average days to pay
  • Collection rate

While QuickBooks provides basic accounts receivable reports, many businesses benefit from creating more detailed dashboards using tools like Coefficient, which allow for deeper analysis and customization.

Get Started with the QuickBooks Accounts Receivable Dashboard

#6 QuickBooks Inventory Management Dashboard

For businesses dealing with physical products, effective inventory management is crucial. The Inventory Management Dashboard helps you optimize your stock levels and prevent stockouts or overstocking.

Use case: Inventory optimization

Key metrics tracked:

  • Current stock levels
  • Reorder points
  • Turnover rate
  • Days of inventory on hand

QuickBooks offers basic inventory reports, but for more advanced inventory management, consider exporting your data to create custom dashboards that provide deeper insights into your inventory performance.

Optimize Your Inventory with the QuickBooks Inventory Management Dashboard

#7 QuickBooks Online (QBO) Revenue Dashboard

A detailed revenue dashboard is essential for analyzing your income streams and forecasting future revenue. The QBO Revenue Dashboard provides a comprehensive view of your business’s revenue performance.

Use case: Revenue analysis and forecasting

Key metrics tracked:

  • Total revenue
  • Revenue by product/service
  • Revenue growth rate
  • Average revenue per customer

You can access a free, ready-to-use QBO Revenue Dashboard template at Coefficient’s QBO Revenue Dashboard. This template connects directly to your QuickBooks Online data, providing real-time insights into your revenue performance.

#8 – QuickBooks Cashflow Template

Cash flow management is critical for business survival and growth. The QuickBooks Cashflow Template helps you track and forecast your cash inflows and outflows.

Use case: Cash flow management

Key metrics tracked:

  • Operating cash flow
  • Investing cash flow
  • Financing cash flow
  • Net cash flow

Coefficient offers a free QuickBooks Cashflow Template that you can find here. This template provides a clear view of your cash flow situation, helping you make informed financial decisions.

Take Your QuickBooks Reporting to the Next Level

Creating effective reports in QuickBooks requires understanding both its capabilities and limitations. While QuickBooks provides essential financial reporting tools, growing businesses often need more flexibility and automation to get the insights they need.

The right tools can transform how you handle financial reporting, turning hours of manual work into automated, real-time insights. By combining QuickBooks’ robust financial data with modern reporting solutions, you can build reports that actually drive business decisions.

Ready to take your QuickBooks reporting to the next level? Get started with Coefficient today and unlock the full potential of your financial data.

FAQs

Can you create a dashboard in QuickBooks?

Yes, you can create dashboards in QuickBooks. While QuickBooks offers some built-in dashboard features, you can create more customized and flexible dashboards by exporting your QuickBooks data to tools like Coefficient, which allows you to build advanced dashboards in familiar spreadsheet environments.

How do I customize my QuickBooks Online dashboard?

To customize your QuickBooks Online dashboard, go to the dashboard and click on the “Customize” button. From there, you can add, remove, or rearrange widgets to suit your needs. For more advanced customization, consider using Coefficient to create fully customized dashboards based on your QuickBooks data.

What is the purpose of the QuickBooks dashboard?

The QuickBooks dashboard serves as an all-in-one tool for viewing and controlling your business finances in real-time. It provides an overview of key financial metrics, helps you track incoming and outgoing payments, and allows you to perform core business actions quickly and easily. With Coefficient, you can enhance this functionality by creating more detailed and customized dashboards.

What data is displayed on the dashboard of QuickBooks Online?

The QuickBooks Online dashboard typically displays information about invoices, sales, expenses, and a basic profit and loss graph. It also shows banking information for connected accounts. However, by using Coefficient with QuickBooks, you can create dashboards that display any data from your QuickBooks account, providing more comprehensive and tailored insights for your business.

Related Articles

Related Videos