
QuickBooks Profit and Loss (P&L)
Struggling to manually analyze complex financial data? Harness the power of P&L and Account data, turning complex information into digestible insights. Powered by your live QuickBooks data in Google Sheets and Excel.
Trusted by thousands of companies
How to use the QBO P&L Template
Start by clicking “Get Free Template.” Copy it directly to your Google Sheets or Excel workspace. No complex setup required.
Connect your QuickBooks account using Coefficient’s secure authorization. Your financial data syncs automatically—eliminating manual exports and tedious copy-paste work.
Customize the dashboard to match your needs. Adjust date ranges with pre-built filters. Swap COGS fields for custom metrics. Add data from Stripe, Shopify, or Salesforce for comprehensive analysis.
Watch your P&L update in real-time. Set automated refresh schedules to keep your team informed without constant manual updates.
Who is this template built for?
- Finance teams need speed. This template serves CFOs, controllers, and analysts who track profitability across multiple dimensions without wrestling with QuickBooks exports.
- Small business owners get clarity. Monitor revenue trends, expense categories, and profit margins in a familiar spreadsheet environment. No accounting degree required.
- Operations managers gain visibility. Track departmental performance, cost centers, and budget variance with filters that actually work. Share insights with stakeholders using formats they understand.
What is the format of a profit & loss statement?
A P&L statement follows a simple structure. Revenue sits at the top.
Start with gross revenue—your total sales before any deductions. Subtract returns and discounts to get net revenue.
Next comes cost of goods sold (COGS). These are direct costs tied to producing your product or service. Subtract COGS from net revenue to calculate gross profit.
Operating expenses follow. List categories like salaries, rent, marketing, and utilities. These indirect costs keep your business running but aren’t tied to specific sales.
The bottom line shows net income. Revenue minus all expenses equals profit (or loss). This number tells you whether you’re making money.
How to read a P&L Statement?
Reading a P&L is straightforward. Start with revenue trends—are sales growing month-over-month? Check gross margin percentage by dividing gross profit by revenue. Higher margins mean better pricing power. Scan operating expenses for unusual spikes. Calculate your net profit margin to understand true profitability. Compare periods side-by-side to spot patterns and anomalies quickly.
Perform Financial Analyses with QuickBooks Data Directly in Google Sheets and Excel
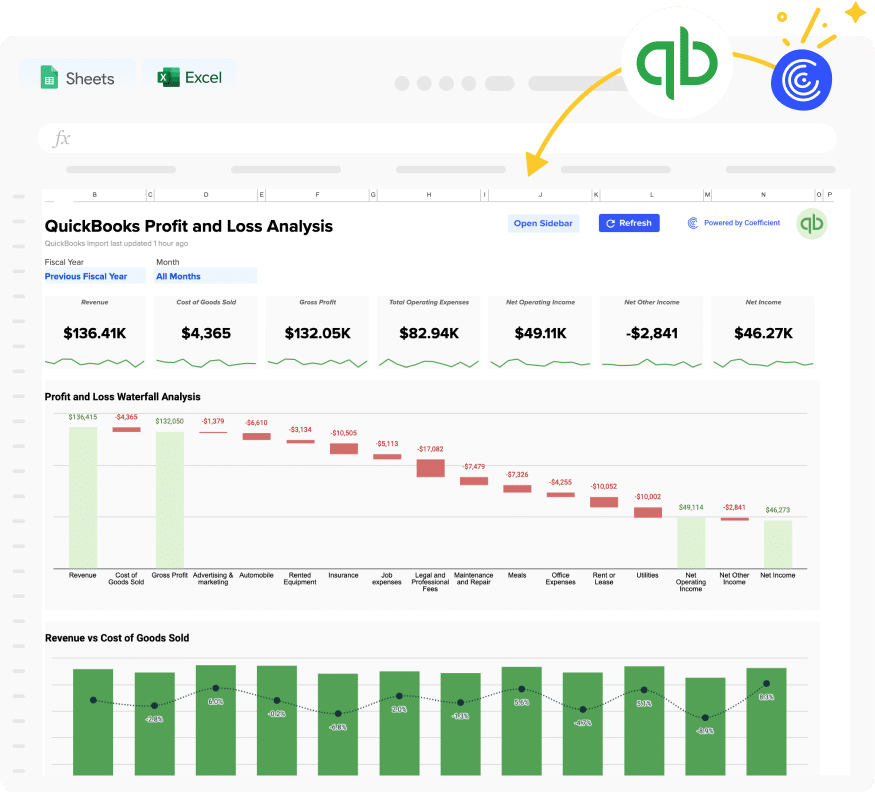
Our easy-to-use QuickBooks dashboard levels up your financial analysis by offering a comprehensive, real-time view of your QuickBooks data within Google Sheets and Excel:
- Access your Profit & Loss data instantly across various time horizons and dimensions for in-depth financial analysis
- Utilize spreadsheet filters and pre-built formulas to globally adjust your dashboard, narrowing down to specific fiscal years and months
- Personalize the dashboard with flexibility: modify data imports, switch fields like COGS, and incorporate custom fields as per your analysis requirements
- Expand your analysis by importing additional QuickBooks reports or even integrate data from other sources like Stripe, Shopify, Salesforce, or HubSpot
Try our free QuickBooks Financial Analysis Dashboard now to start optimizing your financial analysis directly from Google Sheets or Excel.
Questions & Answers
Is it really free?
Our Google Sheets templates and Excel dashboards are 100% free to use, no account required. You’ll simply make a copy, then automatically connect to your live data — or pull in data manually — your choice.
What is a Coefficient template? What makes them different?
Coefficient templates live right inside of your Google Sheets and Excel. Use in a manual fashion or connect with your business systems in a few clicks to populate the template with your live data. We like to call them Connected Spreadsheets.
How do I use a Coefficient template?
Submit your email on this page. Then, click the blue “Use Template” button in the top right of your browser to copy the template to your own Google Workspace or Microsoft Account.
FAQs
How to generate a P&L in QuickBooks?
Navigate to Reports in QuickBooks. Select “Profit and Loss” from the financial statements section. Choose your date range and accounting method (cash or accrual). Click “Run Report” to generate. But here’s the catch—you’re stuck in QuickBooks. Our template pulls this data directly into Google Sheets or Excel where you can actually analyze it.
How to create a P&L report template?
Skip the manual build. Our template comes pre-configured with formulas, categories, and visualizations that mirror QuickBooks’ structure. Connect your data source, and the template populates automatically. Customize categories, add comparison periods, and build variance analysis without starting from scratch.
Where can I find QuickBooks templates?
QuickBooks offers basic templates in their resource center. But they’re static. Our connected templates sync live data and update automatically. Access them directly through Coefficient’s dashboard library—no downloads, no imports, just instant connectivity to your actual financials.
Get this free template now
Stop exporting CSVs. Start analyzing live data. Our QuickBooks P&L template transforms your financial reporting from a monthly chore into real-time intelligence. Connect your data, customize your view, and share insights that drive decisions.
