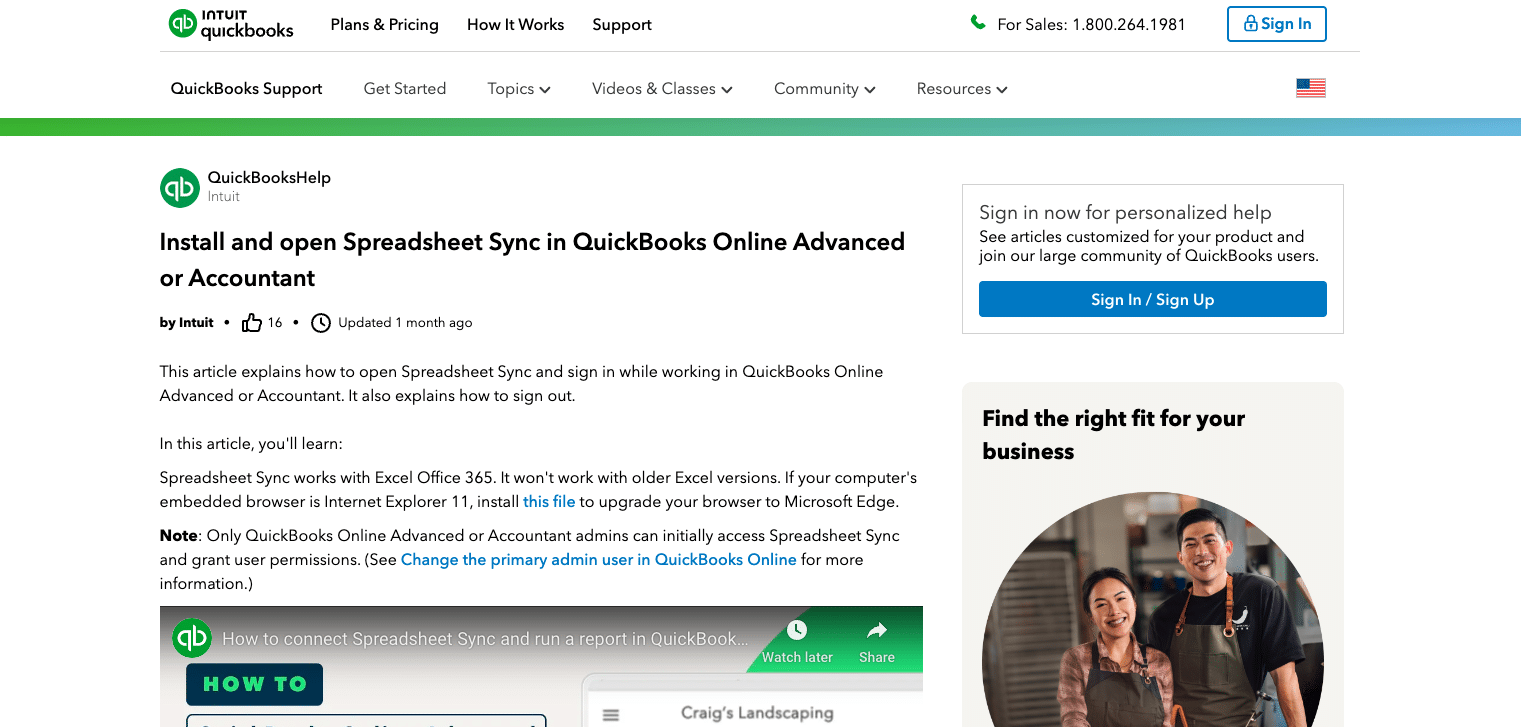
Quickbooks Online (QBO) from Intuit is cloud accounting software used by many business owners. This functionality enables automated email reports through your preferred email service, whether you’re using QBO, Quickbooks Desktop, Quickbooks Desktop Pro, or Quickbooks Online Advanced.
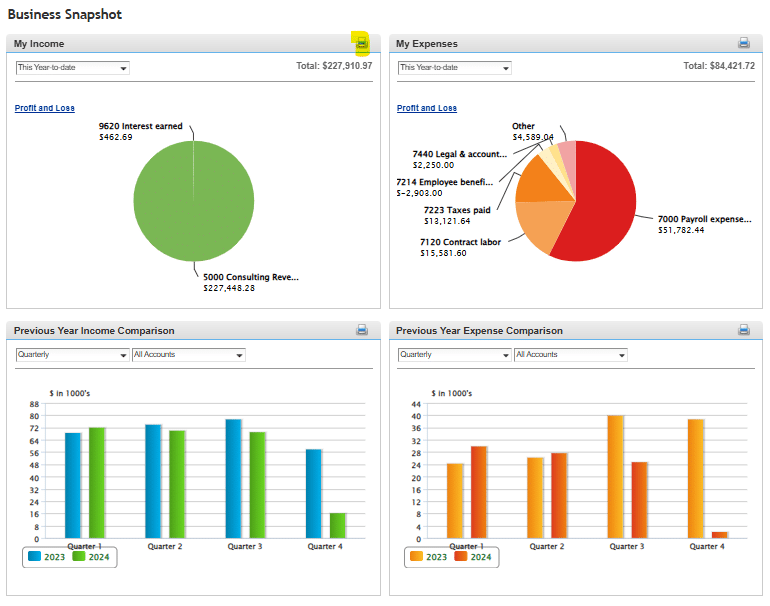
P&L reports can be sent automatically through your chosen email provider (Gmail, Outlook, or webmail) to relevant stakeholders. These reports help businesses measure and analyze profitability during a specific time period.
Let’s get started!
Step-by-Step Guide: P&L Report in QBO
In order to send P&L reports automatically in QBO, you first want to make sure that your P&L is accurate and ready to be set up as a memorized report. This includes:
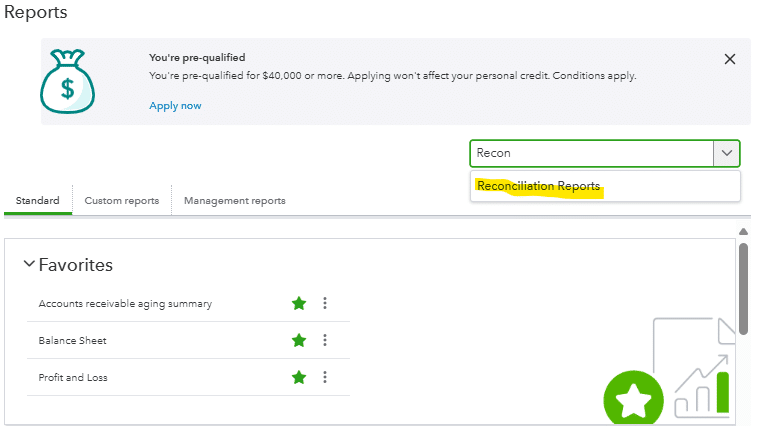
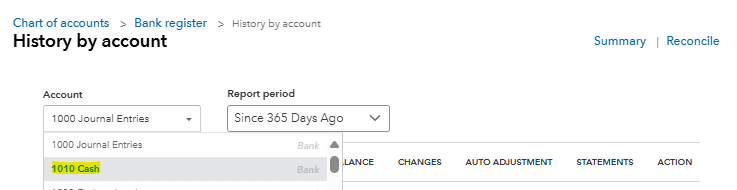
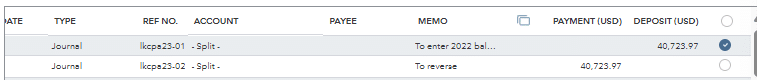
- Reconciling accounts – This will ensure that the information in each revenue / expense account is accurate and up-to-date before the report is sent out.
- Format P&L – Determine if you want to make any format changes to your P&L report before setting up the P&L report to automatically send.
- Determine frequency – Figure out how often you would like to set email schedule. The most common choice would be to send it out monthly.
- Gather stakeholder information – Make sure that you have up-to-date email account information and send forms settings for recipients.
.Step-by-Step Guide:
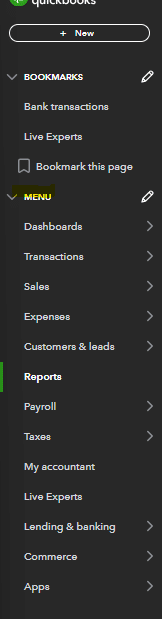
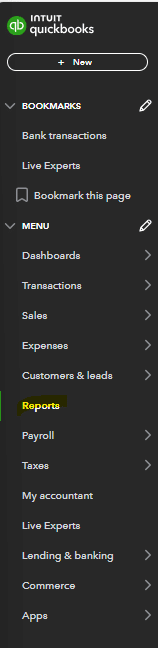
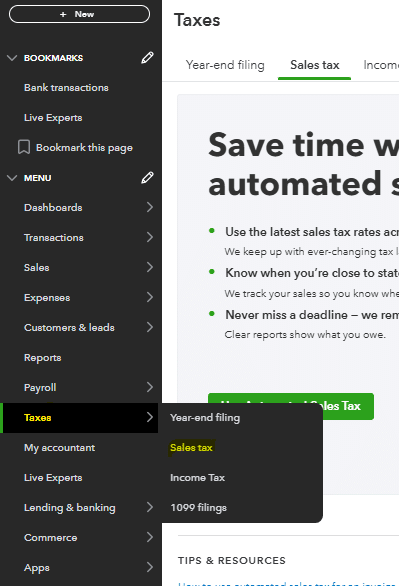
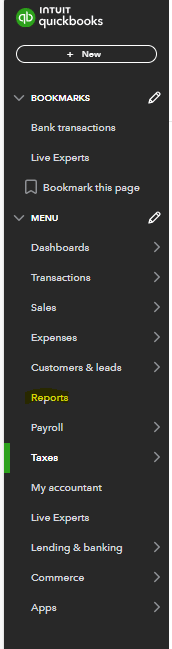
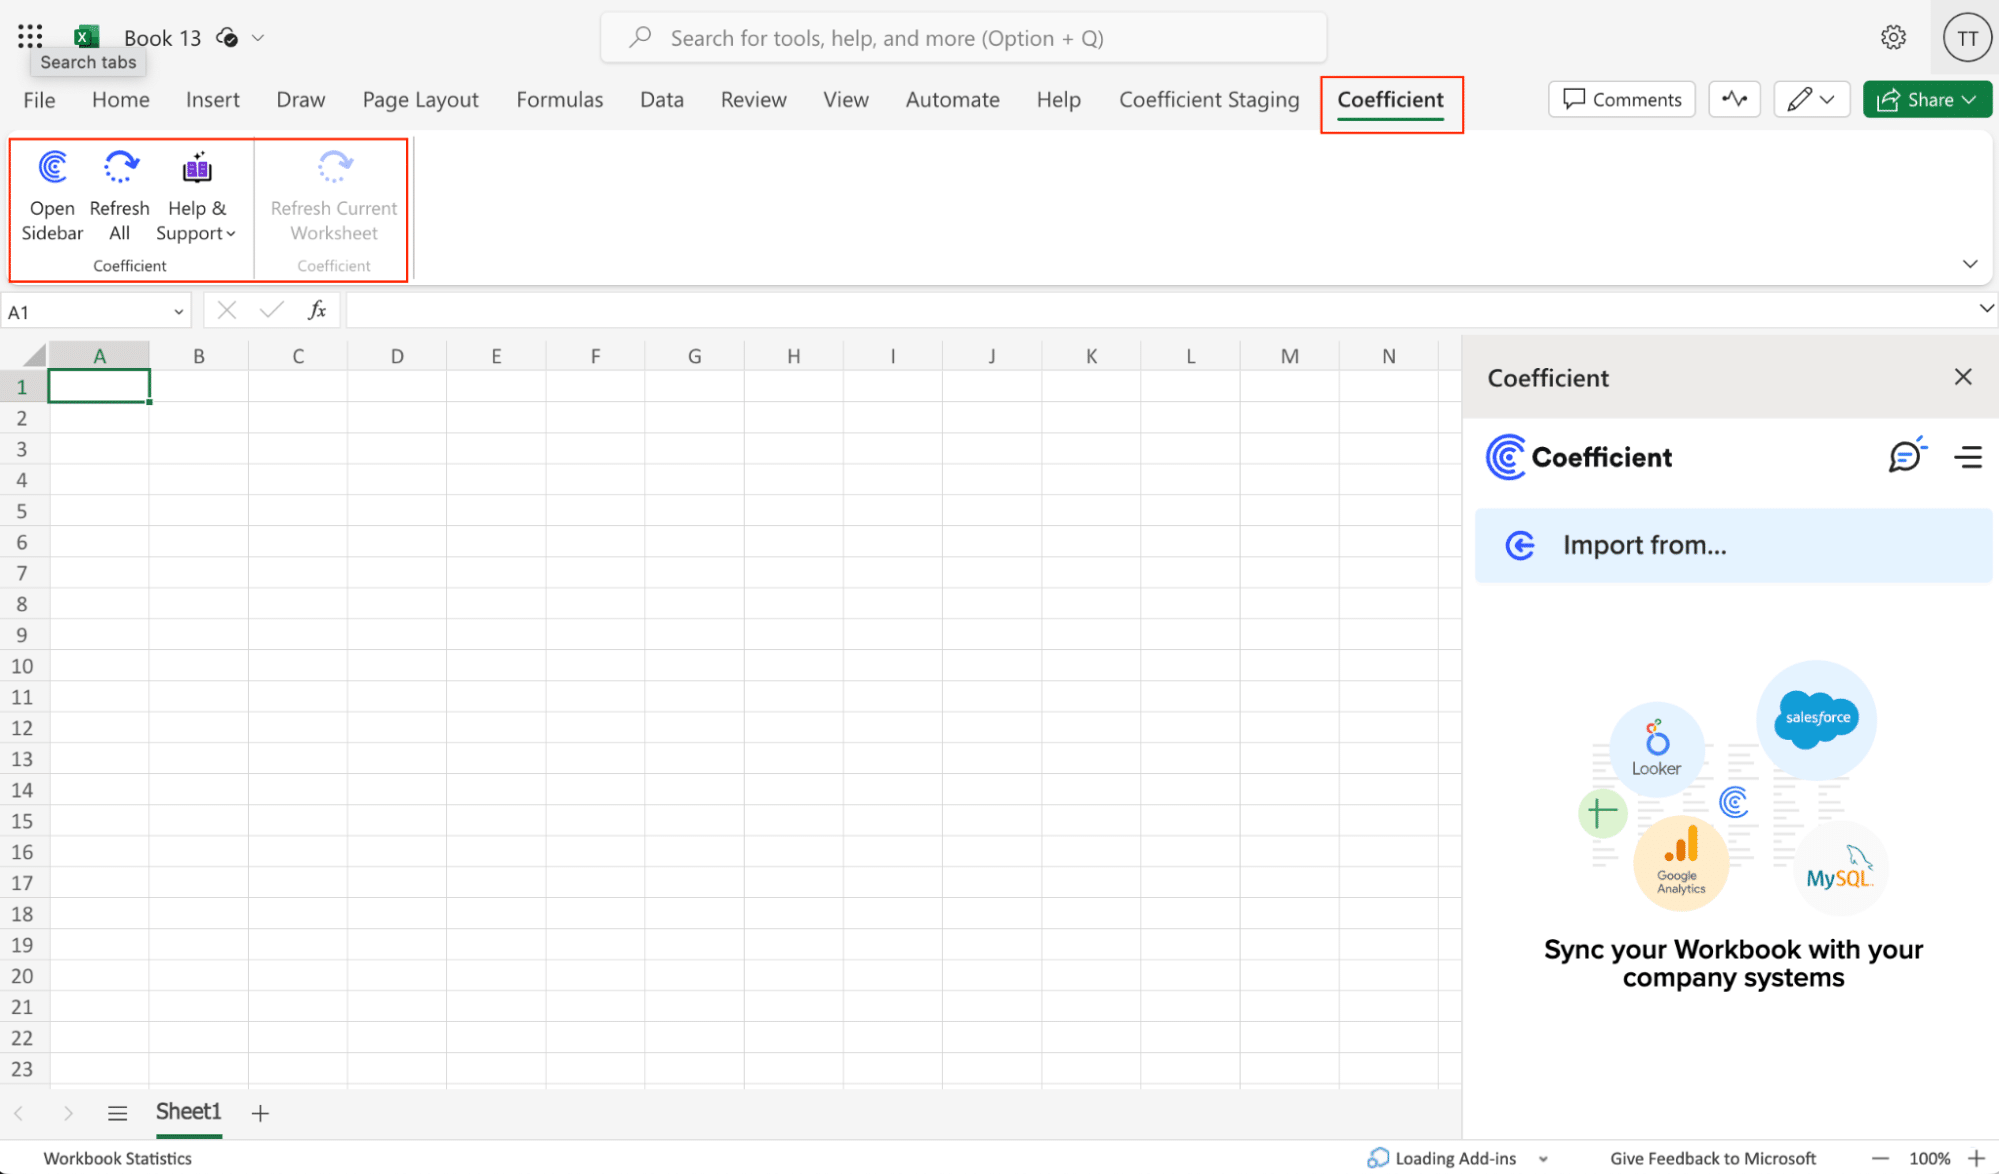
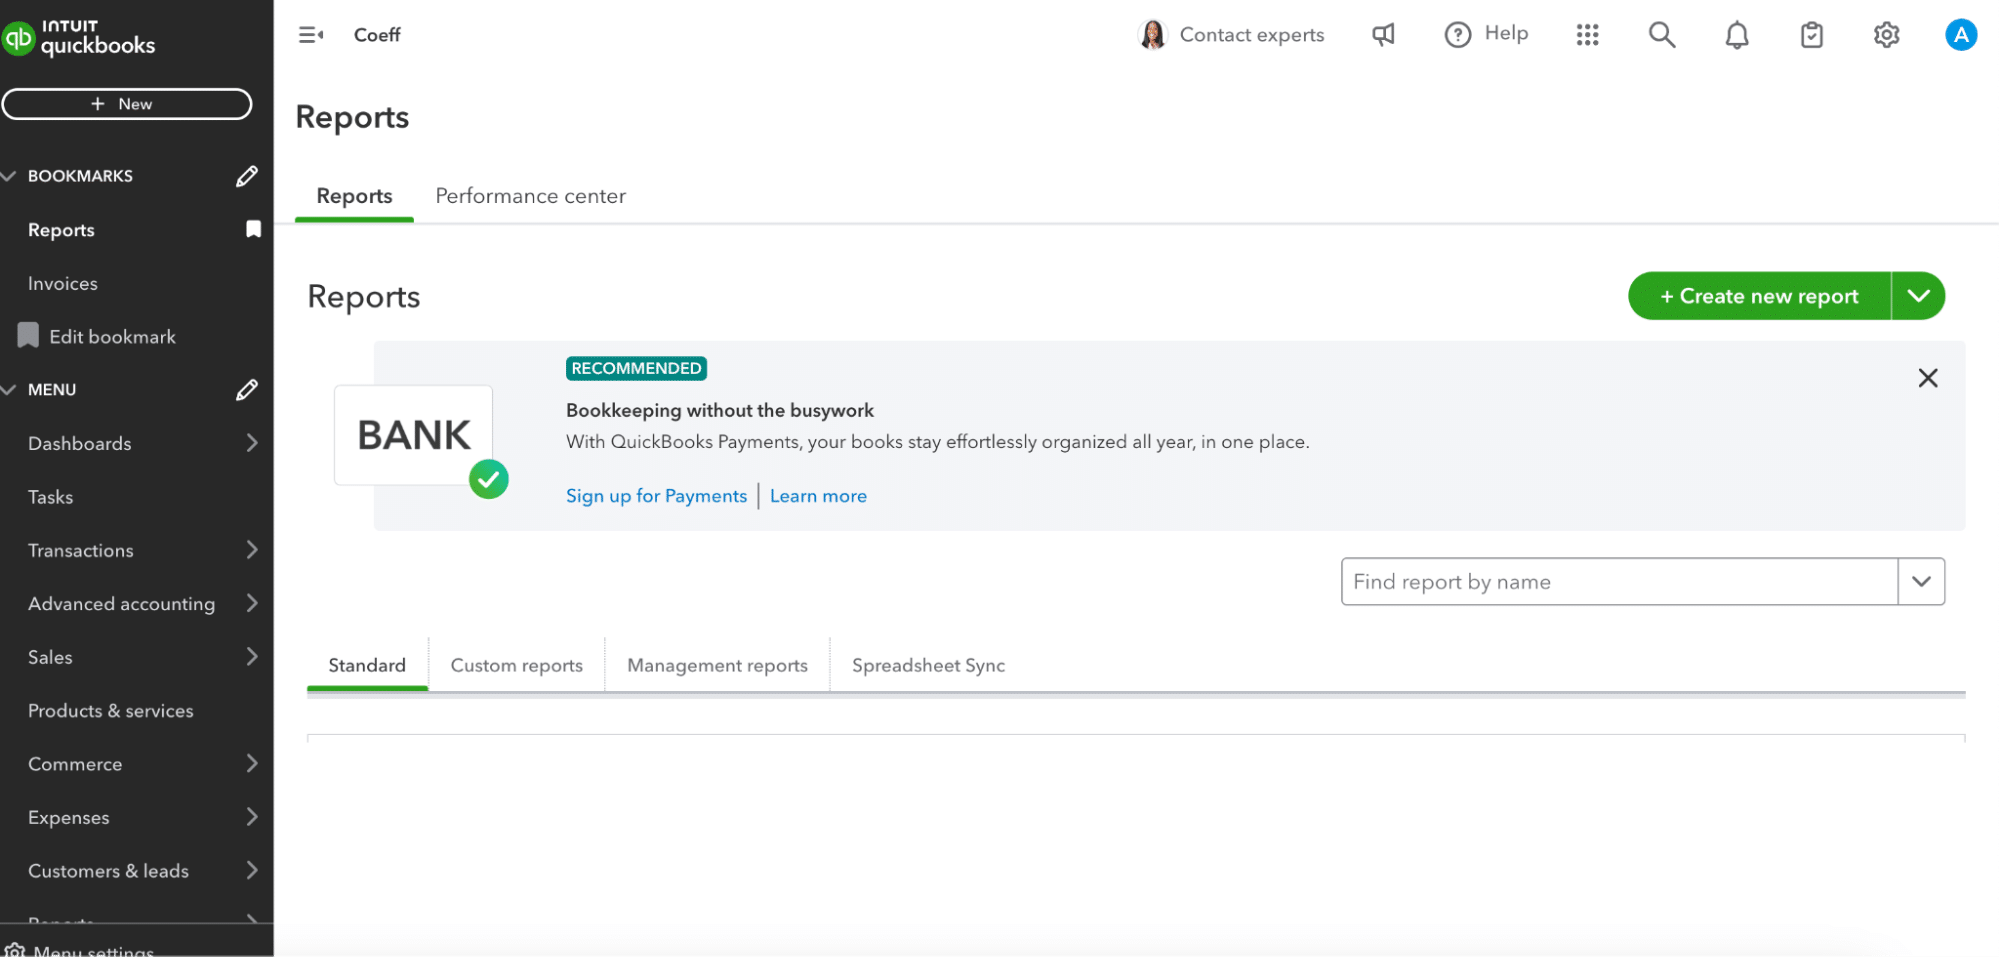
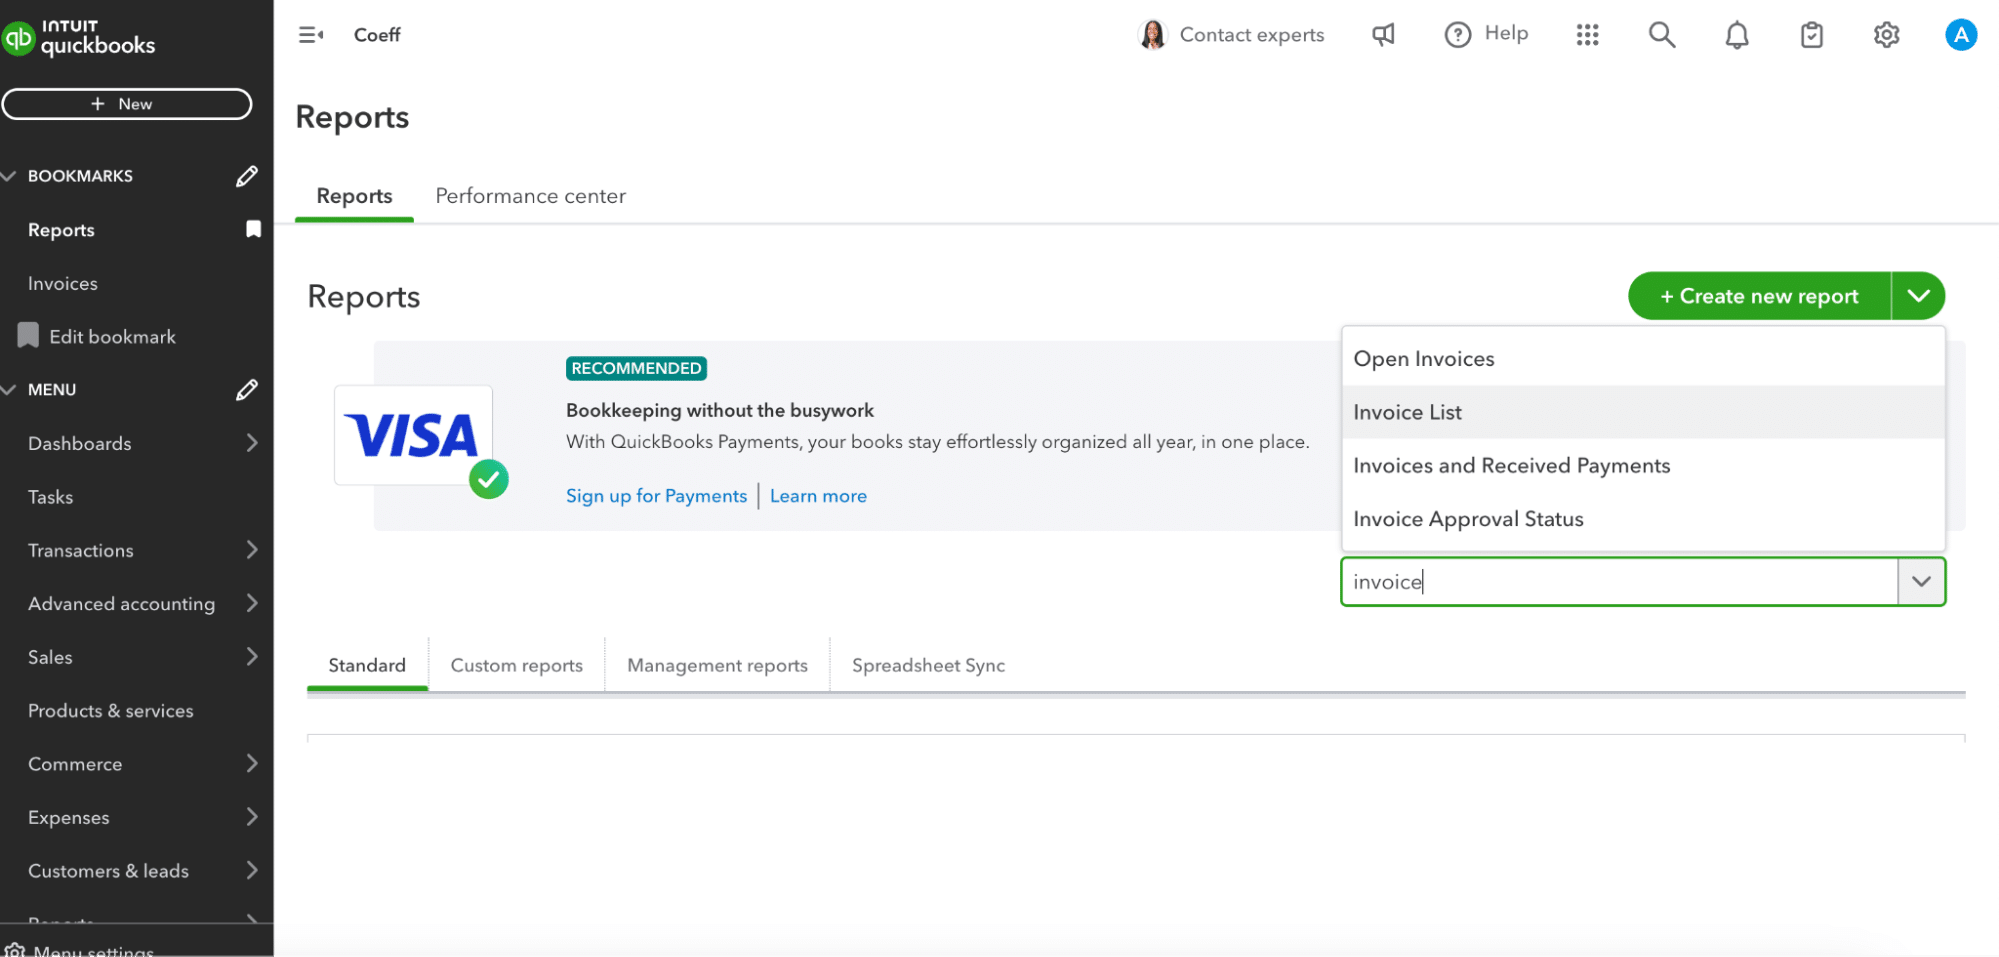
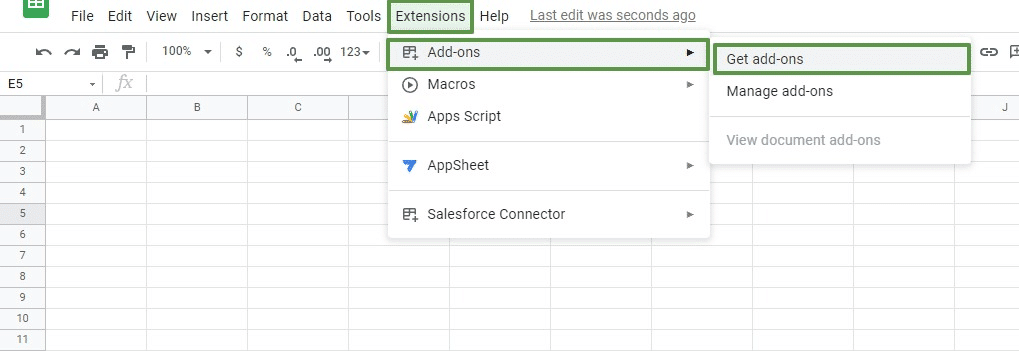
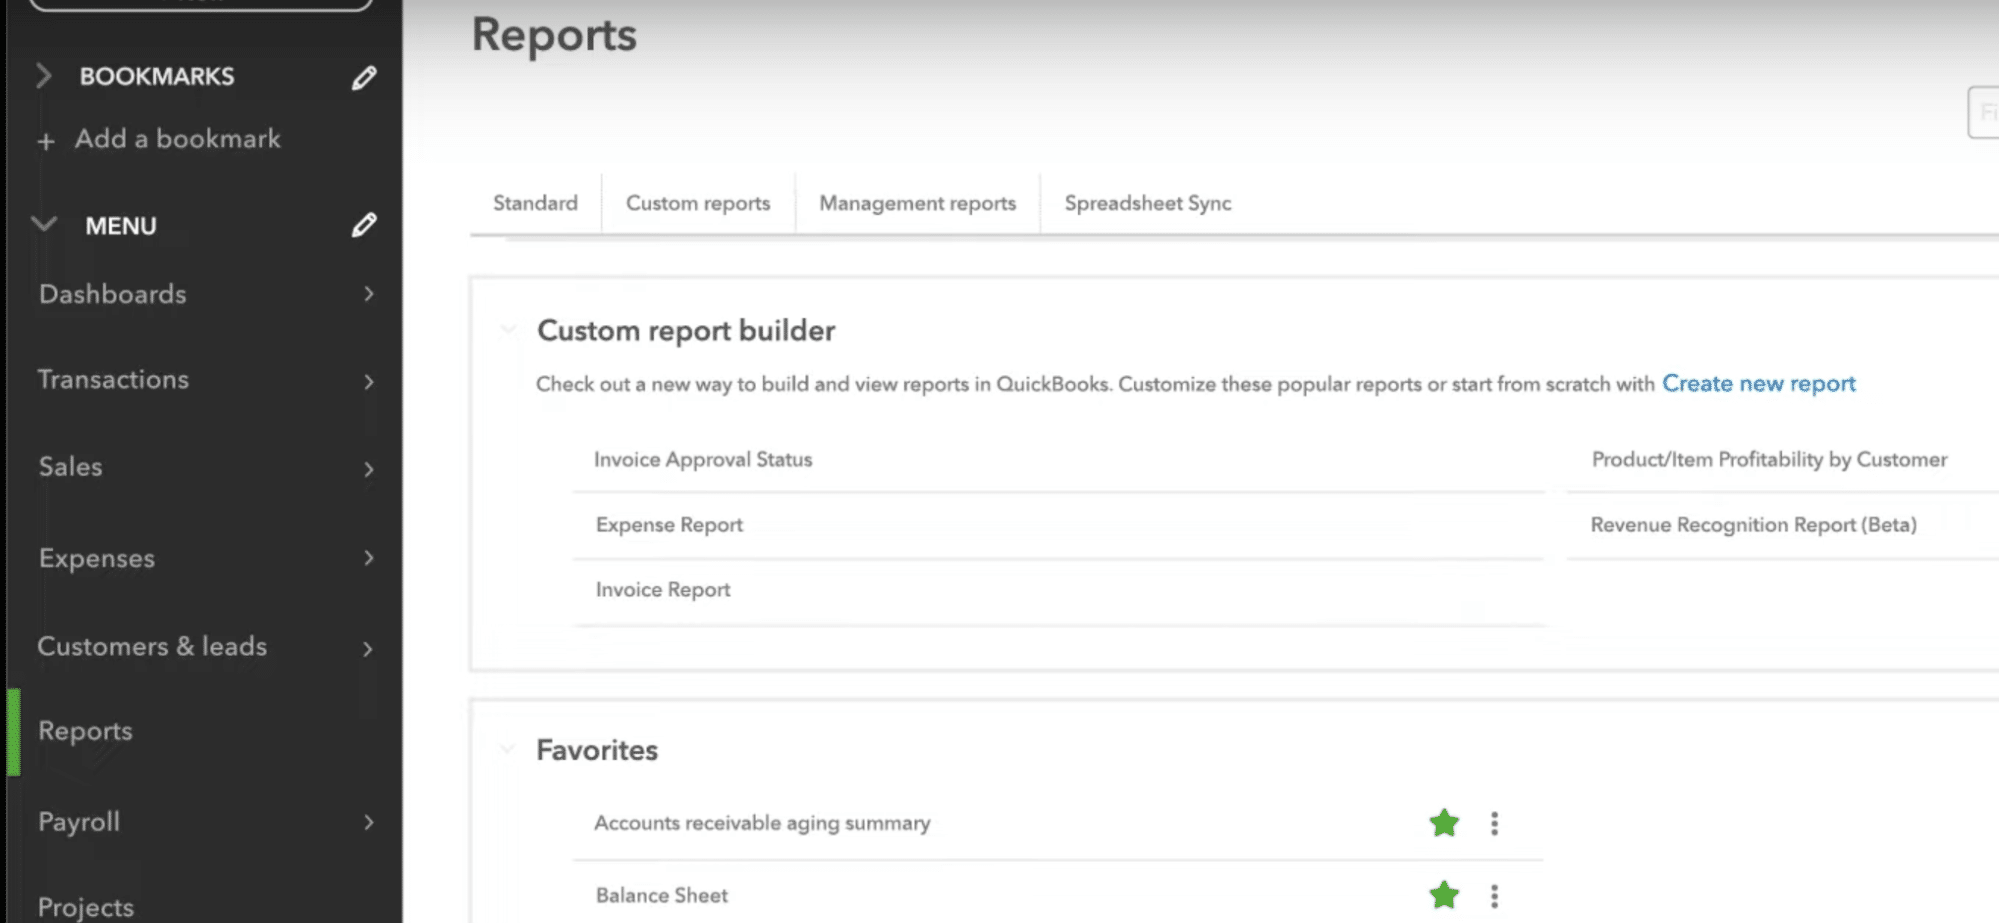
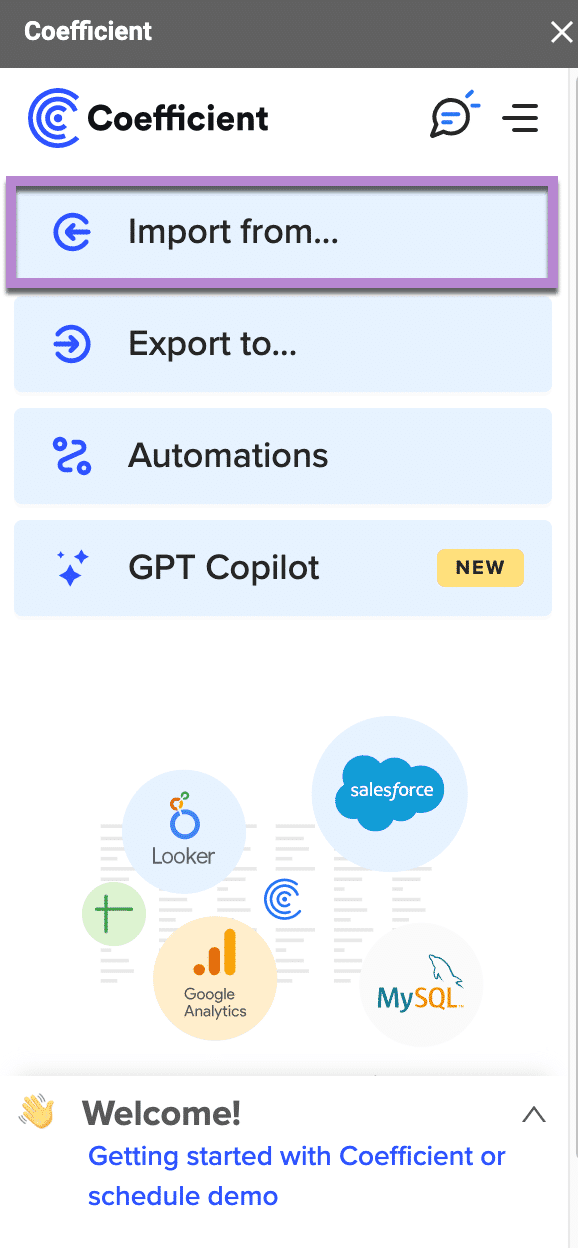
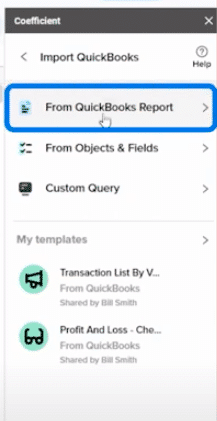
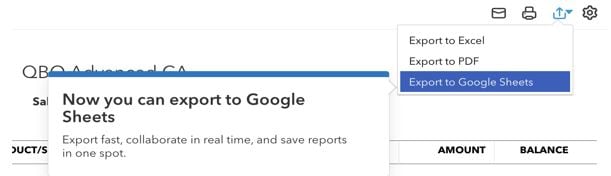
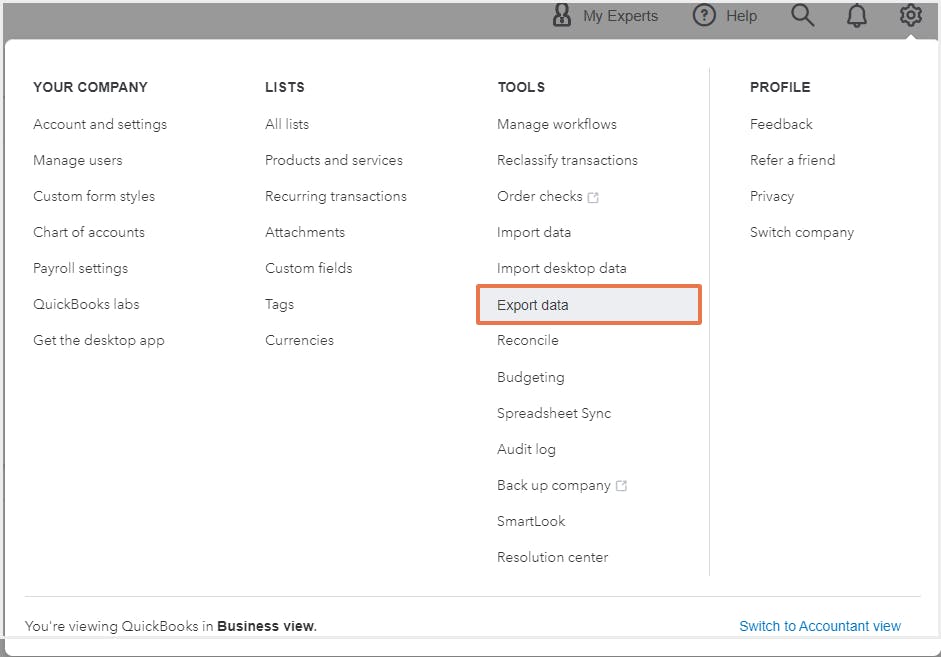
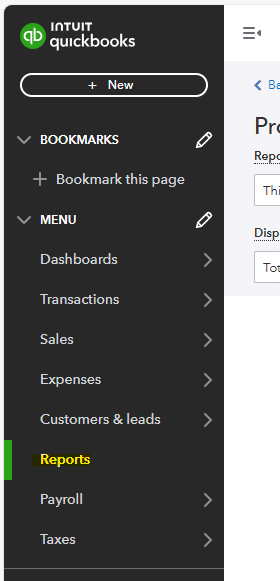
Step 1: Navigate to the Reports Section in QBO
Within QBO navigate to the reports section in the menu section. This process works across platforms, including Mac and Quickbooks Enterprise systems. Use the drop-down menu to access report options.
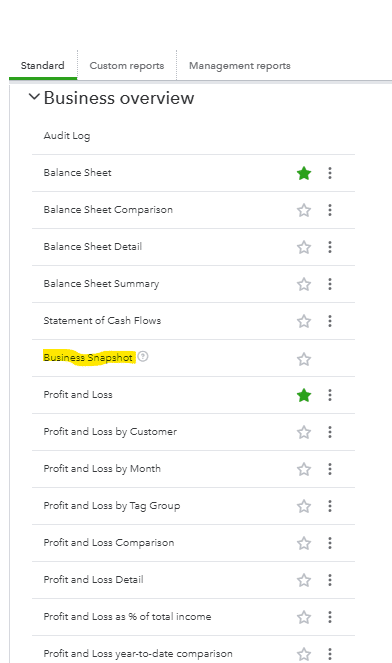
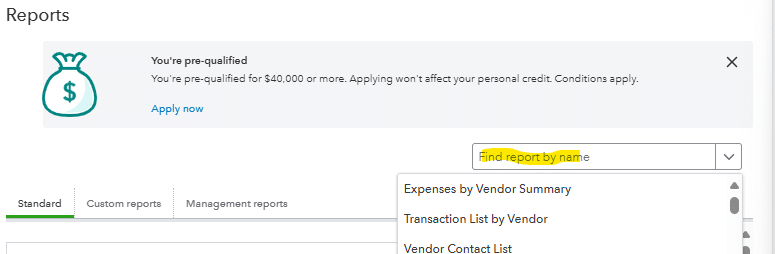
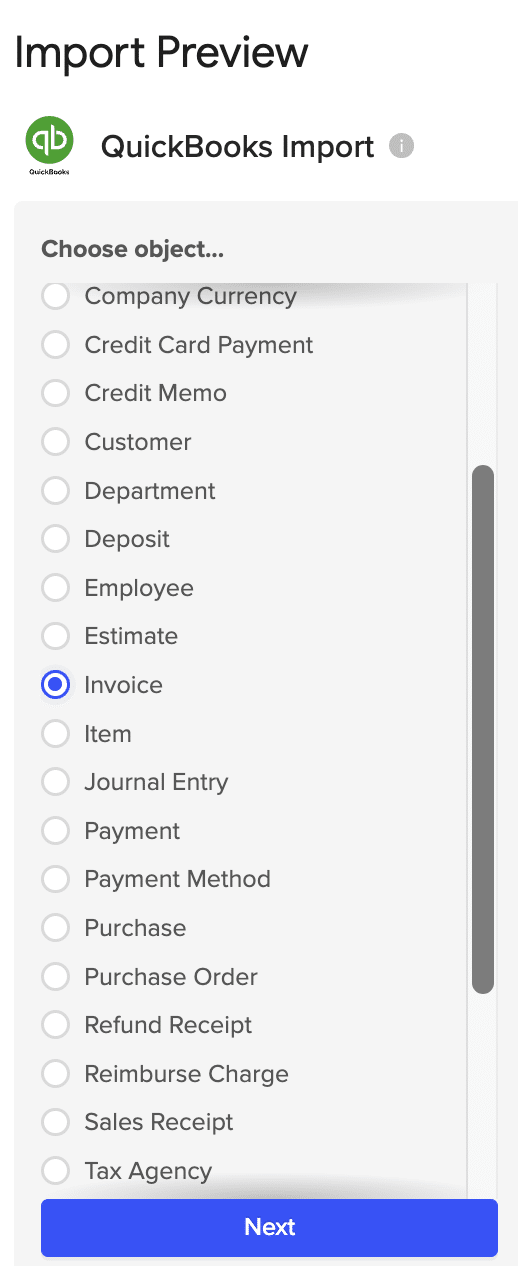
Step 2: Add Profit and Loss Report to Custom Reports
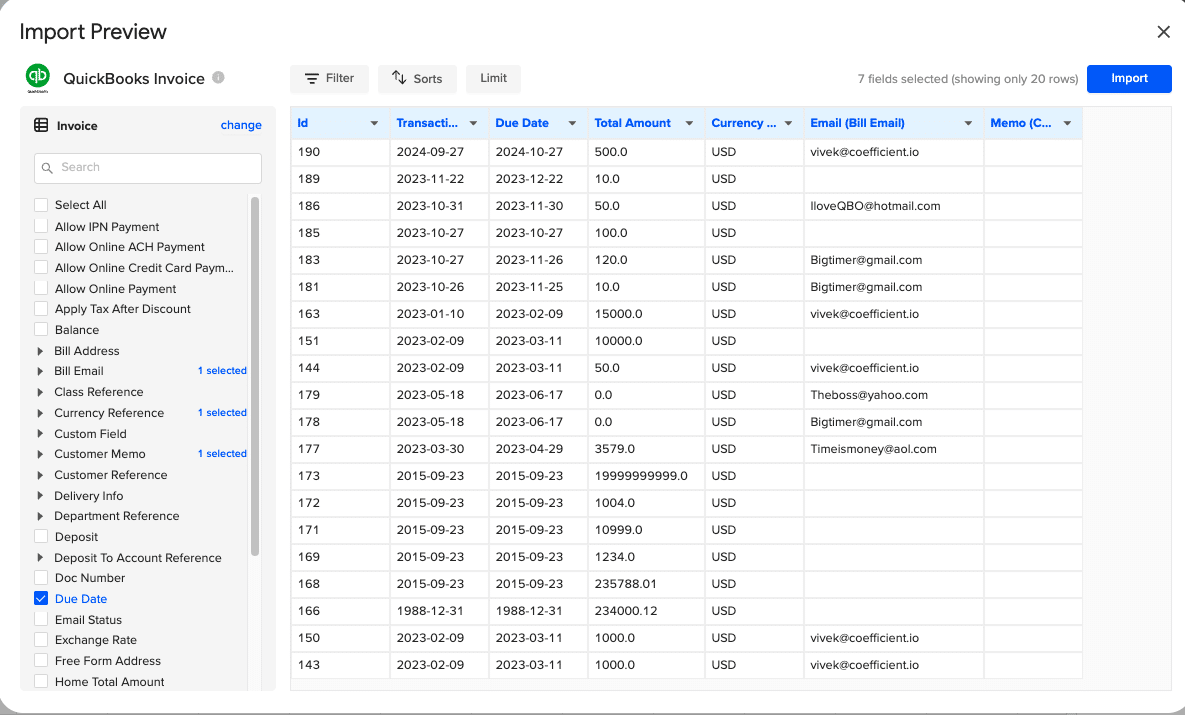
Once you’ve navigated to the Reports section, you’ll need to add the P&L to your custom reports. To do this, select the 3 dots next to the Profit and Loss report and select Customize. Use the checkbox options to configure initial settings.

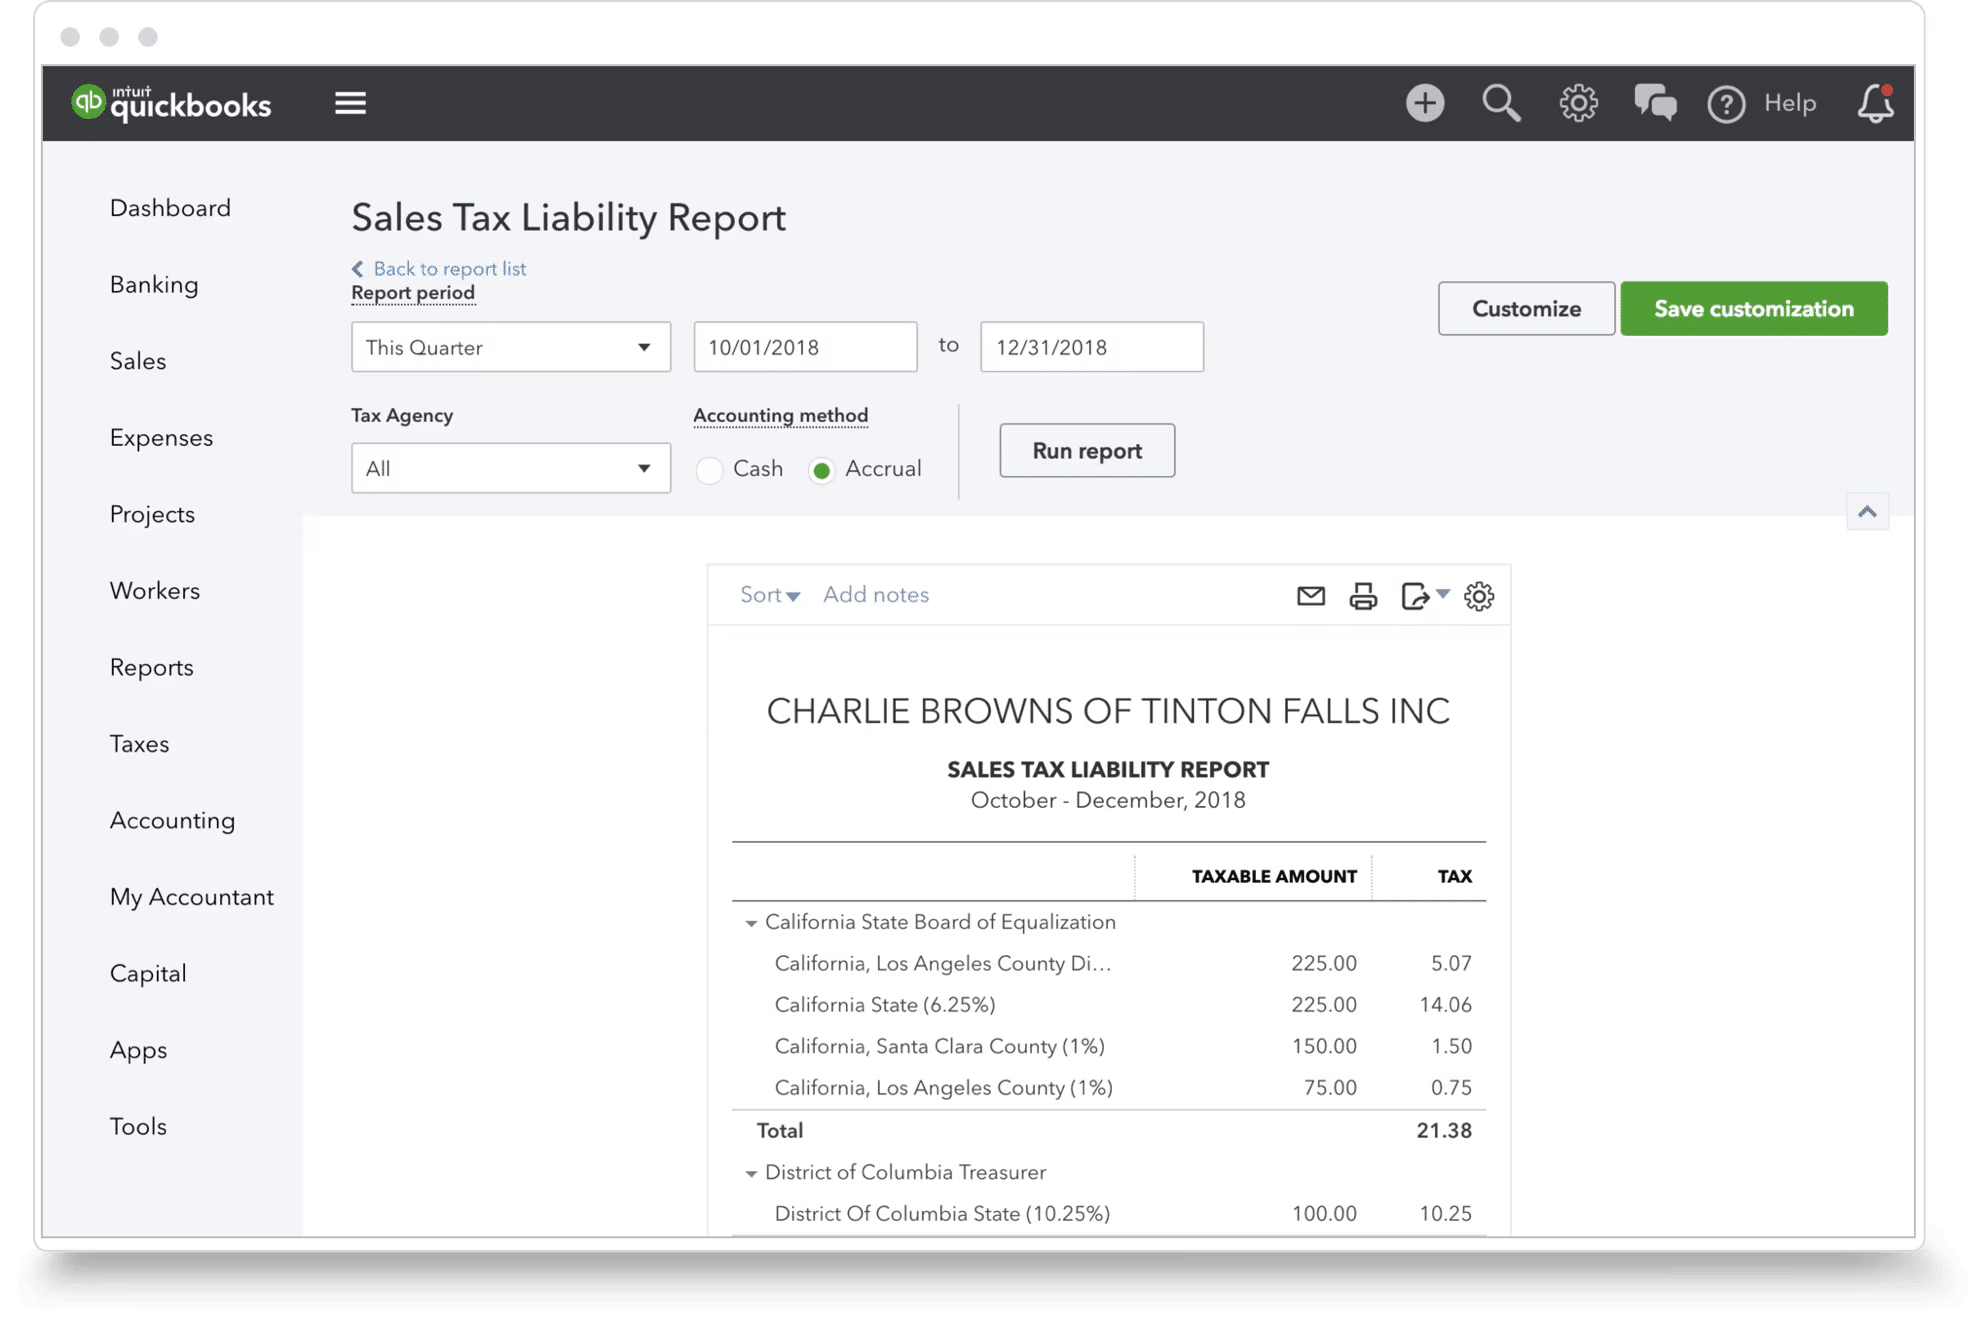
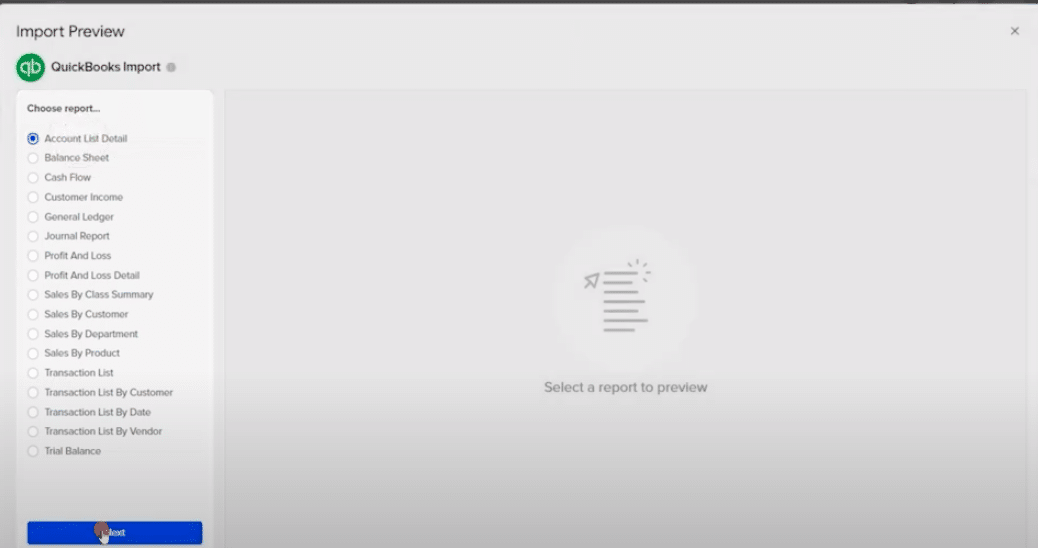
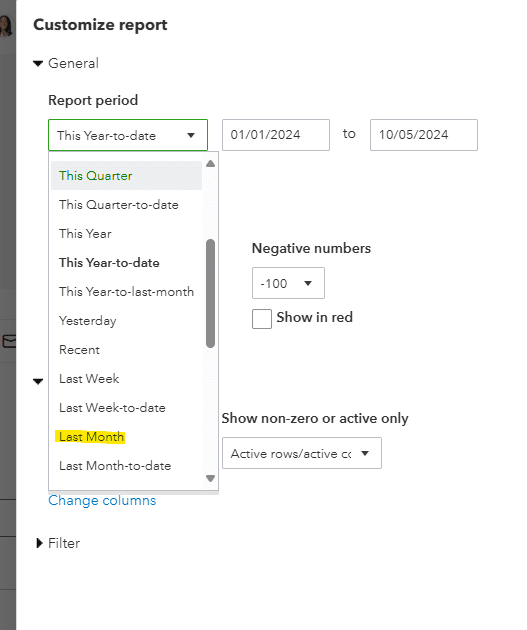
Step 3: Select the Report Period for P&L Report
Once you’ve selected Customize, you will be prompted to select email preferences and report period. In this example, we are going to pull the last month for our report and then click to run that report. Select OK to confirm your choices.
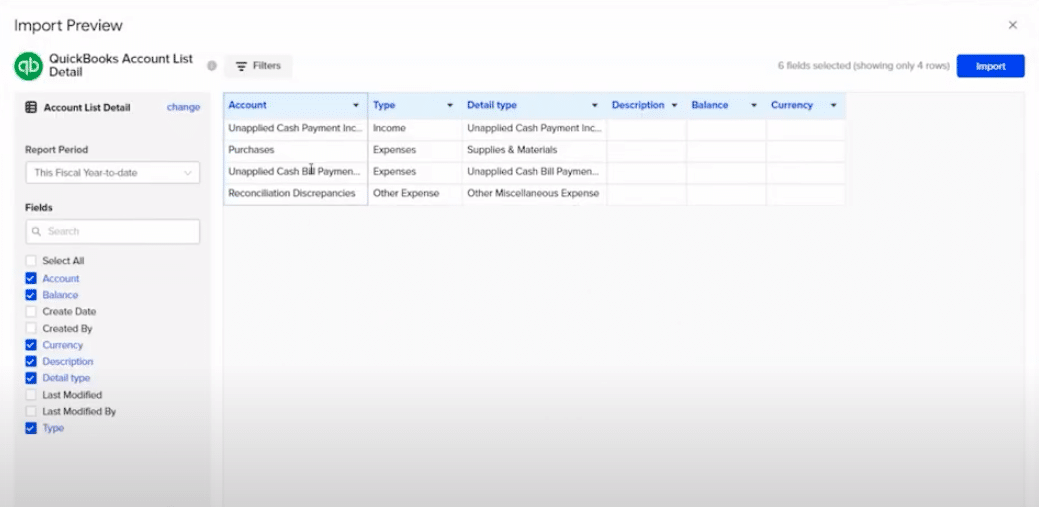
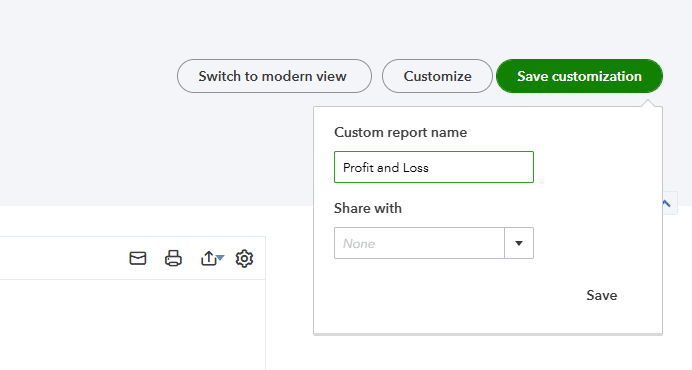
Step 4: Customize Report
After creating the P&L as a custom report in QBO, you will have the option to make changes. You can adjust any accounts pulling in and formatting within the report to be more meaningful and clearly articulate the results to your stakeholders.
Configure your preferred email provider and default email settings. Once you’ve made any relevant changes, save the customization and name your report.
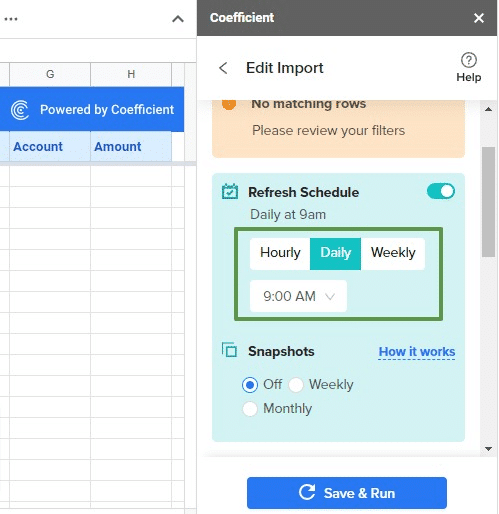
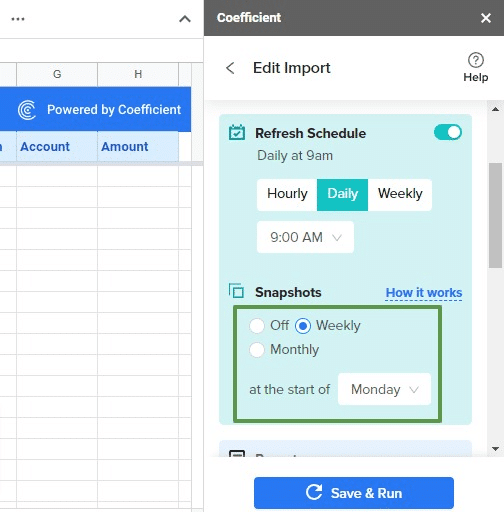
Step 5: Schedule Reports
Once you’ve created the custom reports, navigate back to the reports section. Select the relevant report that you want to schedule and click the edit menu.

Once you’ve selected Edit, you can navigate to the set email schedule toggle and switch it from off to on. A pop-up will appear with email options.
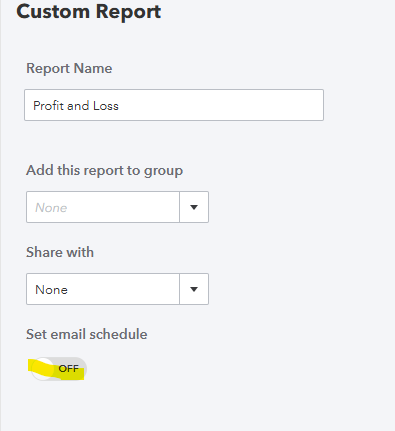
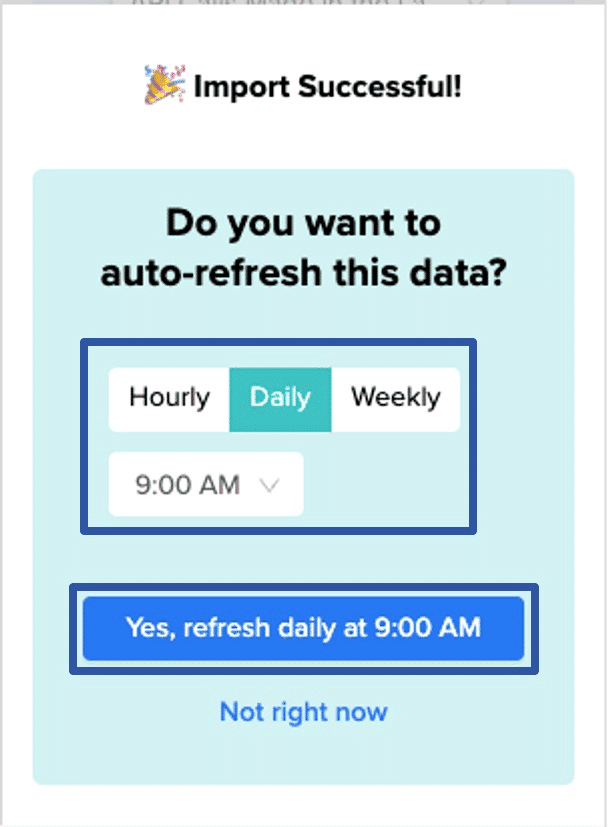
Once you’ve toggled to yes, you will be prompted to set the recurrence and message that is sent with your report. This setup enhances your bookkeeping efficiency and ensures consistent reporting.
You will have the option to select the day that you would like to send the report to your stakeholder(s). You will want to select a date after you have reconciled and ensured the accuracy of the data you are sending out.
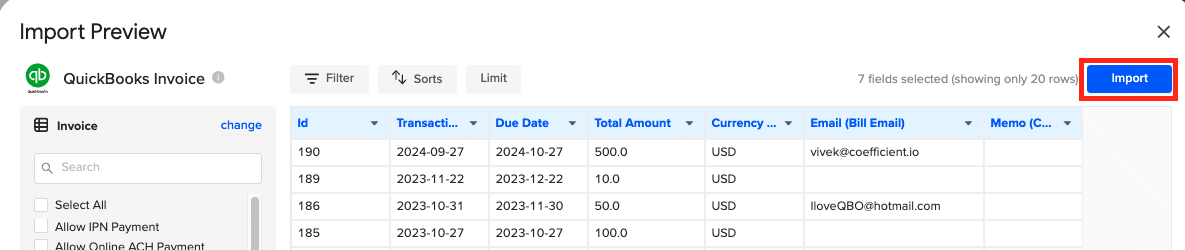
Once you’ve selected the options for your scheduled reports, hit save and close in the bottom right hand of the screen and your report will automatically send out every month.

Use Cases for Sending P&L Report Automatically
Automatically sending a P&L report can be useful for businesses in order to:
- Distribute useful information on a regular basis to stakeholders.
- Automate the distribution of reports to eliminate manual intervention.
- Get stakeholders information in a timely manner to make decisions with the most recent information.
Improve Your P&L Reporting out of QuickBooks
P&L reports along with other standard QBO reports are useful tools for business planning and decision making. It can help stakeholders understand their financials and improve the businesses profitability By following this guide, you will be able to automatically send those reports throughout your organization.
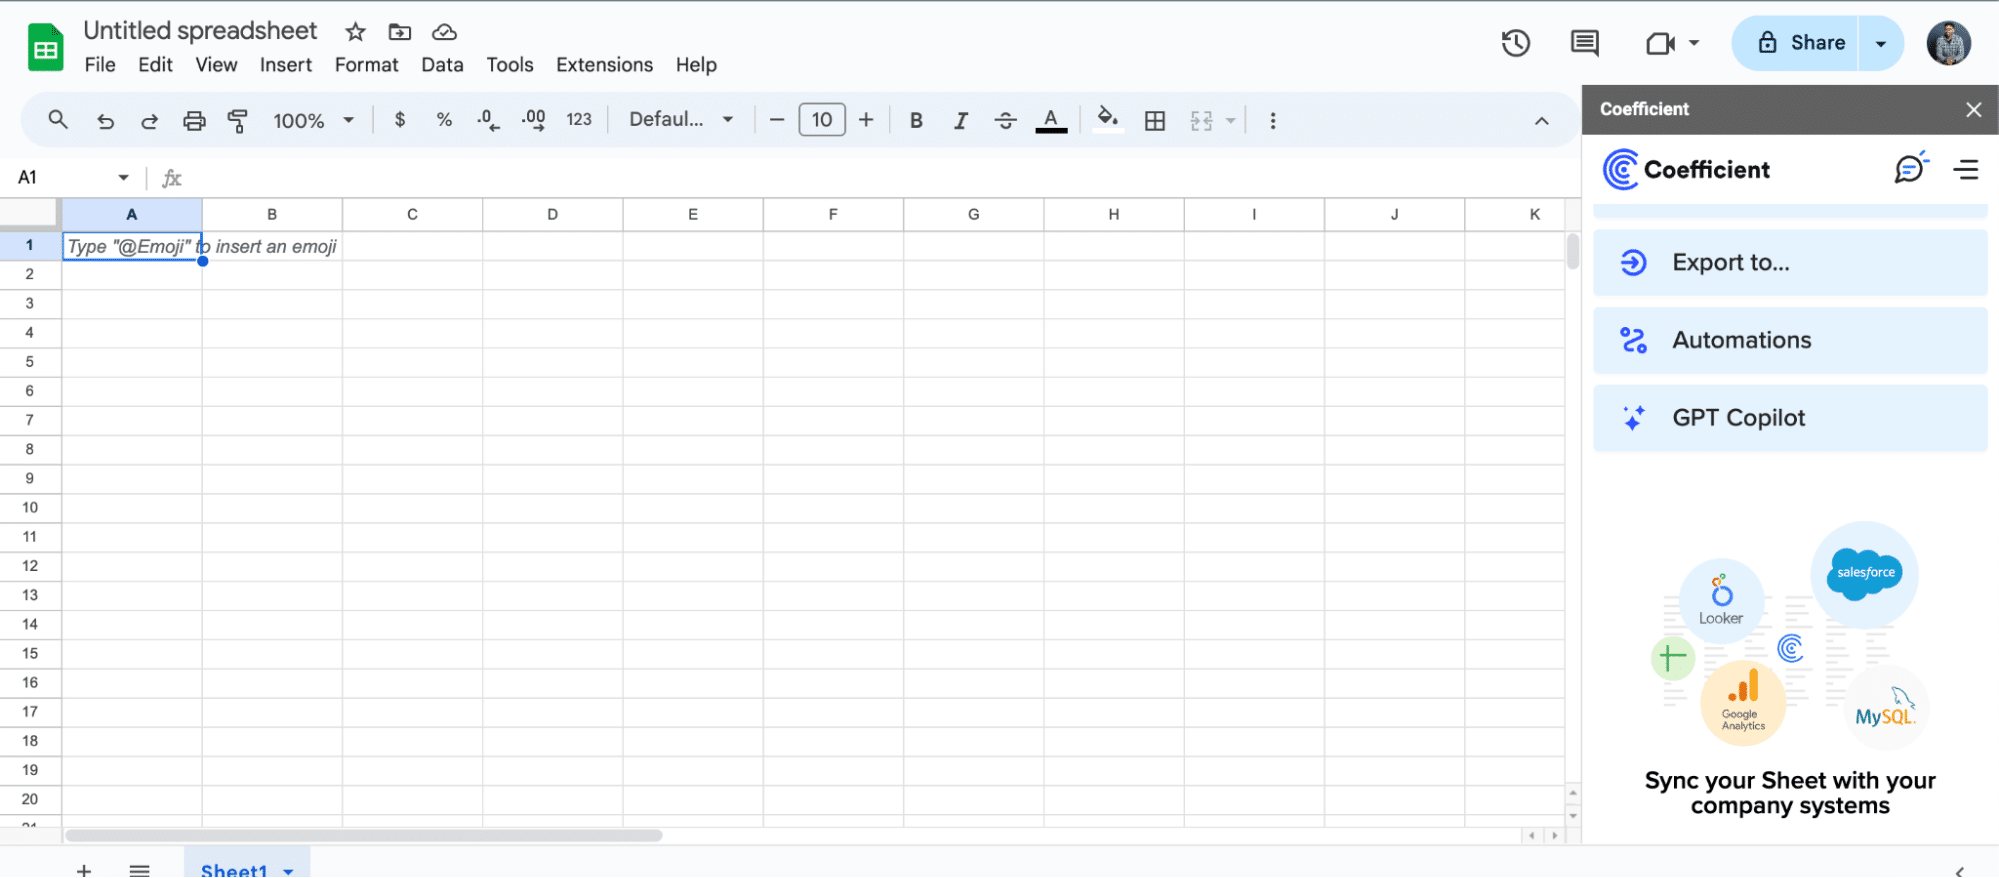
Ready to take your data analysis to the next level?
Try Coefficient to seamlessly integrate your Excel with live data from various business systems, enabling real-time analysis and more advanced financial modeling.