Building effective dashboards in QuickBooks helps you track your business’s financial health and make better decisions. This comprehensive guide walks you through creating and customizing QuickBooks dashboards to get the insights you need.
Common QuickBooks Report Types
QuickBooks includes several built-in reports to help you track different aspects of your business. Here are the key report types and how to use them effectively:
Financial Reports
Profit & Loss (Income Statement)
Shows your revenue, costs, and expenses over time to help you understand profitability.
Key information:
- Total income
- Cost of goods sold
- Operating expenses
- Net profit/loss
Best for: Monthly, quarterly, and annual performance review
Balance Sheet
Provides a snapshot of your business assets, liabilities, and equity at a specific point in time.
Key information:
- Current assets and liabilities
- Long-term assets and debts
- Owner’s equity
- Account balances
Best for: Understanding your overall financial position
Statement of Cash Flows
Tracks how money moves in and out of your business through operating, investing, and financing activities.
Key information:
- Operating cash flow
- Investment spending
- Financing activities
- Net cash position
Best for: Cash flow management and planning
Sales & Customer Reports
Sales by Customer Summary
Shows total sales by customer over a specific period.
Key information:
- Sales by customer
- Payment history
- Sales trends
- Customer rankings
Best for: Customer relationship management and sales analysis
Accounts Receivable Aging
Groups unpaid customer invoices by how long they’ve been outstanding.
Key information:
- Current amounts due
- Overdue payments (30/60/90 days)
- Collection priorities
- Customer payment patterns
Best for: Managing collections and cash flow
Vendor & Purchasing Reports
Accounts Payable Aging
Lists unpaid bills grouped by due date.
Key information:
- Current bills due
- Overdue payments
- Vendor payment history
- Payment priorities
Best for: Managing vendor payments and cash outflow
Vendor Balance Summary
Shows amounts owed to each vendor and payment history.
Key information:
- Total owed by vendor
- Payment history
- Outstanding bills
- Vendor spending trends
Best for: Vendor relationship management
Inventory Reports
Inventory Valuation Summary
Shows the value and quantity of items in stock.
Key information:
- Current stock levels
- Item costs
- Total inventory value
- Stock movement
Best for: Inventory management and ordering
Stock Status
Lists items that need reordering based on set reorder points.
Key information:
- Low stock alerts
- Reorder points
- Quantity on hand
- Recent sales history
Best for: Purchase planning and stock management
Exporting Reports From QuickBooks
While QuickBooks offers robust reporting capabilities, many businesses find it beneficial to export their data for further analysis or custom reporting. Here’s how you can export reports from QuickBooks:
Different export options
QuickBooks allows you to export reports in various formats, including:
- CSV (Comma-Separated Values): This format is ideal for importing data into spreadsheet applications or other data analysis tools.
- XLSX (Excel Spreadsheet): This format is perfect for users who prefer working with Microsoft Excel for further analysis and visualization.
- PDF: This format is perfect for sharing with stakeholders.
How to export a report from QuickBooks
- Open the desired report in QuickBooks
- Click on the “Export” button
- Choose your preferred format (CSV or XLSX)
- Select a location to save the exported file
While manual exports work well for occasional use, businesses that require frequent data updates or real-time reporting can benefit from using Coefficient.
Coefficient is a powerful tool that integrates seamlessly with QuickBooks, allowing for effortless and automated data exports to spreadsheets like Google Sheets and Microsoft Excel.
Key benefits of using Coefficient for QuickBooks exports:
- Real-time data syncing
- Automated scheduled refreshes
- Custom data transformations
- Advanced filtering and sorting capabilities
Watch this video to see how Coefficient simplifies the process of connecting QuickBooks to your spreadsheets:
How to Build a Custom Report in QuickBooks
Creating custom reports in QuickBooks allows you to tailor your financial data to your specific business needs. Here’s a step-by-step guide to building a custom report in QuickBooks:
- Access the Reports Center:
- Go to the Reports menu in QuickBooks
- Select “Custom Reports” or “Customization”
- Choose a Report Type:
- Select the base report type you want to customize (e.g., Profit and Loss, Balance Sheet, Sales by Customer)
- Set the Date Range:
- Choose the time period for your report (e.g., This Month, Last Quarter, Custom Range)
- Customize Columns:
- Add or remove columns to display the specific data points you need
- Rearrange columns by dragging and dropping
- Apply Filters:
- Use filters to focus on specific data subsets (e.g., particular customers, products, or accounts)
- Adjust Display Settings:
- Modify how data is grouped or sorted
- Choose to show or hide subtotals and totals
- Format the Report:
- Customize fonts, colors, and header/footer information
- Add your company logo if desired
- Save and Name Your Custom Report:
- Give your report a descriptive name
- Save it for future use
- Schedule Regular Runs (optional):
- Set up automatic generation and email delivery of your custom report
Building Advanced Reports & Dashboards in QuickBooks
Let’s walk through creating a cash flow projection report that combines accounts receivable, accounts payable, and historical payment patterns. This type of report helps predict your future cash position.
Creating a Cash Flow Projection Report
Step 1: Gather Required Base Reports
First, you’ll need to pull several reports to get the necessary data:
- Accounts Receivable Aging Detail
- Go to Reports > All Reports > Accounts Receivable
- Select “A/R Aging Detail”
- Customize date range to include all open invoices
- Add columns: Due Date, Days Open
- Sort by: Customer, then Due Date
- Accounts Payable Aging Detail
- Go to Reports > All Reports > Accounts Payable
- Select “A/P Aging Detail”
- Add all open bills
- Add columns: Due Date, Terms
- Sort by: Due Date
- Payment History Report
- Go to Reports > Custom Reports
- Select “Transaction List by Customer”
- Filter for: Received Payments only
- Add columns: Original Invoice Date, Payment Date
- Date Range: Last 6 months
Step 2: Calculate Historical Payment Patterns
Since QuickBooks doesn’t automatically calculate this, you’ll need to:
- Export Payment History to Excel
- Click Export on the Payment History report
- Choose Excel format
- In Excel, calculate:
- Average days to pay per customer
- Payment probability by aging bucket
- Historical collection rate
- Create Aging Buckets
- Current
- 1-30 days
- 31-60 days
- 61-90 days
- Over 90 days
Step 3: Project Expected Cash Inflows
- For Each A/R Aging Bucket:
- Export A/R Aging Detail to Excel
- Sort by due date
- Apply historical collection rates
- Group by expected payment week
- Sum projected collections
- Adjust for Known Variations:
- Large customer payments
- Seasonal patterns
- Payment term changes
Step 4: Project Expected Cash Outflows
- From A/P Aging Report:
- Export to Excel
- Group bills by due date
- Add known recurring payments:
- Rent
- Utilities
- Payroll
- Loan payments
- Add Planned Expenditures:
- Upcoming purchase orders
- Scheduled payments
- Contract renewals
Step 5: Combine into Final Projection
Since QuickBooks can’t combine these reports natively, you’ll need to:
- Create a Weekly Projection Worksheet:
- Week 1-12 columns
- Sections for:
- Beginning cash
- Projected inflows
- Projected outflows
- Net cash position
- Add Formula Calculations:
- Weekly cash position
- Cumulative position
- Minimum cash threshold alerts
- Update Source Reports:
- Refresh all QuickBooks reports
- Re-export to Excel
- Update calculations
- Adjust projections
Step 6: Maintain and Update
The projection requires regular maintenance:
- Daily Updates:
- Log into QuickBooks
- Run fresh A/R and A/P reports
- Export new data
- Update Excel calculations
- Weekly Reviews:
- Compare projections to actuals
- Adjust collection rates
- Update payment patterns
- Modify future projections
Simplifying Cash Flow Projections with Coefficient
While the above process gives you detailed cash flow projections, it requires significant manual work and constant updating. Many businesses connect QuickBooks directly to their spreadsheets for a more streamlined approach.
Using a tool like Coefficient, you can:
- Pull live A/R and A/P data directly into your spreadsheet
- Maintain historical payment patterns automatically
- Refresh projections with a single click
- Create real-time cash flow dashboards
Automating QuickBooks Reporting
Automating your QuickBooks reporting can save time, reduce errors, and provide timely insights. Let’s explore the automation features available in QuickBooks and how Coefficient can further enhance these capabilities.
QuickBooks automation features
QuickBooks offers several built-in automation features for reporting:
- Scheduled Reports: Set up recurring reports to be automatically generated and emailed to specified recipients at regular intervals.
- Memorized Reports: Save customized report settings for quick access and consistent formatting.
- Bank Feeds: Automatically import and categorize transactions from linked bank accounts and credit cards.
- Rules: Create rules to automatically categorize recurring transactions based on specific criteria.
- Recurring Transactions: Set up automatic creation of regular invoices, bills, or journal entries.
While these features provide a good starting point for automation, many businesses find they need more advanced capabilities to fully streamline their reporting processes.
Real-time data syncing and scheduled refreshes
One of the most powerful features of Coefficient is its ability to provide real-time data syncing between QuickBooks and your spreadsheets. This means your reports and dashboards are always showing the most current financial data.
Additionally, Coefficient allows you to set up scheduled refreshes, ensuring your reports are updated at the frequency you need:
- Hourly updates for time-sensitive metrics
- Daily refreshes for regular reporting
- Weekly or monthly updates for long-term trend analysis
By leveraging these automation capabilities, you can:
- Reduce manual data entry and associated errors
- Save time on repetitive reporting tasks
- Ensure consistent and timely reporting across your organization
- Focus on analysis and decision-making rather than data preparation
Automating your QuickBooks reporting with Coefficient not only saves time but also provides more accurate and timely insights, enabling you to make data-driven decisions with confidence in 2026 and beyond.
Limitations of QuickBooks Reporting and How to Overcome Them
While QuickBooks serves as a fundamental accounting tool for many businesses, its reporting capabilities often fall short for growing organizations. Understanding these limitations is crucial for businesses looking to scale their financial operations effectively and make data-driven decisions.
Customization and Control Constraints
QuickBooks’ approach to report customization presents significant challenges for businesses requiring detailed financial analysis. While the platform offers standard reports, users frequently struggle to adapt these templates to their specific needs.
Creating department-specific reports or drilling down to granular product line details often requires complex workarounds. Most businesses end up spending hours manually modifying reports to get the insights they need.
The platform’s rigid structure makes it particularly difficult to implement multi-layered filters. Imagine trying to analyze sales data across different locations, product categories, and date ranges simultaneously—a task that should be simple but requires extensive manual work in QuickBooks.
Data Management and Performance Issues
As businesses grow and accumulate more financial data, QuickBooks’ performance limitations become increasingly apparent. The system struggles notably with large datasets, often resulting in sluggish performance or complete system crashes when generating comprehensive reports.
This challenge becomes particularly acute when attempting to analyze long-term financial trends. Many businesses find themselves breaking down their reporting into smaller time chunks just to get the system to work.
Common performance issues include:
- System timeouts during report generation
- Unpredictable load times for complex reports
- Crashes when handling multi-year data
- Difficulty maintaining consistent reporting schedules
Integration and Cross-System Analysis
Modern businesses rely on multiple systems to run their operations efficiently. However, QuickBooks’ limited integration capabilities create significant obstacles in generating comprehensive financial insights.
Connecting QuickBooks with CRM systems, inventory management software, or project management tools often requires manual intervention. This limitation forces many organizations to maintain separate spreadsheets and manually transfer data between systems.
The result? Teams spend countless hours on data entry and consolidation. What should be a seamless flow of information becomes a time-consuming exercise in data management.
Complex Business Structure Support
For businesses with multiple entities or locations, QuickBooks’ reporting capabilities prove especially restrictive. Creating consolidated reports across different business units often requires maintaining separate QuickBooks instances.
Consider a business with three locations trying to understand their overall performance. Instead of pulling a single comprehensive report, they need to export data from each location individually and manually combine it.
Permission settings add another layer of complexity. QuickBooks offers limited options for controlling who can access and modify reports, making it difficult to:
- Restrict access to sensitive financial data
- Delegate report creation tasks
- Customize user permissions based on roles
- Manage team collaboration effectively
Free QuickBooks Reporting Dashboards
To help businesses leverage their QuickBooks data more effectively, Coefficient offers a range of free, ready-to-use reporting templates and dashboards. These templates are designed to work seamlessly with QuickBooks data and can be easily customized to suit your specific business needs.
#1 Cash Runway Template
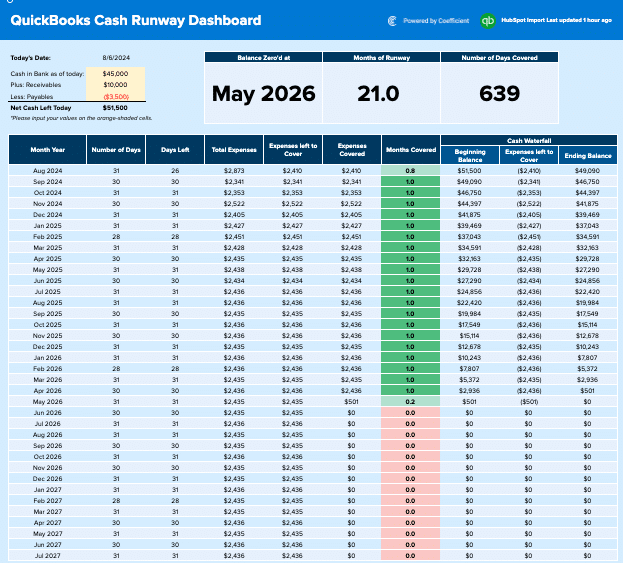
The Cash Runway Template is an essential tool for businesses focused on cash flow management and forecasting. This report provides a clear picture of how long your current cash reserves will last based on your current burn rate and projected income.
Use case: Cash flow management and forecasting
Key metrics tracked:
- Current cash balance
- Monthly burn rate
- Projected income
- Estimated runway (in months)
While QuickBooks doesn’t provide a built-in Cash Runway Template, you can create one using the data exported from QuickBooks. Tools like Coefficient offer pre-built templates that can be easily connected to your QuickBooks data for real-time cash runway analysis.
Get the QuickBooks Cash Flow Projections Template
#2 Quickbooks Profit and Loss Dashboard

The Profit and Loss (P&L) Dashboard is a cornerstone of financial performance analysis in QuickBooks. It provides a comprehensive overview of your company’s revenues, costs, and expenses over a specified period.
Use case: Financial performance analysis
Key metrics tracked:
- Total revenue
- Cost of goods sold (COGS)
- Gross profit
- Operating expenses
- Net income
QuickBooks offers a built-in P&L Dashboard, which can be customized to suit your specific needs. However, for more advanced analysis and visualization, many businesses opt to export this data and create custom dashboards using tools like Coefficient.
Access the QuickBooks Profit and Loss Dashboard
#3 SaaS P&L Template
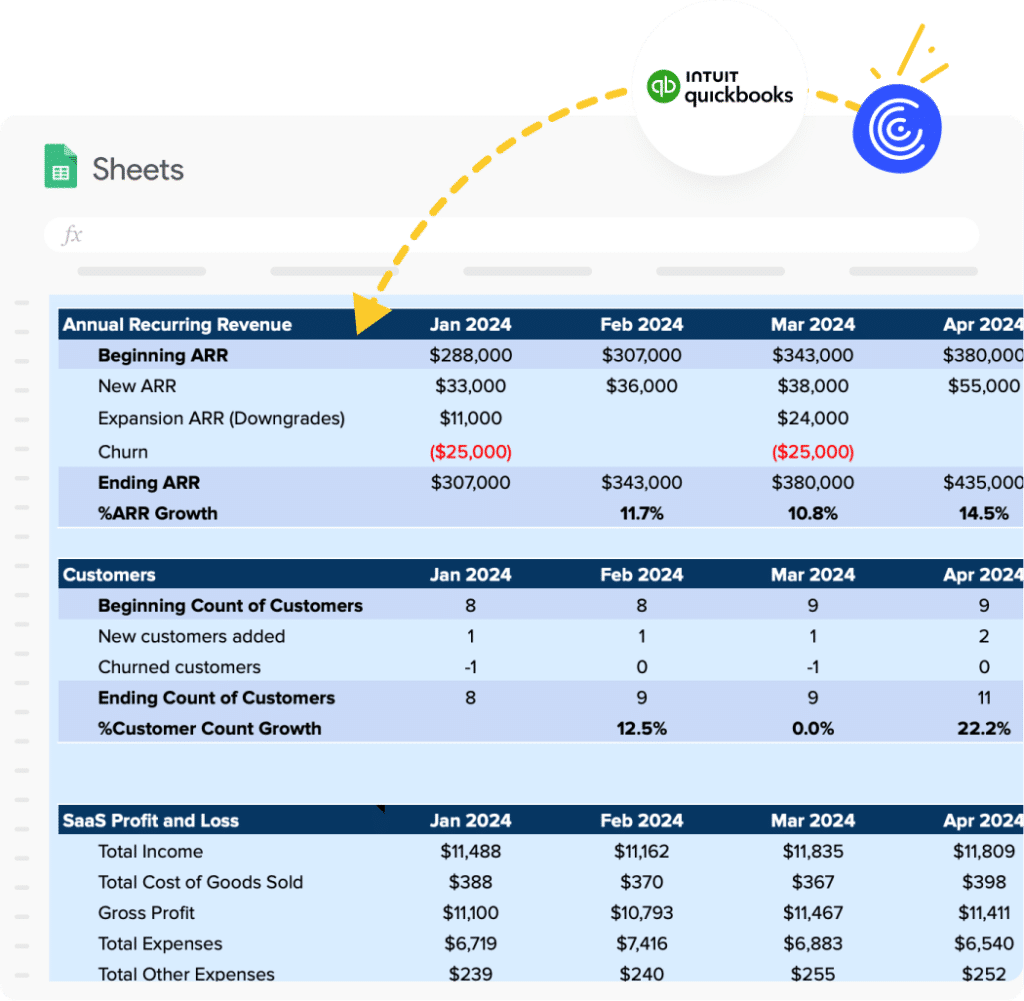
For Software as a Service (SaaS) companies, a specialized P&L template is crucial for accurately tracking and analyzing financial performance. The SaaS P&L Template incorporates metrics specific to the SaaS business model.
Use case: SaaS financial analysis
Key metrics tracked:
- Monthly Recurring Revenue (MRR)
- Annual Recurring Revenue (ARR)
- Customer Acquisition Cost (CAC)
- Lifetime Value (LTV)
- Churn rate
You can access a comprehensive SaaS P&L Template designed to work seamlessly with QuickBooks data at Coefficient’s SaaS Profit and Loss Template.
#4 QuickBooks Accounts Payable Template
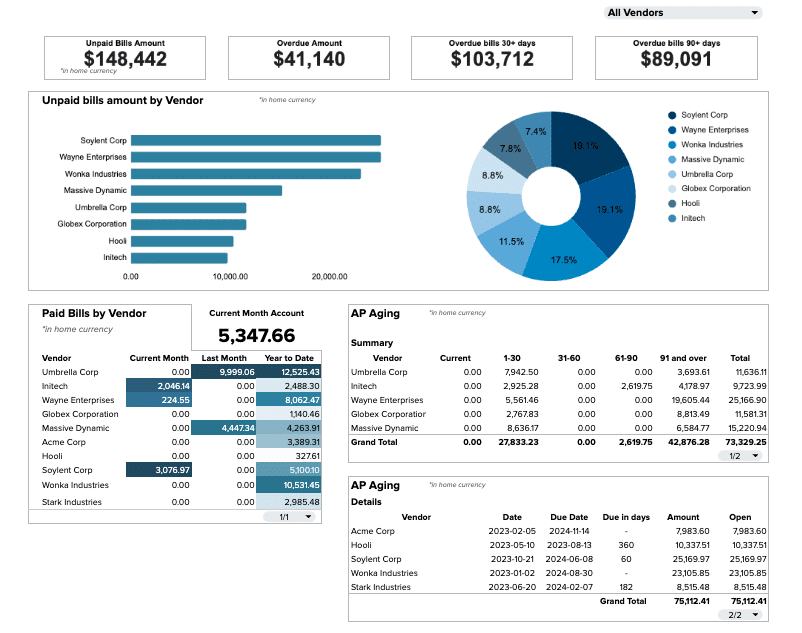
Effective vendor payment management is crucial for maintaining healthy business relationships and cash flow. The Accounts Payable Template helps you track and manage your outstanding bills and payments to vendors.
Use case: Vendor payment management
Key metrics tracked:
- Total outstanding payables
- Payables aging
- Upcoming due dates
- Payment history
Coefficient offers a ready-to-use QuickBooks Accounts Payable Dashboard that you can find here. This template provides a comprehensive view of your accounts payable, helping you stay on top of your vendor payments.
#5 QuickBooks Accounts Receivable Dashboard
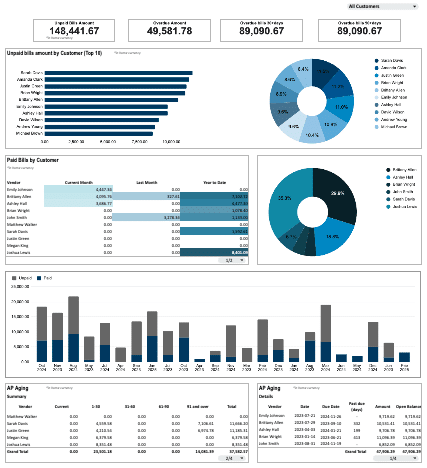
Tracking customer payments is essential for maintaining a healthy cash flow. The Accounts Receivable Dashboard helps you monitor outstanding invoices and customer payment patterns.
Use case: Customer payment tracking
Key metrics tracked:
- Total outstanding receivables
- Receivables aging
- Average days to pay
- Collection rate
While QuickBooks provides basic accounts receivable reports, many businesses benefit from creating more detailed dashboards using tools like Coefficient, which allow for deeper analysis and customization.
Get Started with the QuickBooks Accounts Receivable Dashboard
#6 QuickBooks Inventory Management Dashboard

For businesses dealing with physical products, effective inventory management is crucial. The Inventory Management Dashboard helps you optimize your stock levels and prevent stockouts or overstocking.
Use case: Inventory optimization
Key metrics tracked:
- Current stock levels
- Reorder points
- Turnover rate
- Days of inventory on hand
QuickBooks offers basic inventory reports, but for more advanced inventory management, consider exporting your data to create custom dashboards that provide deeper insights into your inventory performance.
Optimize Your Inventory with the QuickBooks Inventory Management Dashboard
#7 QuickBooks Online (QBO) Revenue Dashboard
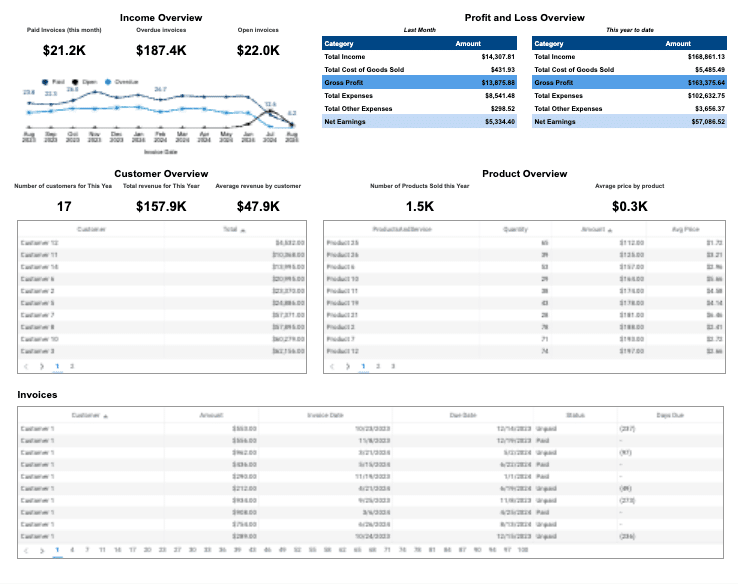
A detailed revenue dashboard is essential for analyzing your income streams and forecasting future revenue. The QBO Revenue Dashboard provides a comprehensive view of your business’s revenue performance.
Use case: Revenue analysis and forecasting
Key metrics tracked:
- Total revenue
- Revenue by product/service
- Revenue growth rate
- Average revenue per customer
You can access a free, ready-to-use QBO Revenue Dashboard template at Coefficient’s QBO Revenue Dashboard. This template connects directly to your QuickBooks Online data, providing real-time insights into your revenue performance.
#8 – QuickBooks Cashflow Template
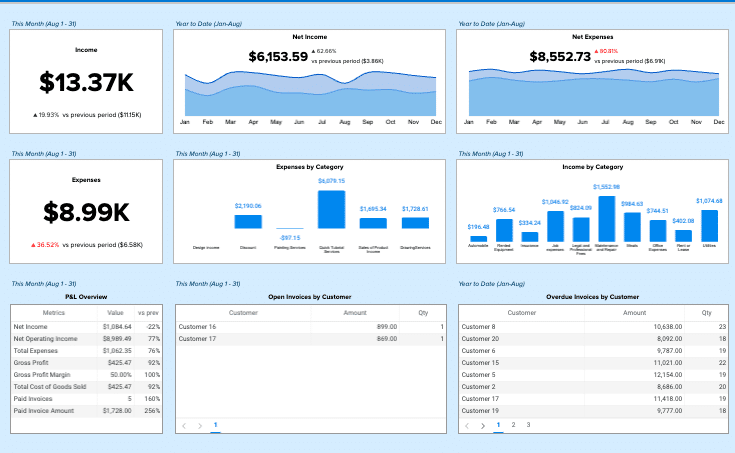
Cash flow management is critical for business survival and growth. The QuickBooks Cashflow Template helps you track and forecast your cash inflows and outflows.
Use case: Cash flow management
Key metrics tracked:
- Operating cash flow
- Investing cash flow
- Financing cash flow
- Net cash flow
Coefficient offers a free QuickBooks Cashflow Template that you can find here. This template provides a clear view of your cash flow situation, helping you make informed financial decisions.
Take Your QuickBooks Reporting to the Next Level
Creating effective reports in QuickBooks requires understanding both its capabilities and limitations. While QuickBooks provides essential financial reporting tools, growing businesses often need more flexibility and automation to get the insights they need.
The right tools can transform how you handle financial reporting, turning hours of manual work into automated, real-time insights. By combining QuickBooks’ robust financial data with modern reporting solutions, you can build reports that actually drive business decisions.
Ready to take your QuickBooks reporting to the next level? Get started with Coefficient today and unlock the full potential of your financial data.
FAQs
Can you create a dashboard in QuickBooks?
Yes, you can create dashboards in QuickBooks. While QuickBooks offers some built-in dashboard features, you can create more customized and flexible dashboards by exporting your QuickBooks data to tools like Coefficient, which allows you to build advanced dashboards in familiar spreadsheet environments.
How do I customize my QuickBooks Online dashboard?
To customize your QuickBooks Online dashboard, go to the dashboard and click on the “Customize” button. From there, you can add, remove, or rearrange widgets to suit your needs. For more advanced customization, consider using Coefficient to create fully customized dashboards based on your QuickBooks data.
What is the purpose of the QuickBooks dashboard?
The QuickBooks dashboard serves as an all-in-one tool for viewing and controlling your business finances in real-time. It provides an overview of key financial metrics, helps you track incoming and outgoing payments, and allows you to perform core business actions quickly and easily. With Coefficient, you can enhance this functionality by creating more detailed and customized dashboards.
What data is displayed on the dashboard of QuickBooks Online?
The QuickBooks Online dashboard typically displays information about invoices, sales, expenses, and a basic profit and loss graph. It also shows banking information for connected accounts. However, by using Coefficient with QuickBooks, you can create dashboards that display any data from your QuickBooks account, providing more comprehensive and tailored insights for your business.
Related Articles
- How to Connect QuickBooks to Excel
- How to Connect QuickBooks to Google Sheets
- Export QuickBooks Data to Google Sheets
- QuickBooks Integration with Google Sheets
- QuickBooks Integration with Excel


