


Table of Contents
![]()
- 1. The way you manage sales pipeline is broken—here’s how to fix it for good
- 2. If your sales pipeline stages don’t make sense, your forecast won’t either
- 3. Creating a Sales Pipeline Dashboard in Google Sheets
-
4. Top 7 Sales Pipeline Metrics You Can’t Ignore
- What is a Sales Pipeline?
- Importance of Tracking Sales Pipeline Metrics
- Top 7 Sales Pipeline Metrics and KPIs to Track
- 1. Number of Qualified Opportunities
- 2. Average Sales Cycle
- 3. Quota Attainment
- 4. Average Deal Size
- 5. Sales Pipeline Velocity
- 6. Win Rate
- 7. Win Rates by Source
- Decoding Sales Pipeline Metrics for Success
- 5. How to Build a Sales Pipeline Tracker in Google Sheets (Free Template)
- 6. Sales Funnel Templates You Can Sync Live Data Into in A Few Clicks
- 7. B2B Sales Pipeline Coverage – From Prospect to Profits (Insights from RevOps Expert)
- 8. Comparing Best Free and Paid Sales Pipeline Management Tools
- 9. 3 Quick Tips to Improve Sales Pipeline Management & Tracking
- 10. Bad CRM pipeline management slows you down. Here’s how to fix it.


Sales pipeline metrics are more than just buzzwords; they’re the backbone of an effective sales process. However, not all metrics drive results. While some enhance sales strategies and guide reps, others merely offer surface-level insights.
So, which sales metrics should you prioritize tracking in your CRM? We’ve pinpointed the top seven sales pipeline metrics that genuinely impact growth.
Let’s dive in!
What is a Sales Pipeline?
A sales pipeline represents the stages that a prospect goes through, from initial contact to closing a deal. It’s a visual representation of your sales process, guiding your team through the journey of converting leads into loyal customers.
A well-structured sales pipeline allows you to track and manage each stage of the average sales cycle length, enabling you to optimize your efforts for maximum results.
Importance of Tracking Sales Pipeline Metrics
Effective sales pipeline coverage and management goes beyond mere intuition – it’s about data-driven decision-making.
Tracking sales pipeline metrics with dashboards provides you with actionable insights into your team’s performance, enabling you to identify bottlenecks, streamline processes, and allocate resources efficiently.
Top 7 Sales Pipeline Metrics and KPIs to Track
- Number of Qualified Opportunities: The count of potential deals that have progressed to pipeline stages where they are considered qualified and likely to convert into customers.
- Avg. Deal Size: The average value of deals closed within a specific timeframe, providing insights into deal quality and revenue potential.
- Sales Velocity: The rate at which deals progress through various pipeline stages over a specific period of time, underscoring potential bottlenecks and areas for improvement.
- Win Rate: The percentage of qualified opportunities that successfully result in closed deals, reflecting the team’s effectiveness in converting leads.
- Customer Acquisition Cost (CAQ) to Lifetime Value (LFT) Ratio: The relationship between the cost of acquiring a new customer and their potential lifetime value, indicating efficiency in navigating through the sales funnel and retention.
- Average Sales Cycle: The average time it takes for a lead to progress through various pipeline stages, revealing the efficiency of the sales process.
- Marketing Qualified Lead (MQL) to Sales Qualified Lead (SQL) Conversion Rate: The percentage of marketing-qualified leads successfully transitioning to sales-qualified leads, showcasing the alignment between marketing and sales efforts.
1. Number of Qualified Opportunities
Assessing the Number of Qualified Opportunities is key to evaluating your SaaS sales effectiveness. Combined with insights from Customer Lifetime Value (CLV), deals, and leads, it guides refined sales strategies.
Who Owns the Metric: The Sales Development team typically is responsible for this metric, spearheading the early stages of lead engagement.
Tracking Frequency: A weekly review of the number of qualified opportunities is recommended.
Free Tracking Template
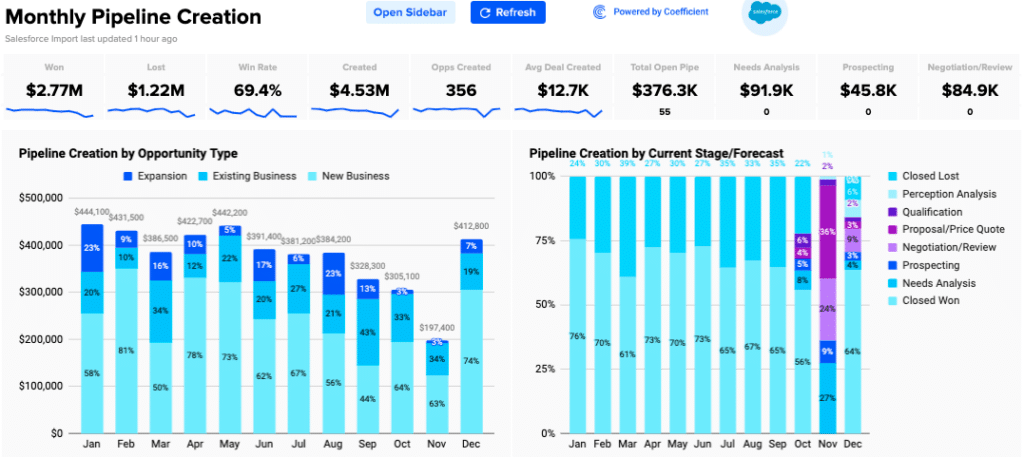
Download Coefficient’s free Pipeline Creation Dashboard to stay on top of your pipeline.
Tips to Improve Qualified Opportunities
- Prospecting: Effective prospecting is the foundation of a healthy sales pipeline. Invest time in thorough market research to identify potential leads that align with your target customer profile.
- Lead Qualification: Train your sales development team to qualify leads based on predefined criteria rigorously. This ensures that only leads with a genuine interest and potential to convert are advanced to the next stages of the pipeline.
2. Average Sales Cycle
Average Sales Cycle gauges the duration from a lead’s first engagement to the final deal closure. Alongside metrics such as churn rate, it illuminates the effectiveness of a sales process. Grasping this cycle enables businesses to optimize lead management, opportunity volume, and sales outcomes.
Who Owns the Metric: The Sales Operations team typically tracks the Average Sales Cycle.
Tracking Frequency: Monthly monitoring of the Average Sales Cycle is vital, allowing for agile adjustments to marketing strategies based on real-time insights.
Free Tracking Template
Coefficient offers a free Average Sales Cycle tracking template designed to connect you to your Salesforce data to track edits and changes over any period.
Tips to Improve Average Sales Cycle
- Sales Automation: Embracing sales automation tools can significantly reduce the time spent on repetitive and administrative tasks. By automating tasks like data entry, follow-up emails, and appointment scheduling, you can expedite the sales process and shorten the overall sales cycle.
- Better Communication: Effective communication between your sales and marketing teams is crucial for streamlining the customer journey. When both teams are aligned and well-informed about leads’ interactions, preferences, and pain points, they can collectively work towards a smoother and quicker conversion process.
- Optimizing Sales Strategies for SaaS Success: For SaaS companies, leveraging automation tools optimizes sales opportunities and boosts revenue growth. Pipeline analysis in real-time is essential, guiding strategies effectively. Tracking sales opportunities over time, combined with precise pipeline value insights, enables informed decisions. This data-driven approach, coupled with aligned sales and marketing efforts, accelerates conversions in the competitive SaaS realm.
3. Quota Attainment
Quota Attainment measures the percentage of sales targets met or exceeded by the sales team within a specific timeframe. It evaluates the effectiveness of sales strategies, the productivity of sales reps, and the overall health of the sales pipeline.
Who Owns the Metric: Quota Attainment metrics are typically owned by Sales Leadership and Sales Operations teams. These teams are responsible for setting the quotas, tracking performance against these quotas, and implementing strategies to ensure these targets are met.
Tracking Frequency: It’s essential to track Quota Attainment on a monthly basis. This allows sales teams to make necessary adjustments to their strategies and efforts to ensure they are on track to meet or exceed their sales targets by the end of the quarter or year.
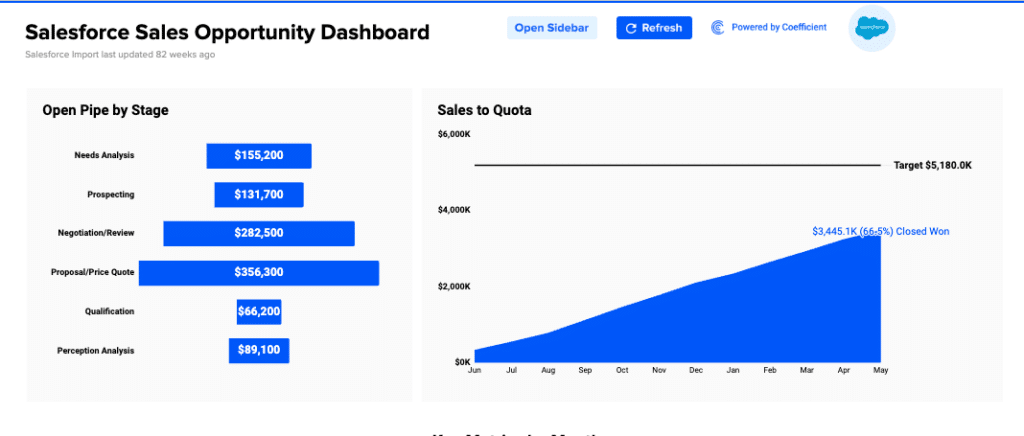
Free Tracking Template
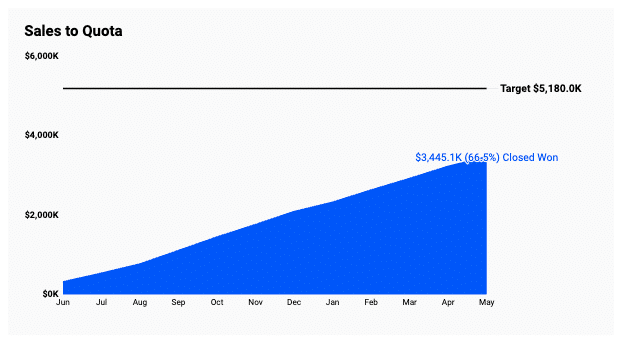
Enhance the tracking and analysis of Quota Attainment with Coefficient’s Sales Dashboard Template. This tool offers seamless integration with your live sales data for real-time insights, making sales management more efficient and effective.
Tips to Improve
- Regular Performance Reviews: Hold regular review sessions with sales representatives to assess their progress towards their quotas and provide constructive feedback.
- Training and Development: Offer continuous training and development opportunities to enhance the sales skills of your team members.
4. Average Deal Size
Average Deal Size measures the average monetary value of the deals successfully closed within a specific time frame. It provides essential insights into the quality and potential revenue generated by individual deals. By understanding the average deal size, you can evaluate the impact of your sales efforts and make more accurate revenue forecasts.
Who Owns the Metric: The ownership of the Average Deal Size metric typically resides within the Sales Leadership team. This team oversees the strategic direction of sales efforts and assesses the value and significance of individual deals.
Tracking Frequency: It’s advisable to monitor the Average Deal Size metric quarterly. This frequency allows you to identify shifts in customer preferences or market demand and respond accordingly.
Free Tracking Template
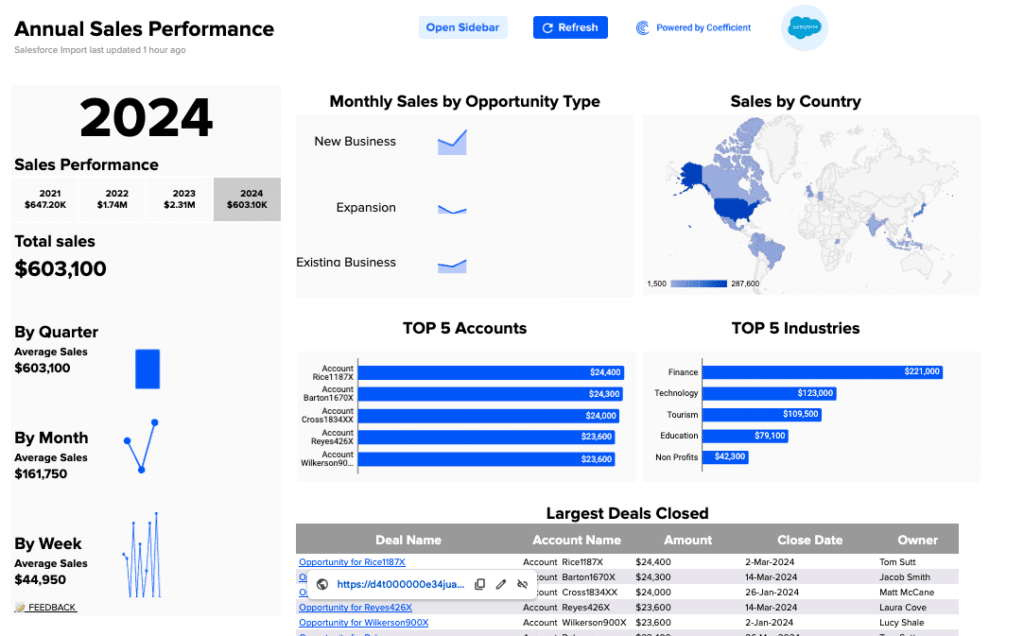
Coefficient’s free Salesforce Sales Performance Dashboard tracks key sales performance by year, by quarter, by month, or by week, in a single spreadsheet.
Tips to Improve Average Deal Size
- Upselling: Train your sales team to identify opportunities for upselling proactively. Encourage them to understand the unique needs of each customer and effectively communicate the additional value that higher-tier offerings bring. By positioning upsells as solutions that address specific pain points, your team can increase the average deal size.
- Bundling: Create product bundles or packages that combine complementary products or services. By offering customers a comprehensive solution that addresses multiple needs, you can incentivize them to invest in a larger deal size. Bundling not only increases the perceived value of the offering but also encourages customers to explore more extensive options.
5. Sales Pipeline Velocity
Sales Pipeline Velocity offers insights into the pace at which deals progress through your sales pipeline. It considers the time that leads spend in each stage of the pipeline, helping you identify bottlenecks, inefficiencies, and areas where your sales process can be optimized for quicker conversions.
Who Owns the Metric: The responsibility for tracking and improving the Sales Pipeline Velocity metric typically falls under the purview of the Sales Operations team. These professionals are dedicated to enhancing the efficiency and effectiveness of your sales process.
Tracking Frequency: It’s advisable to monitor the Sales Pipeline Velocity metrics monthly. This frequency allows you to identify trends and anomalies in the speed of deal progression.
Free Tracking Template
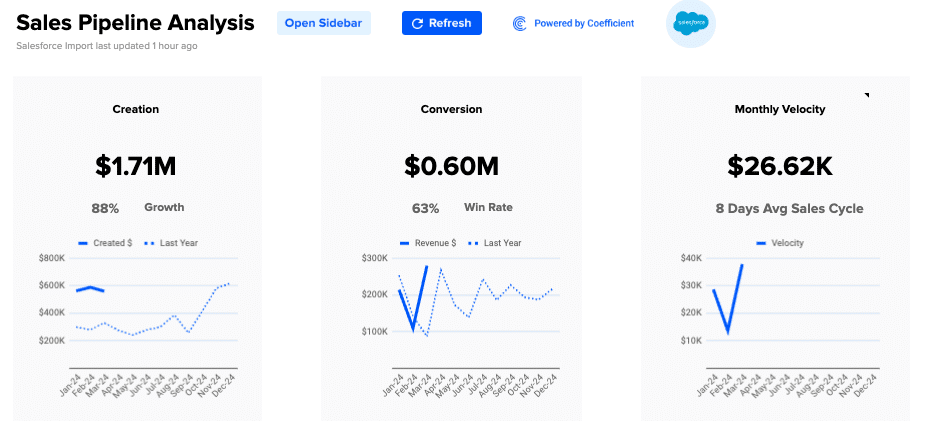
Coefficient’s free Salesforce Pipeline Analysis Dashboard instantly populates with your live data, allowing you to track sales key metrics like Pipeline Creation and Sales Velocity.
Tips to Improve Sales Pipeline Velocity
- Sales Training: Continuous investment in training is essential to equip your sales team with the skills, knowledge, and techniques needed to navigate the pipeline efficiently. Regular training sessions can keep them updated on best practices and new strategies, ultimately contributing to faster deal progression.
- Streamlining Sales Processes and Ops: Regularly assess and refine your sales processes to eliminate any unnecessary or redundant steps that might slow down the sales cycle. Collaborate with your sales team to identify areas where processes can be streamlined and made more efficient.
6. Win Rate
Win Rate is a pivotal KPI measuring the percentage of qualified opportunities successfully converted into closed deals. It offers valuable insights into your sales team’s effectiveness in turning potential leads into paying customers. By calculating the Win Rate, you gain a deeper understanding of your team’s ability to navigate the sales process and close deals successfully.
Who Owns the Metric: The ownership of the Win Rate metric lies within the Sales team.
Tracking Frequency: It’s recommended to monitor the Win Rate metric weekly. This frequency allows you to respond promptly to any fluctuations and adapt your approaches accordingly.
Free Tracking Template
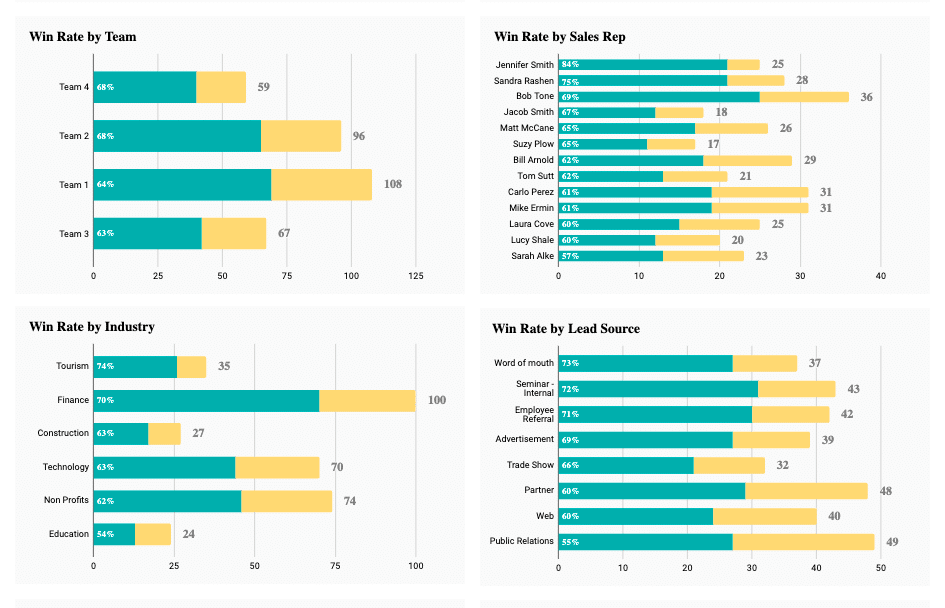
Coefficient’s free Win Rate tracking template is designed to monitor successful conversion rates across teams, individuals, industries, regions, and deal sizes.
Tips to Improve Win Rate
- Effective and Timely Follow-ups: Implement a structured follow-up process that ensures leads are engaged at the right time and in the right manner. By promptly responding to inquiries, addressing concerns, and providing relevant information, you increase the likelihood of successful conversions.
- Value Selling:Train your sales team to emphasize the unique value proposition of your products or services. Equip them with the knowledge and skills to address specific pain points and challenges that potential customers may have. By showcasing how your offering meets their needs, you can differentiate your solution and increase conversion rates.
7. Win Rates by Source
Win Rates by Source calculates the effectiveness of different lead sources based on the percentage of leads that convert into customers. It’s a crucial for understanding which marketing strategies and channels yield the highest converting leads, informing where to focus efforts and investment.
Who Owns the Metric: This metric falls under the purview of Marketing Operations and Sales Operations teams, who analyze the effectiveness of various lead generation sources and enhance strategic alignment between marketing and sales.
Tracking Frequency: Quarterly analysis of Win Rates by Source is recommended. This timeframe provides a substantial data set for impactful insights, allowing for strategic adjustments and optimizations.
Free Tracking Template
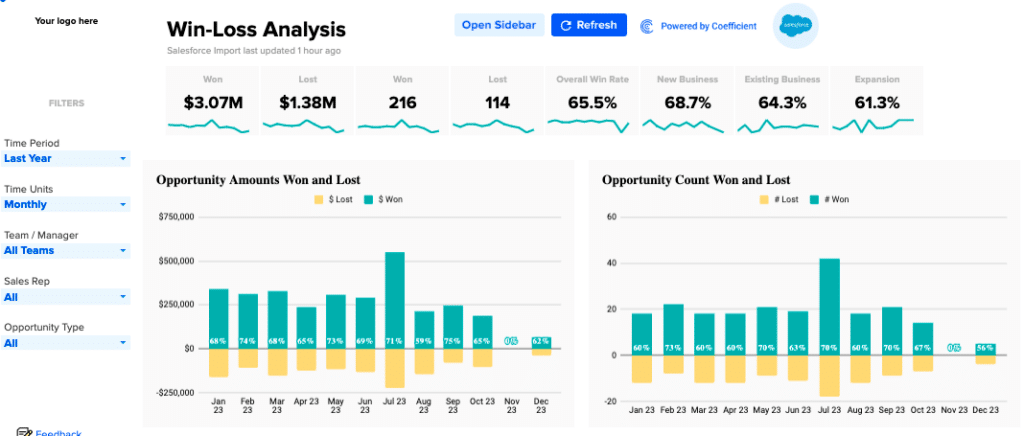
Dive into your win rates by source with Coefficient’s Win-Loss Analysis Template. This template integrates directly with your data for up-to-the-minute insights, enabling you to pinpoint which marketing and sales channels are bringing in the most successful deals.
Tips to Improve Win Rates by Source
- Refine Lead Qualification: Regularly review and refine your lead qualification criteria to ensure you’re focusing on high-potential sources.
- Invest in High-Performing Channels: Allocate more resources to lead sources that show higher win rates to maximize your ROI.
Decoding Sales Pipeline Metrics for Success
Data is essential in sales. By mastering the top seven sales pipeline metrics, you can empower your team to boost efficiency, increase revenue, and close more deals. Each metric provides insights into your sales process, assisting you in making strategic decisions.
Coefficient offers a suite of free dashboards and templates to make tracking sales pipeline metrics a breeze. Get started for free today and see how it seamlessly integrates with your pipeline management tools and workflows today.
