
Download template now
Free Price Volume Mix Analysis Template
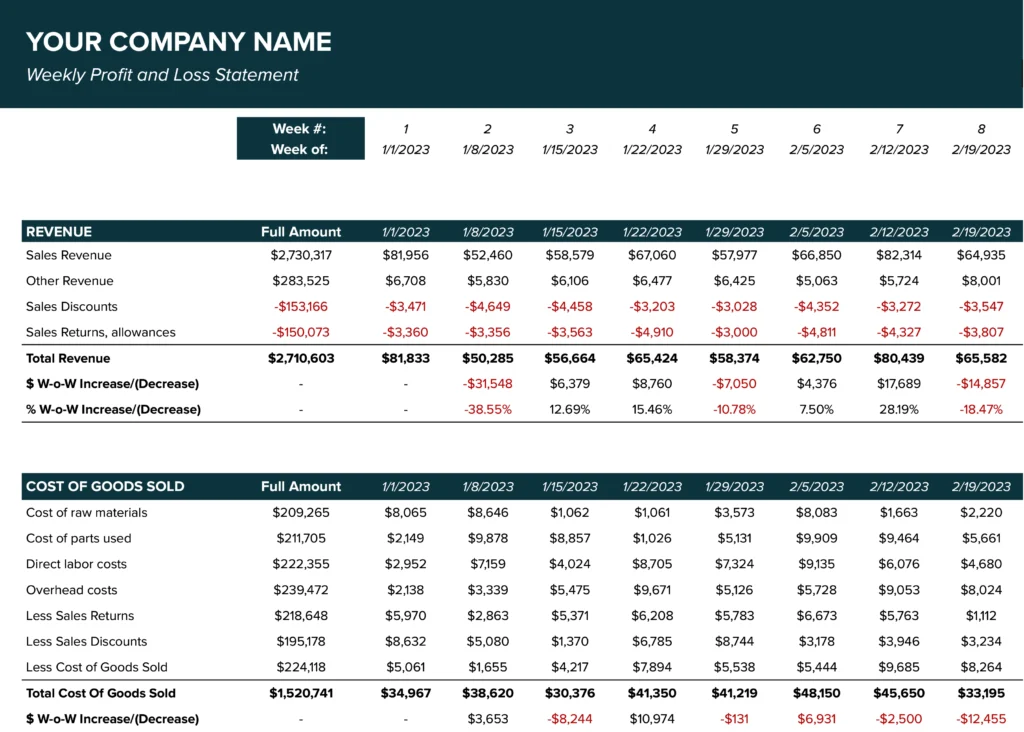
Break down revenue changes by price, volume, and product mix to understand what's truly driving your business performance.


More Profit and Loss Templates

Advanced Excel & Sheets Templates with Live Business Data
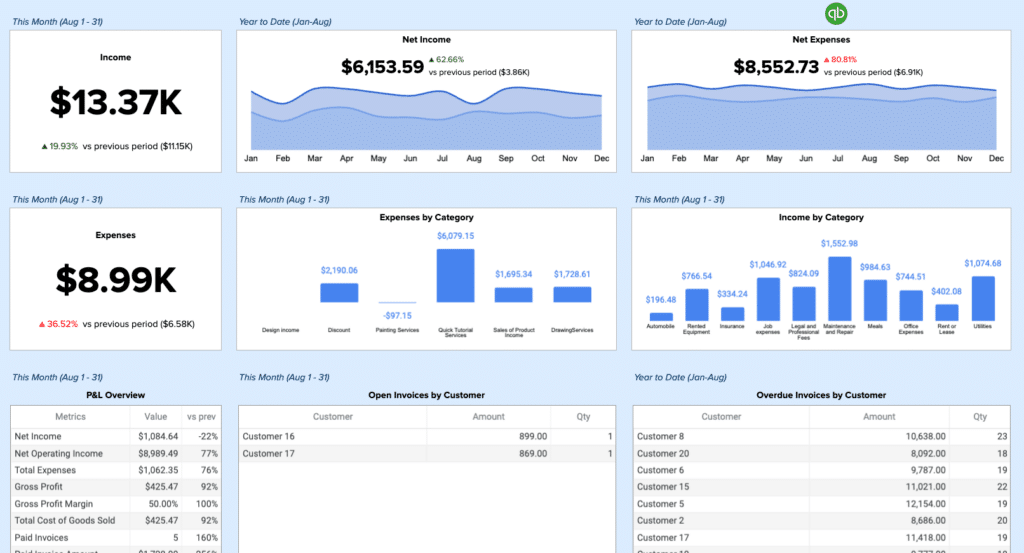
Free QuickBooks
Cashflow Template
Cashflow Template
Tracks sources of cash inflows and outflows and categorize them into operating,…
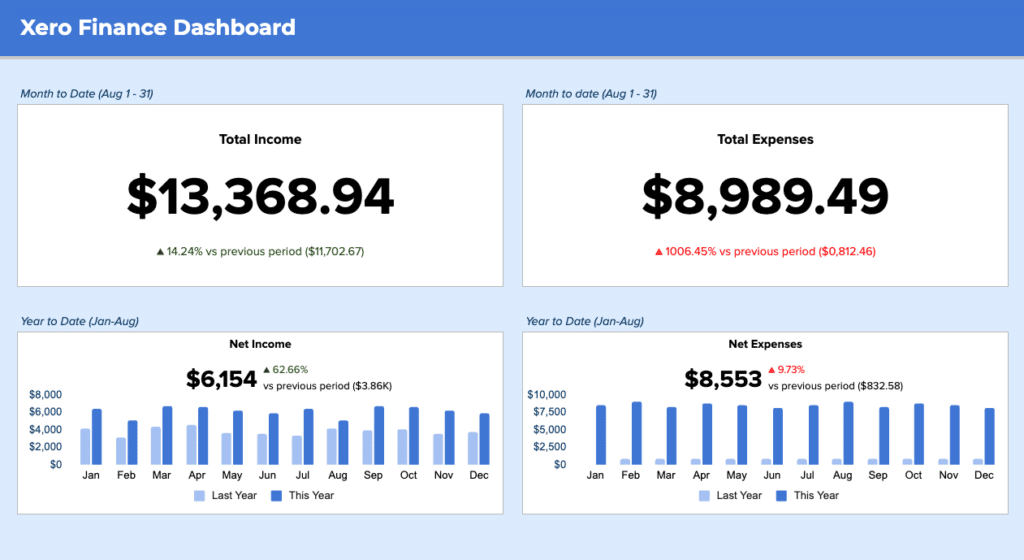
Free Xero Finance
Dashboard
Dashboard
Boost your financial insights with our free Xero finance dashboard template. Track…
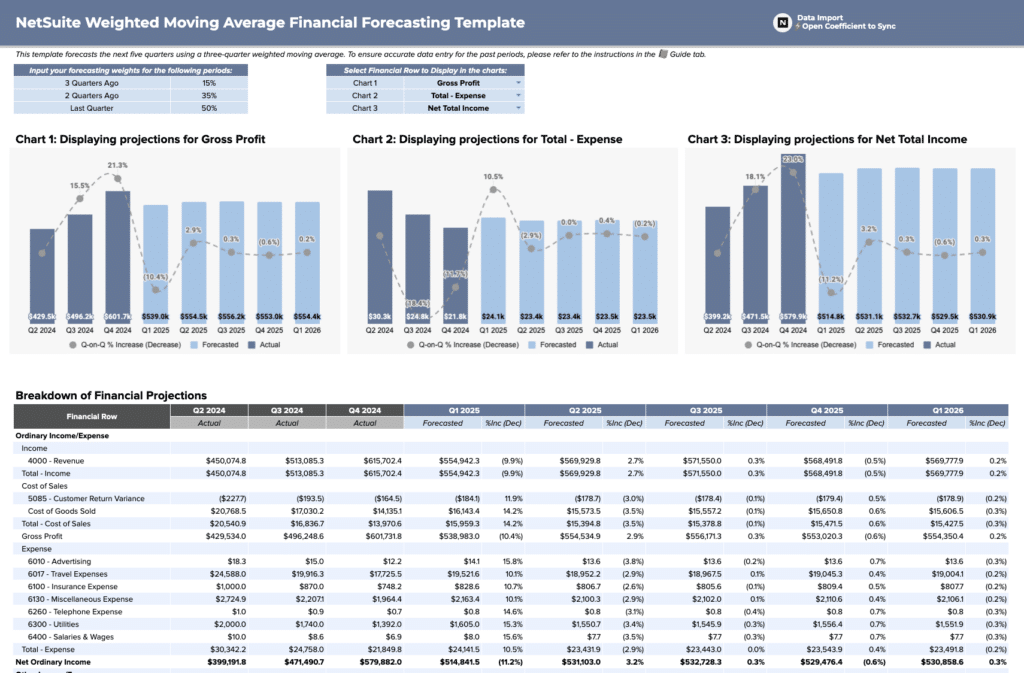
Free NetSuite Financial
Forecasting Template
Forecasting Template
Get real-time insights and accurate projections to drive business growth.
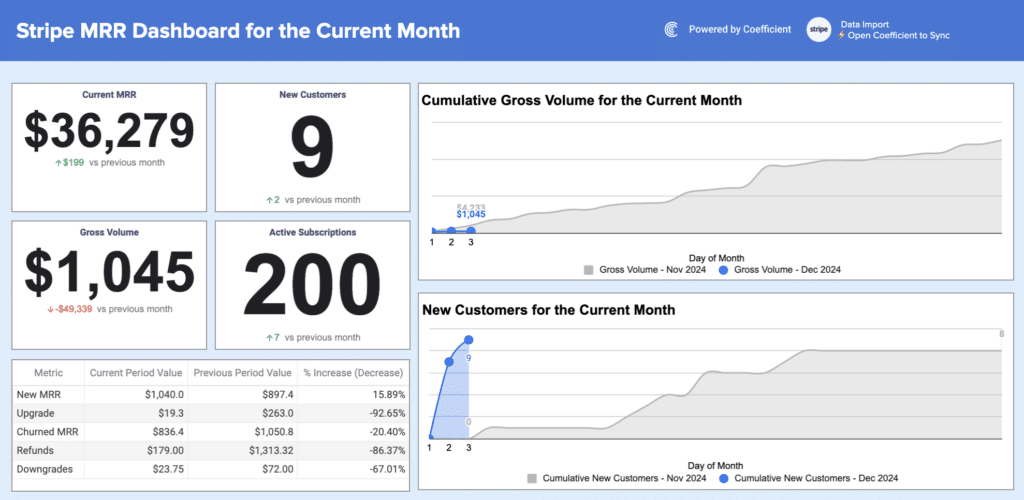
Stripe MRR
Dashboard
Dashboard
Track key metrics, visualize data, and make informed decisions to drive growth.
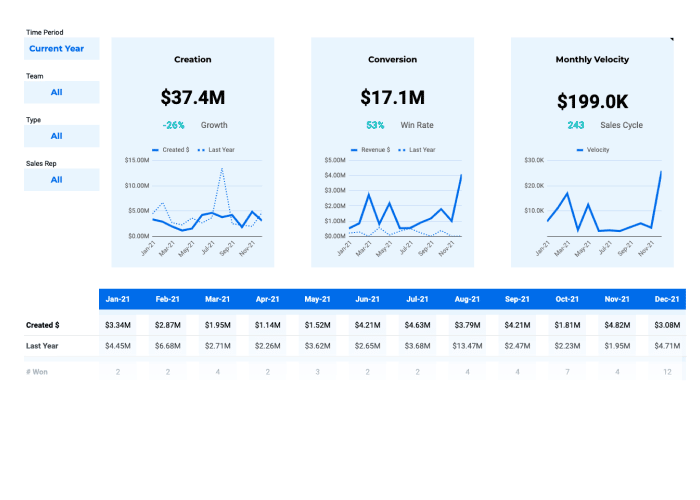
Salesforce Pipeline
Analysis Template
Analysis Template
Compare monthly results for pipeline creation, win rates, average deal age, and…
Browse Other Templates
Balance Sheet
Budget
Business Quote
Calendar
Cash Flow
Competitor Analysis
Content Calendar
Contract Tracking
Expense Reports
Finance Checklists
Income Statement
Inventory List
Invoices
Issue Tracking
Lead Tracking
Ledger
OKR
Pay Stub
Product Roadmap
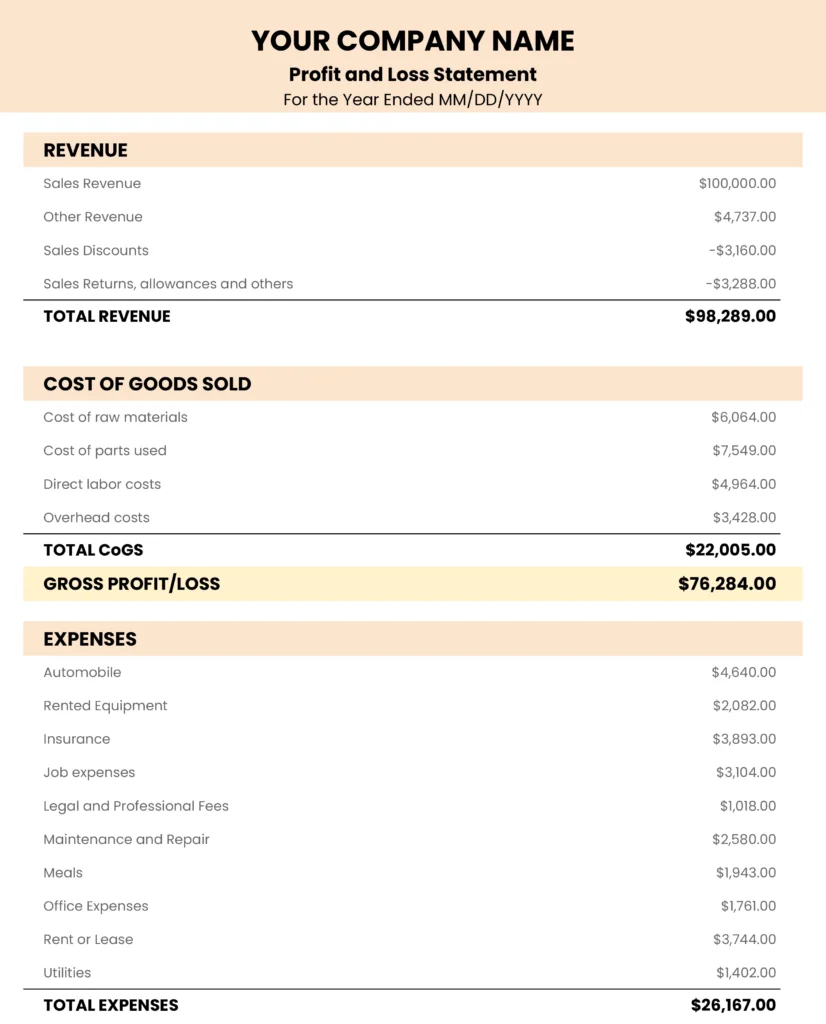
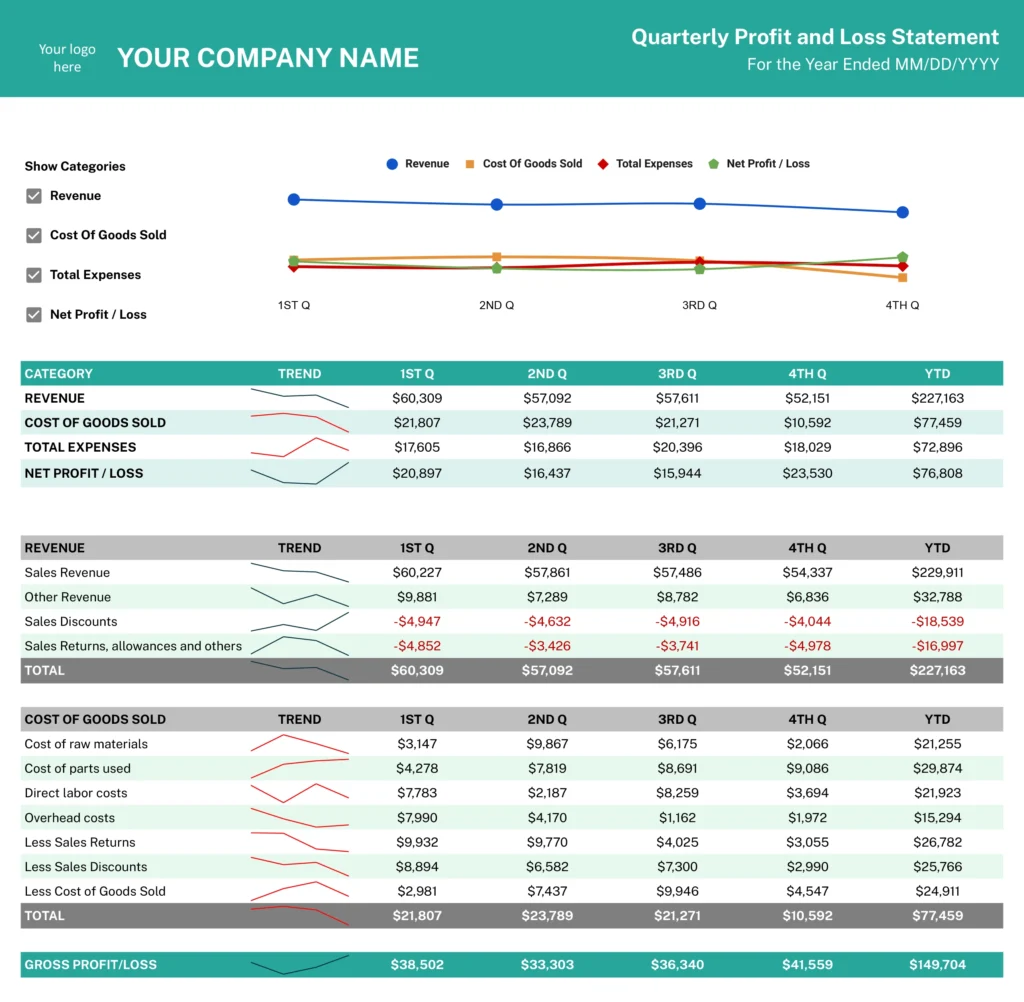
Profit and Loss
Project Status Reports
RACI
Receipts
SWOT Analysis
Timeline
Timesheet

Questions and Answers