In the realm of modern business, managing Salesforce data effectively is pivotal. Dashboards in Salesforce provide a clear picture of vital business data, guiding critical decisions.
As businesses expand, the volume of data and the need for efficient data management strategies become more pronounced.
This is where the concept of data archiving in Salesforce becomes crucial, particularly for Salesforce orgs grappling with storage costs and data overload.
The Importance of Data Archiving in Salesforce
Data archiving is not just about data storage; it’s a strategic approach to managing large data volumes in your Salesforce platform.
By archiving, you systematically store and manage less-used dashboards, ensuring quick access to current and vital information.
This process is integral to maintaining data integrity and data security, especially when dealing with custom objects and sensitive business data.
Why Archive Dashboards in Salesforce?
Archiving is more than a mere data storage technique; it’s a comprehensive data management strategy. It’s crucial for:
Improving User Experience: By archiving, Salesforce users navigate less clutter, leading to a more streamlined and efficient user interface.
Optimizing System Performance: The archiving process helps in managing storage limits and enhancing system performance.
Ensuring Data Security and Compliance: With concerns like GDPR, it’s essential to have robust data retention policies and data protection mechanisms in place.
Step-by-Step Guide to Archiving Dashboards in Salesforce
Archiving dashboards in Salesforce is a strategic way to maintain a clutter-free and efficient environment. Follow this comprehensive step-by-step guide to seamlessly archive dashboards and enhance the overall user experience.
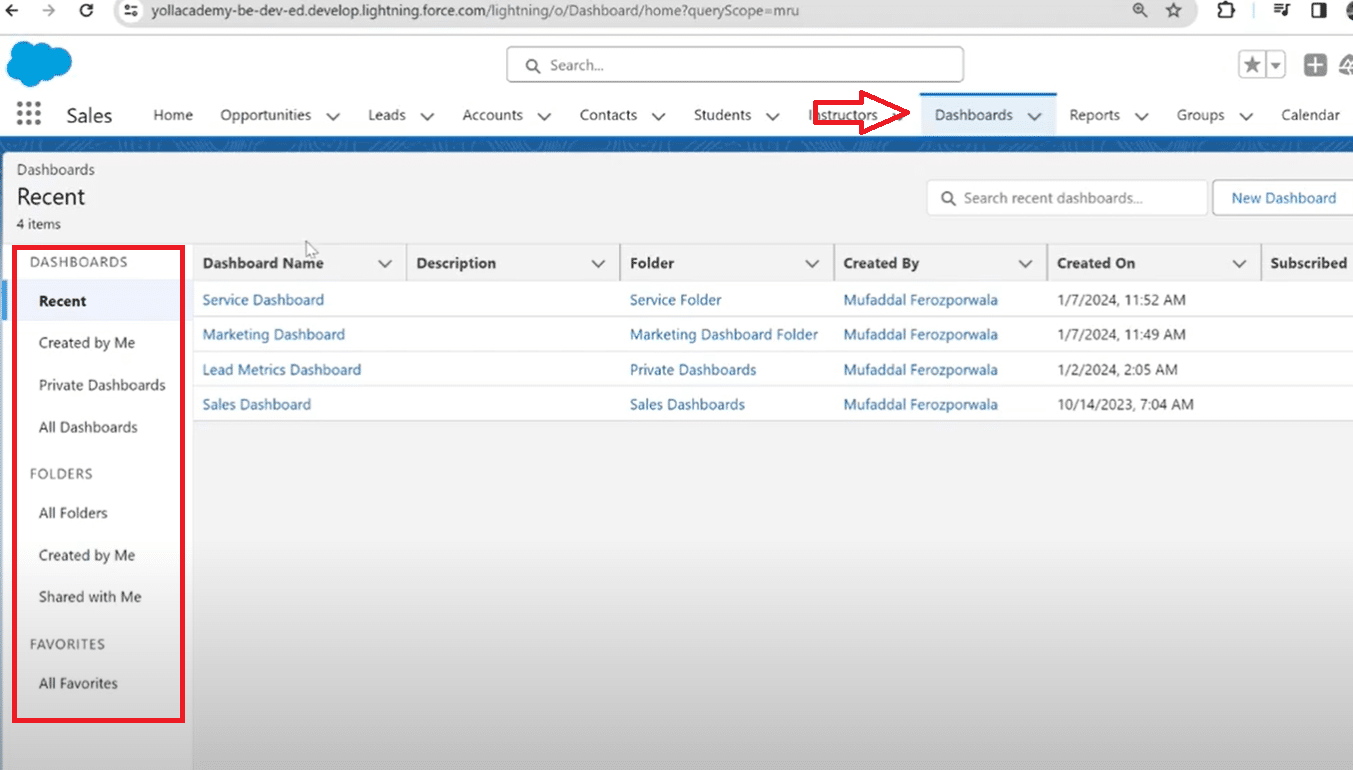
Step 1: Access Your Salesforce Dashboard
Log into your Salesforce account and navigate to the dashboard you want to archive, considering your data archiving strategy.
Click on the dashboard name to open it.
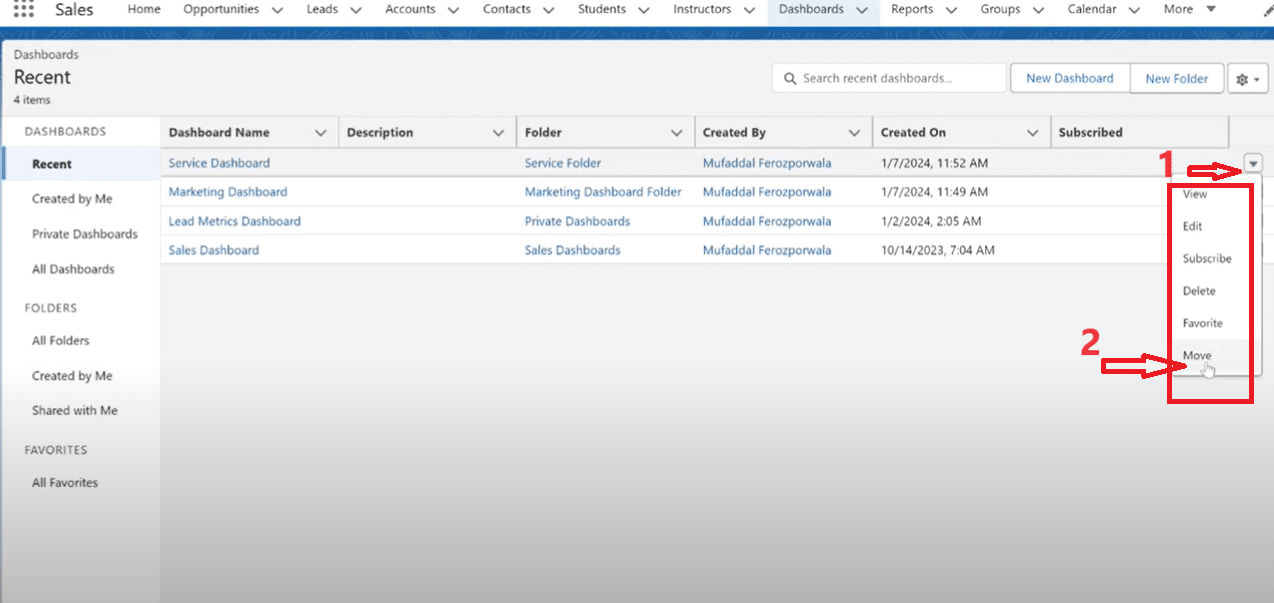
Step 2: Enter the Dashboard Editor
In the upper-right corner of the dashboard, locate the “Move” button.
Click on it.
Step 3: Select Components for Archiving
Identify the components on the dashboard that you want to archive. Choose the components based on data lifecycle, volume of data, and relevance.
Hover over a component, and click on the drop-down arrow in the upper-right corner.
Select “Archive Component” from the menu.
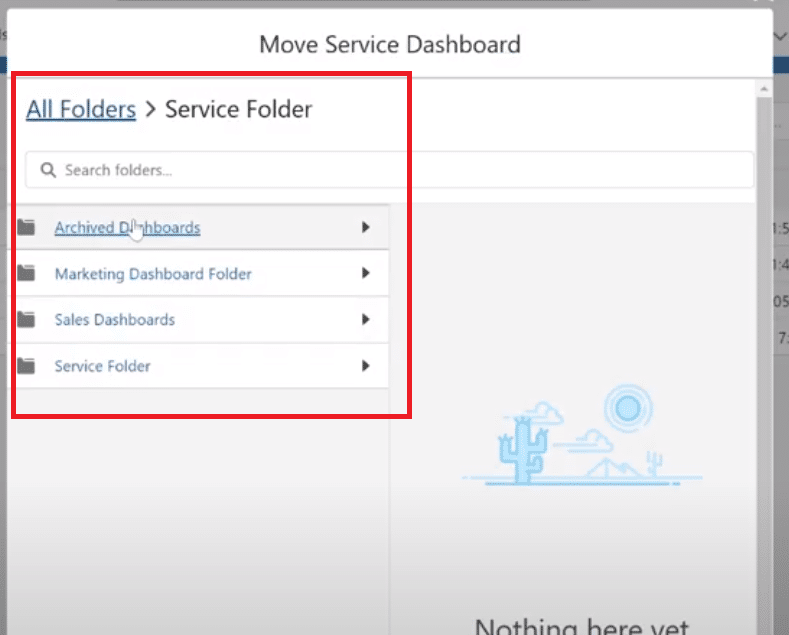
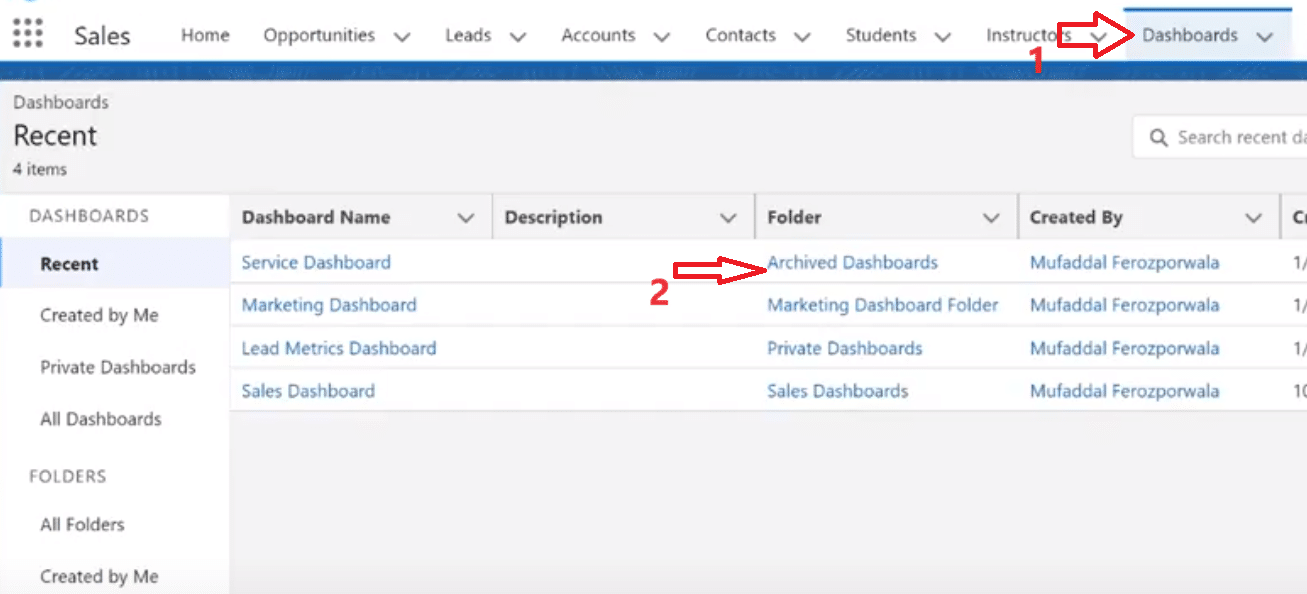
Step 4: View Archived Dashboards
To view your archived dashboards, navigate to the Salesforce Home page.
In the left sidebar, under the “Dashboards” tab, click on “Archived Dashboards.”
Here, you can access and manage all your archived components.
For a detailed video walk-through, check out our YouTube Tutorial.
Tips and Best Practices
Every business has unique needs. Tailor your archiving strategy to your specific use case, whether it’s handling large data volumes, maintaining data lifecycle, or customizing page layouts and functionality.
Ensuring data security and governance is paramount. Implementing data governance practices ensures compliance with regulations like GDPR. Regular data protection audits and adherence to data retention policies are essential.
Troubleshooting Common Issues
Here are the common problems you might encounter while archiving your dashboard on Salesforce and the best solution to troubleshoot them:
1. Access Denied Errors
Issue: Users may encounter “Access Denied” errors when attempting to archive dashboards.
Solution: Ensure that users have the necessary permissions to archive dashboards. Verify their roles and adjust permissions as needed in Salesforce settings.
2. Archived Dashboards Still Visible
Issue: Even after archiving, some users might still see the dashboards.
Solution: Clear browser cache and refresh the page. If the issue persists, double-check the archiving settings and confirm that the dashboards are properly archived.
3. Performance Issues After Archiving
Issue: Some users might experience performance issues after archiving a large number of dashboards.
Solution: Optimize dashboard components or consult Salesforce support for large data volume issues.
4. Loss of Data on Archived Dashboards
Issue: Users may worry about losing data when archiving dashboards.
Solution: Ensure that data backup practices are in place before archiving.
5. Dashboard Dependency Errors
Issue: Archiving a dashboard may lead to errors if it is dependent on other components or reports.
Solution: Identify dependencies before archiving and update or remove them accordingly. Ensure that all related components are compatible with the archiving process.
6. User Resistance to Change
Issue: Users may resist the change of archiving dashboards they are accustomed to.
Solution: Provide clear communication about the reasons for archiving and the benefits it brings. Offer training and support to help users adapt to the new system.
Conclusion
Archiving dashboards in Salesforce is a critical step in managing data effectively and optimizing system performance. By incorporating advanced tools like Coefficient, you can further streamline your Salesforce experience. Coefficient enhances data management, user experience, and ensures a more intuitive interface, perfectly aligning with the best practices of Salesforce data archiving.
Unlock the full potential of your Salesforce dashboards and elevate your decision-making processes effortlessly with Coefficient. Explore Coefficient and take your Salesforce data management to the next level.
For sales leaders, KPI dashboards allow them to make sense of the sales performance and chart strategy for the sales cycle.
Sales dashboards are often built in Salesforce CRM by the SalesOps team. But the inherent limitations of Salesforce reporting functionalities make it cumbersome for the SalesOps team to create and maintain dashboards.
That’s why many SalesOps turn to the flexibility of spreadsheets to build their Salesforce dashboards.
However, this requires SalesOps to not only build dashboards in their spreadsheets. SalesOps users must also continuously copy-and-paste fresh Salesforce data into their spreadsheets to keep the dashboards up-to-date.
That’s why we built our free dashboard templates for SalesOps. Our templates allow SalesOps to launch pre-built Salesforce dashboards in Google Sheets, powered by real-time data sync automation from their Salesforce CRM.
Here are the top 6 Salesforce KPI dashboards examples for sales leaders, along with pre-built Google Sheets templates for each one.
Video Walkthrough: How to Leverage Your Template
Once you’ve selected your template below, we’ve made the process incredibly simple to download your template and power it with your live data. Here’s a quick walkthrough of how it’s done.
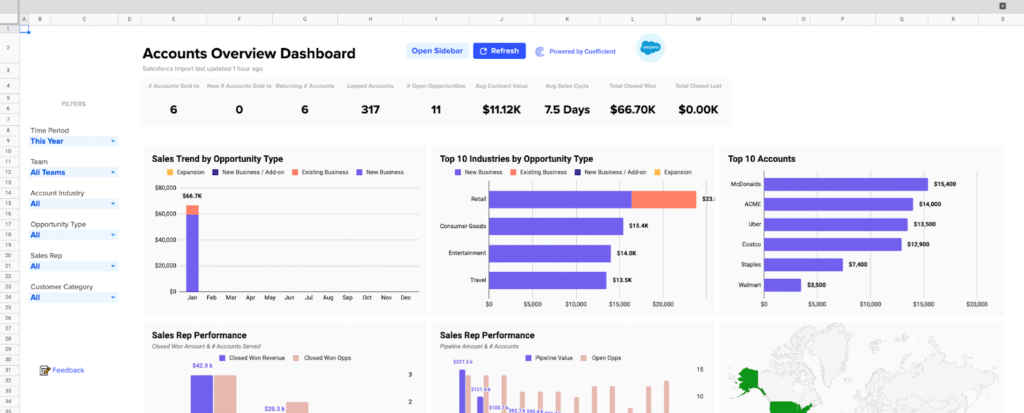
Accounts Overview Dashboard
Coefficient’s Accounts Overview Dashboard for Google Sheets is a centralized dashboard for all of your customer account metrics. You can dive deep into any of your accounts, and access pre-built visualizations directly in your Google spreadsheet.
The dashboard allows you to monitor activity, track sales rep performance, and win future deals for all of your different customer accounts. See open opportunities, closed lost, closed won timeline, and more.
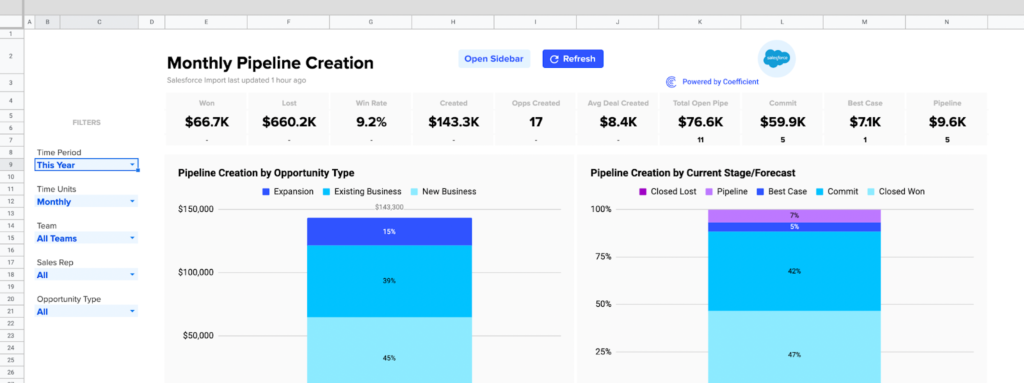
The Salesforce Pipeline Creation Dashboard offers a definitive view of pipeline creation, replete with visualizations, inside your Google spreadsheet. Now you can track how your reps and teams are generating pipe, based on your live Salesforce data, all from your Google spreadsheet.
Monitor critical sales KPIs by day, week, or month, so you can modify sales strategy, augment sales qualified opportunities, and drive more revenue. Download the free Salesforce dashboard below!
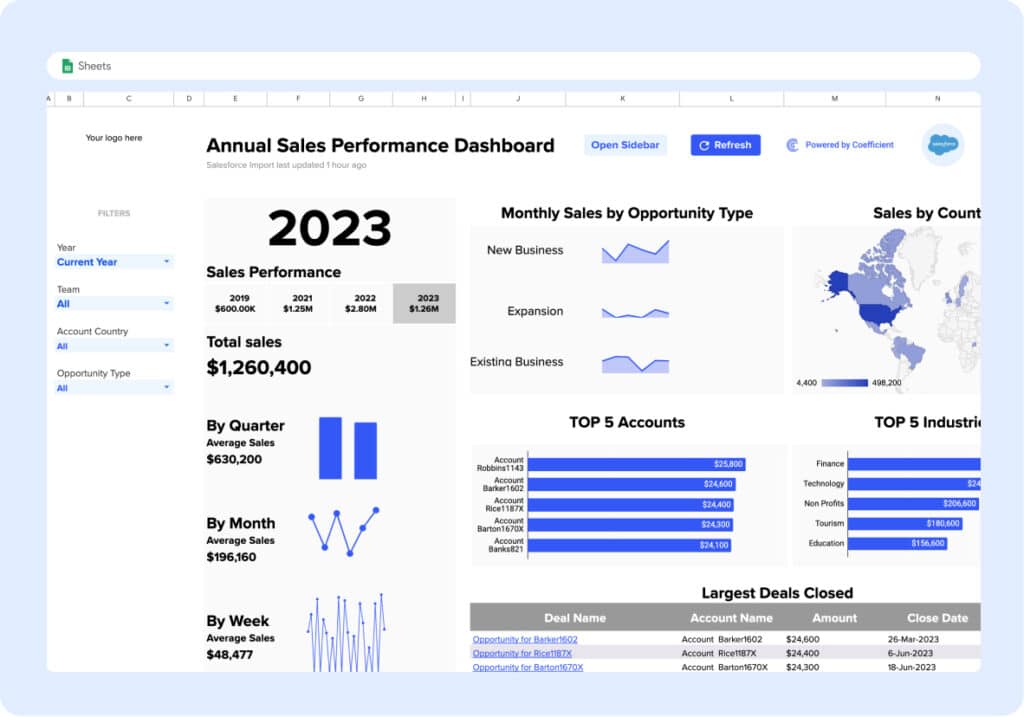
Monitor your sales team’s performance, all within a single view. This Sales Performance Analysis Template allows you to see if and how sales reps are meeting kpis, annual goals, without requiring you to build anything.
Harness charts and graphs to view sales performance by time period, opportunity type, and country. Filter visualizations by year, team, opportunity, and geolocation.
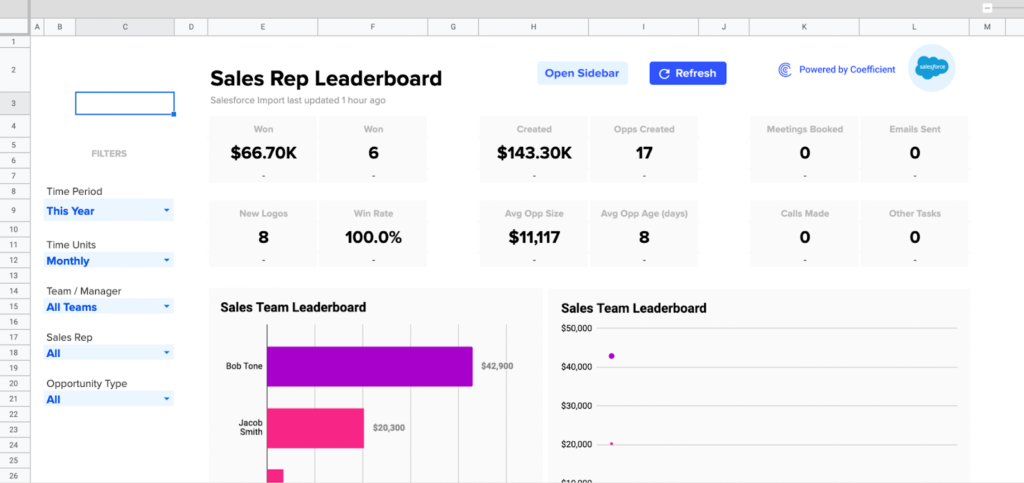
Coefficient’s Sales Team Leaderboard encourages friendly competition among your sales reps, leading to more closed deals and higher revenue. View side-by-side comparisons of all your reps for key sales metrics, such as opps created, win rate, new logos, and more. You can also easily toggle between reps, teams, years, and opportunity type. Download the Salesforce Sales Rep Leaderboard Dashboard now!
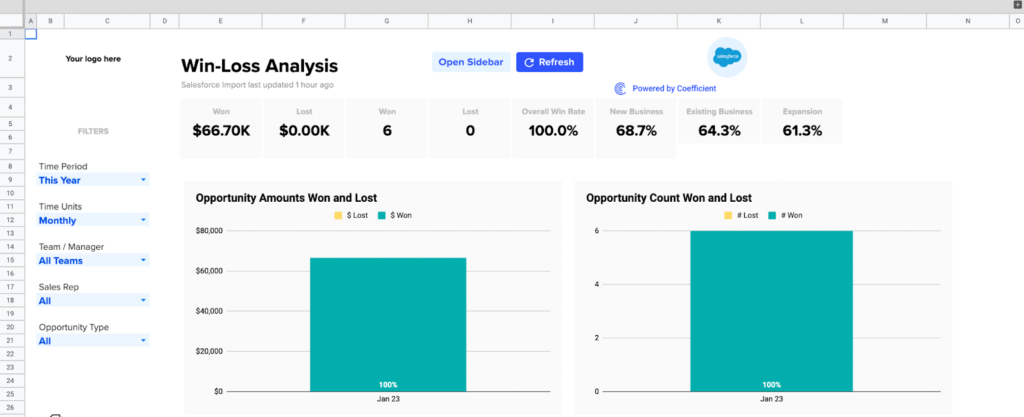
The Win-Loss Analysis Dashboard breaks down your winning and losing sales efforts in granular detail, so you can set a victorious strategy in the future. The dashboard leverages your live Salesforce data to create visualizations of win-loss KPIs.
Use this spreadsheet dashboard to monitor how company, team, and individual win rates are impacted by sales efforts. Identify performance trends early to double-down on wins or adjust strategy where you have lower win rates. Generate a clean list of recently lost opportunities and why they failed.
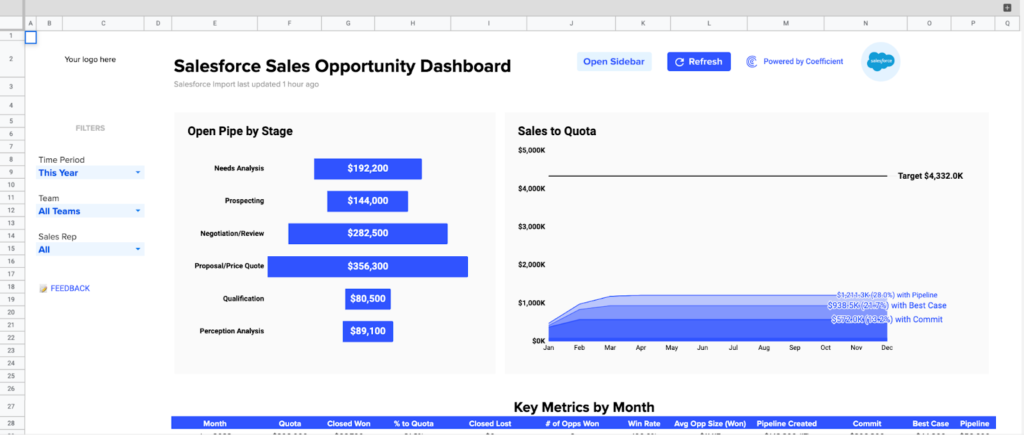
You can leverage our Salesforce Sales Opportunity Dashboard to manage the full lifecycle of your sales opportunities. Retain visibility into all stages of your opportunity pipeline by stage, for any month, quarter, or year, past or present. Track key monthly sales KPIs, such as win rate, average deal size, and value of each stage or forecast category.
Download the Salesforce Sales Opportunity Dashboard for free now to streamline your sales opportunities!
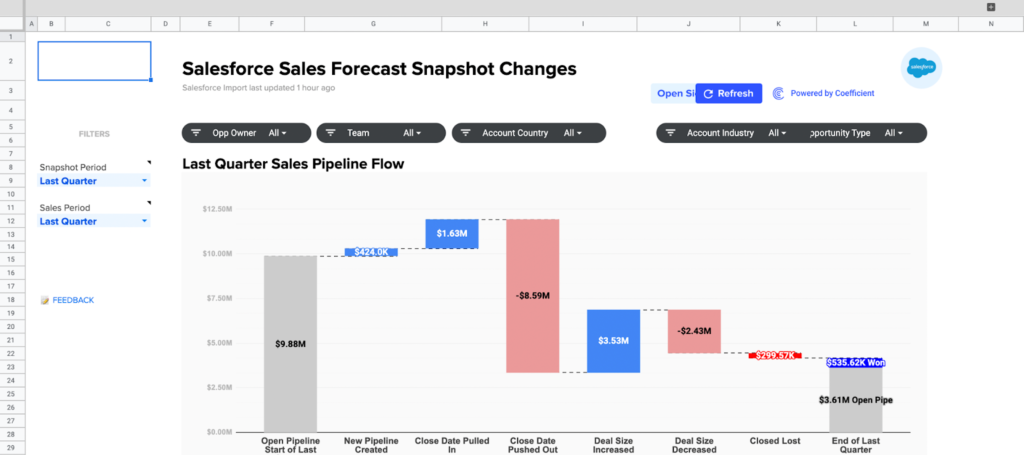
It’s difficult to access sales forecast changes in Salesforce. The CRM’s functionality prevents you from easily generating such a report. However, with our Opportunity History Template, you can view sales forecast changes directly inside Google Sheets.
The spreadsheet template measures the impact on your revenue by tracking new sales pipelines, lost opportunities, modified close dates, and upsells. Now you can track your sales pipeline over any time period, isolate opportunities that have changed in value, set custom fiscal periods, record changes to close dates, and much more.
You can launch our free Opportunity History Template in less than a minute. Give it a try!
You can set up your selected dashboard in a few simple steps.
Once you select your report, submit your email to grab the template.
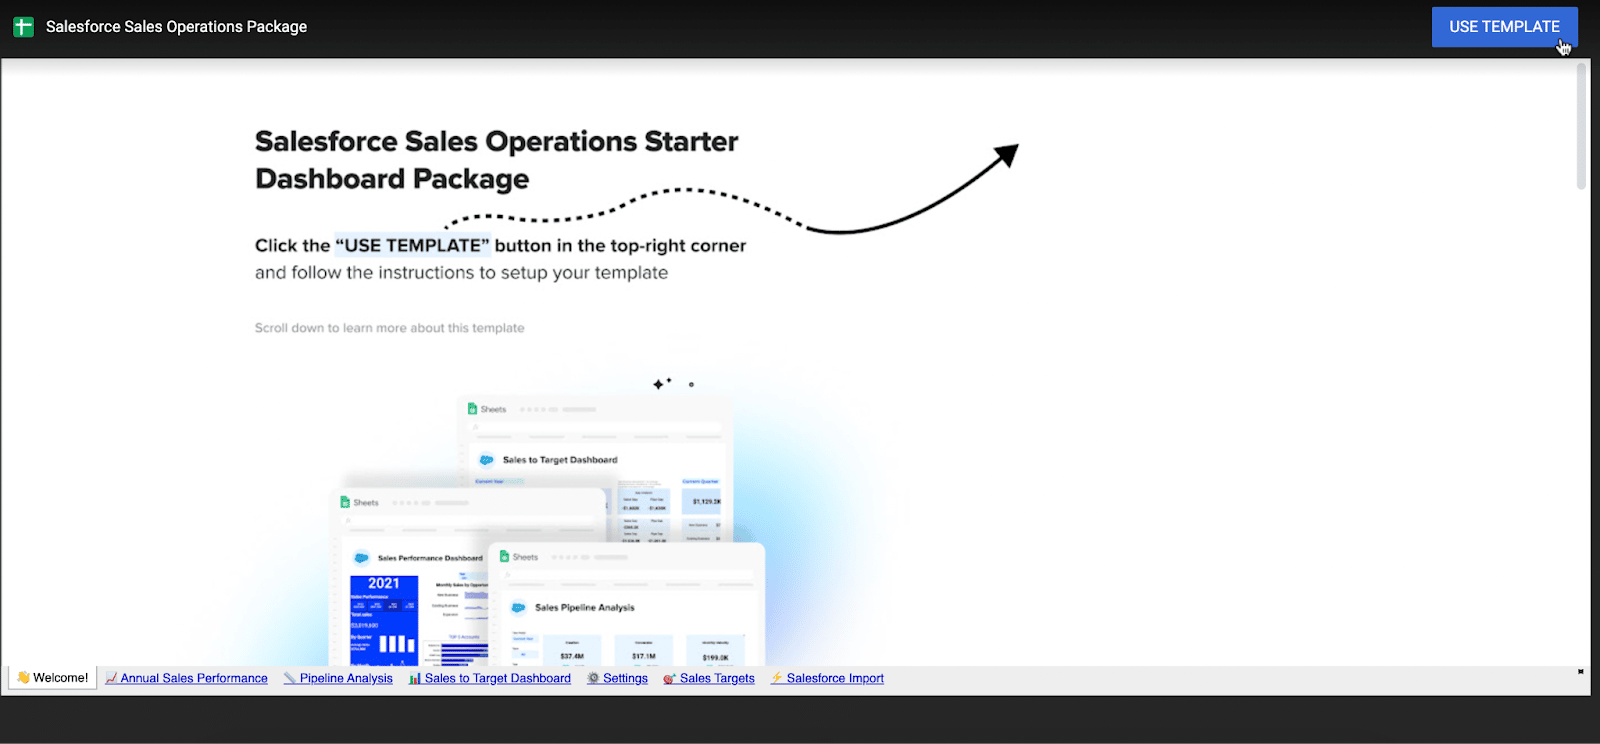
You’ll be routed to your dashboard in Google Sheets. Click “Use Template” to copy the sales performance dashboard.
After you make a copy, you will enter the dashboard in Google Sheets. To connect your live data to the dashboard, you’ll need to install Coefficient.
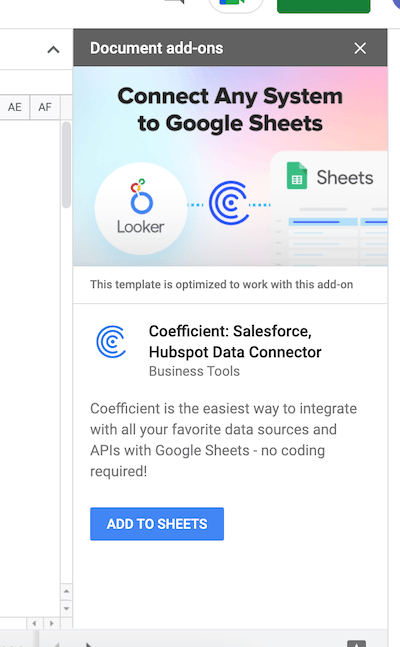
A sidebar will automatically pop up once you’re inside Google Sheets. If you do not already have Coefficient installed, click “Add to Sheets” on the sidebar.
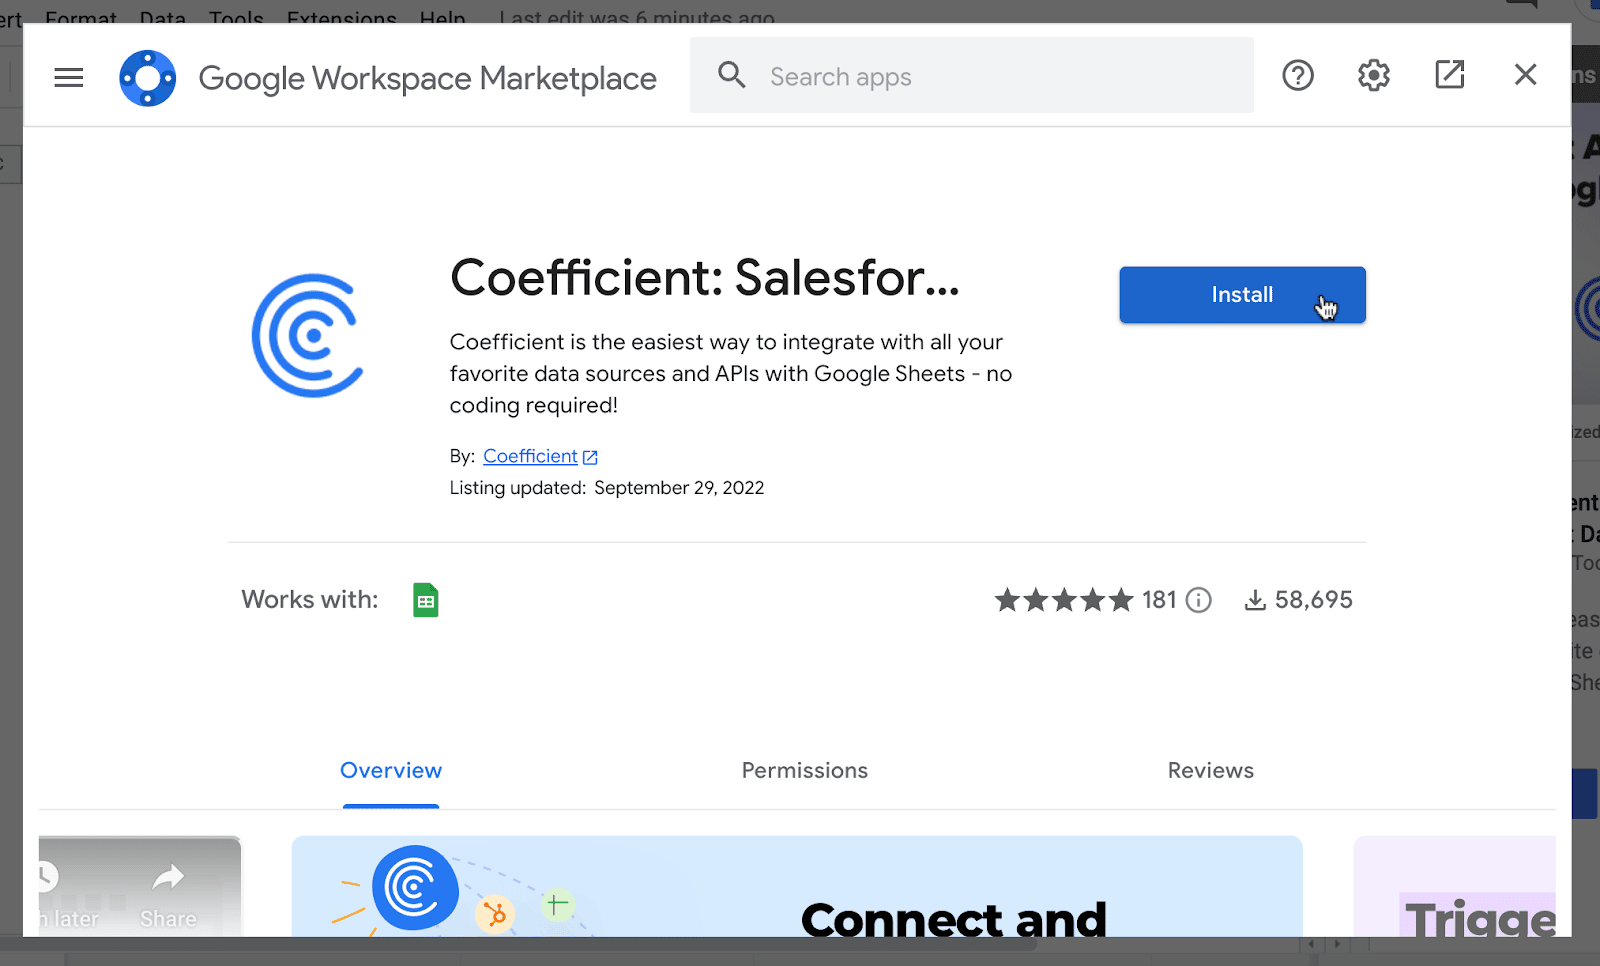
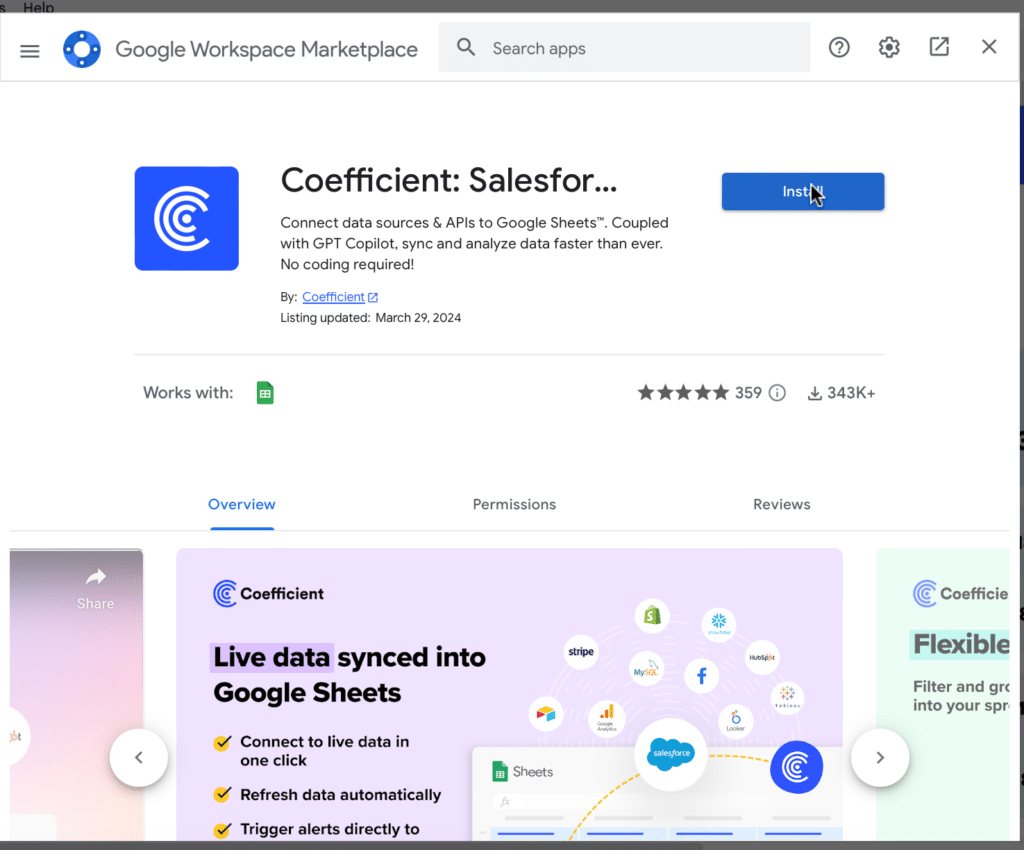
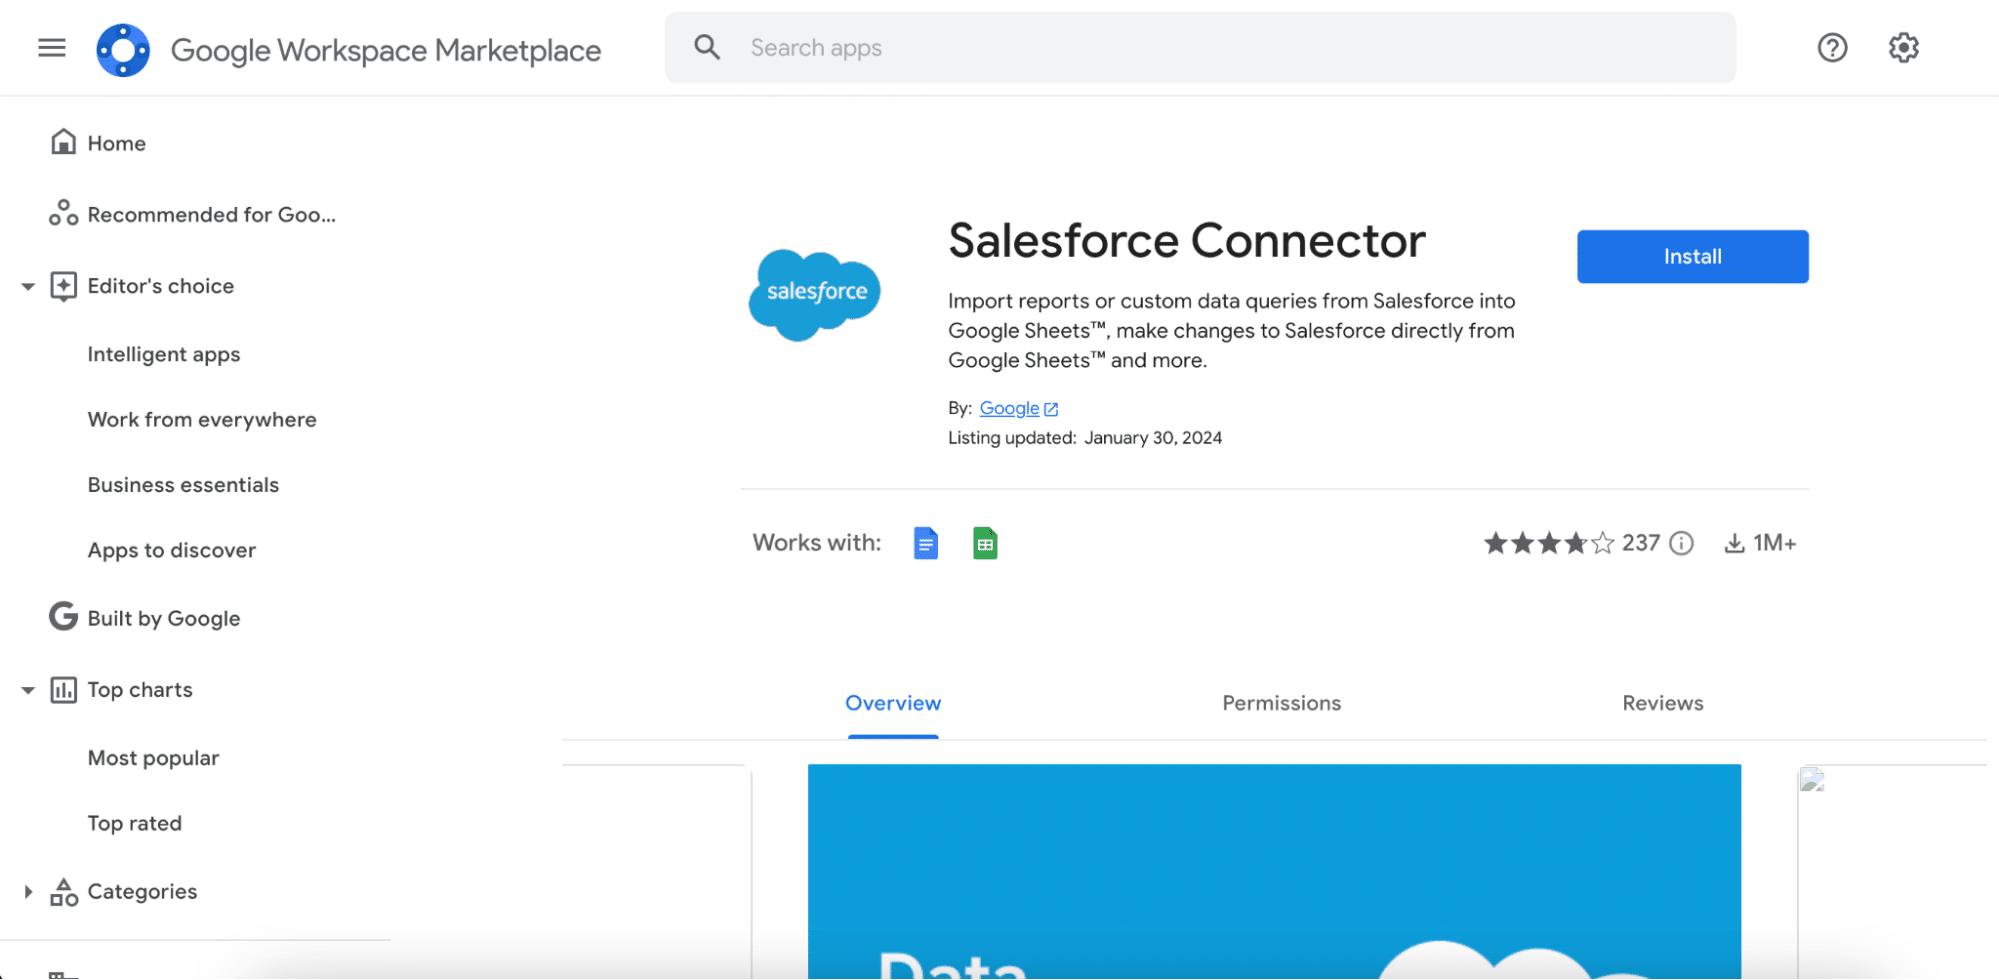
You will land on Coefficient’s page in Google Workspace Marketplace. Press “Install” to install the Coefficient add-on.
Once the install process is complete, return to the sidebar and choose the “Use” button and then press “Launch”. This will launch the Coefficient add-on.
From here, you will need to connect your Salesforce or HubSpot CRM data to power the dashboard. Follow these step-by-step walkthroughs on how to set up your data source.
Now your data will automatically populate the dashboard!
Bonus: Leverage Salesforce & HubSpot Formulas to Access Live Data in Spreadsheets
We’re recently introduced Native HubSpot & Salesforce Formulas for Google Sheets — a command-line for your CRM, right inside your spreadsheet. With functions like =salesforce_lookup, =hubspot_search, and =salesforce_report_search, you can pull live CRM data instantly, no connectors or exports required.
Filter, sort, and return exactly what you need—whether that’s passing a list of emails to a rep, surfacing top deals in a meeting, or checking the stage of a specific opportunity—all without leaving Sheets. It’s built for operators, analysts, marketers, and anyone who needs CRM answers, fast.
Sales Leader Dashboards: Take the Burden Off Your Plate
Building Salesforce dashboards for sales leaders is a time-consuming process for SalesOps users. However, with our pre-built Google Sheets dashboards, you can reproduce your most valuable Salesforce dashboard directly inside your spreadsheet. The best part is that the dashboards are free – so you can try the ones in this blog or any other in our templates gallery right now!
Salesforce does not provide a native “Salesforce Excel Connector” in the same way they offer native integration tools for other platforms.
However, several alternatives offer flexibility in integrating Salesforce data into Excel, catering to various needs and technical ability:
Third-party Tools and Add-ins: Solutions like Coefficient simplify the importation process, featuring user-friendly interfaces and automated data syncing. Ideal for seamless data analysis without extensive setup.
Manual Exports: Users can export Salesforce reports as CSV or XLSX files and open them in Excel. This quick solution is perfect for one-time analyses but doesn’t offer real-time data updates.
Salesforce API and VBA: For the tech-savvy, pairing the Salesforce API with Excel’s VBA customizes data queries and enables automation. This method delivers fresh, customized data directly into Excel sheets.
Power Query: Microsoft Power Query allows technical users to extract Salesforce data into Excel Desktop, facilitating data manipulation and allowing for scheduled updates.
ODBC Drivers: By establishing an ODBC data source for Salesforce, users adept in SQL can directly query Salesforce data from Excel, providing a potent tool for data manipulation.
How do I Link data from Salesforce to Excel? Top 3 Methods
There are several ways to integrate data from Salesforce to Excel.
Here, we will cover the three easiest ways: Coefficient, the XL-Connector, and Manually
Method 1: Coefficient
Coefficient is a no-code, two-way Salesforce Excel Connector trusted by over 300,000 go-to-market professionals and data analysts for live data analysis and reporting.
It’s by far the fastest and easiest way to connect Excel to Salesforce. Let’s walk through how it works.
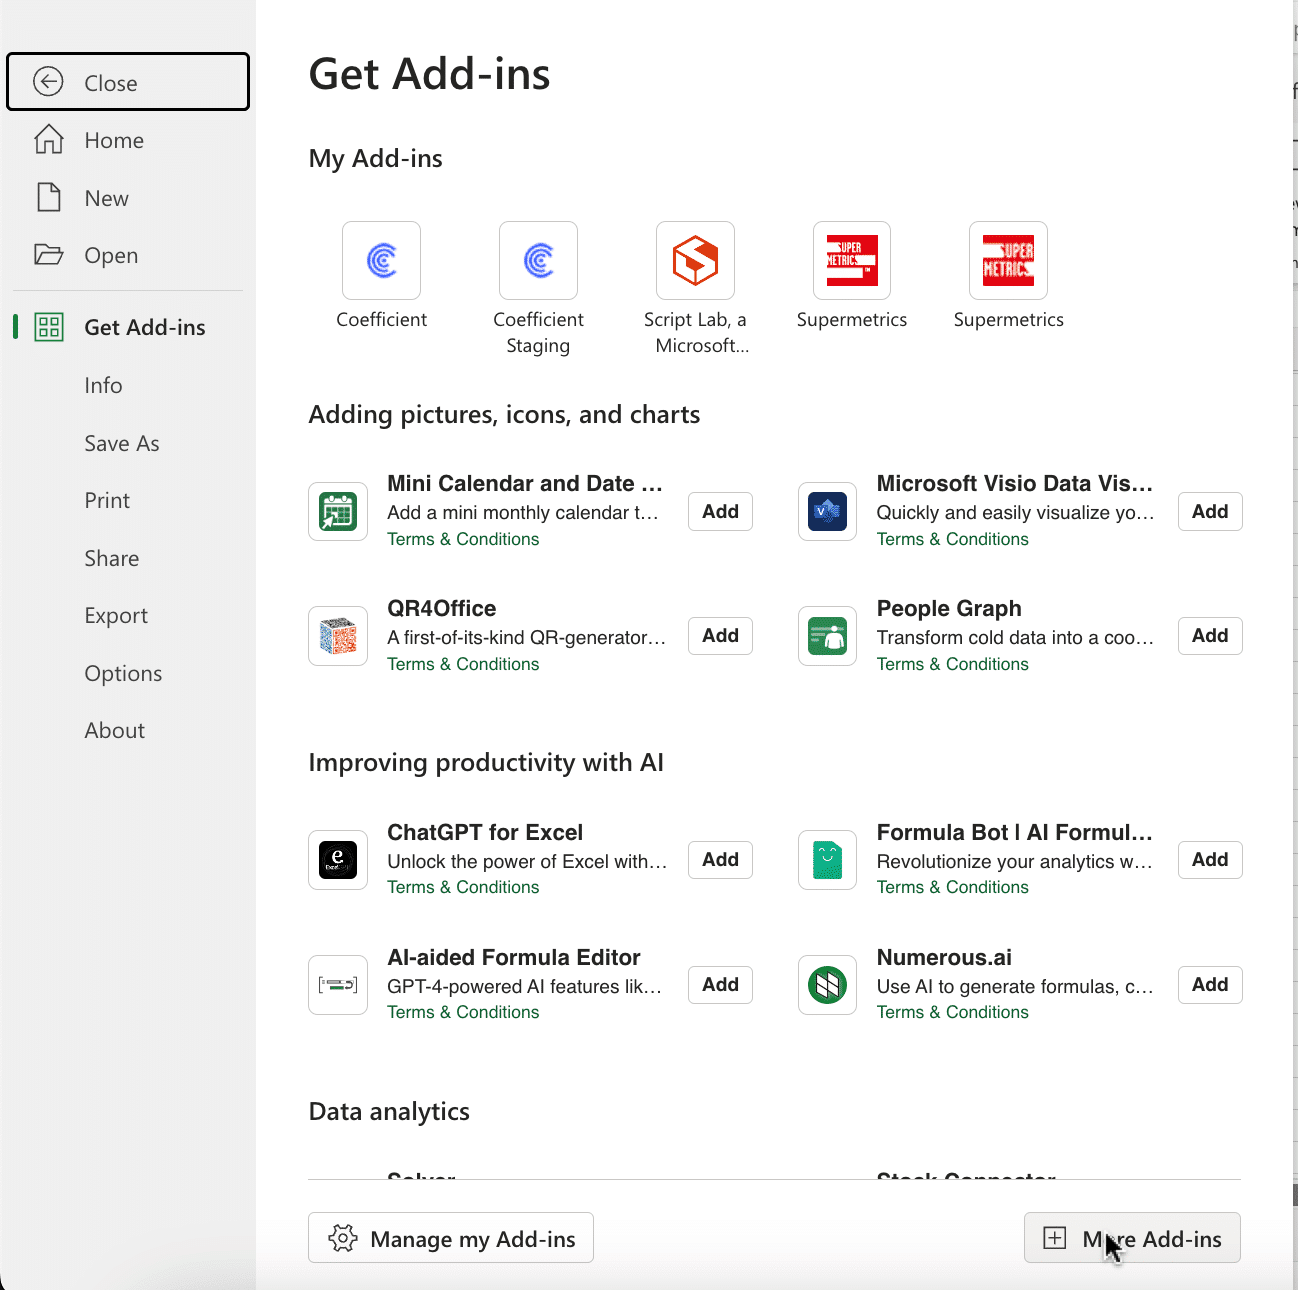
To install Coefficient, open Excel from your desktop or in Office Online.
Click ‘File’ > ‘Get Add-ins’ > ‘More Add-Ins.’
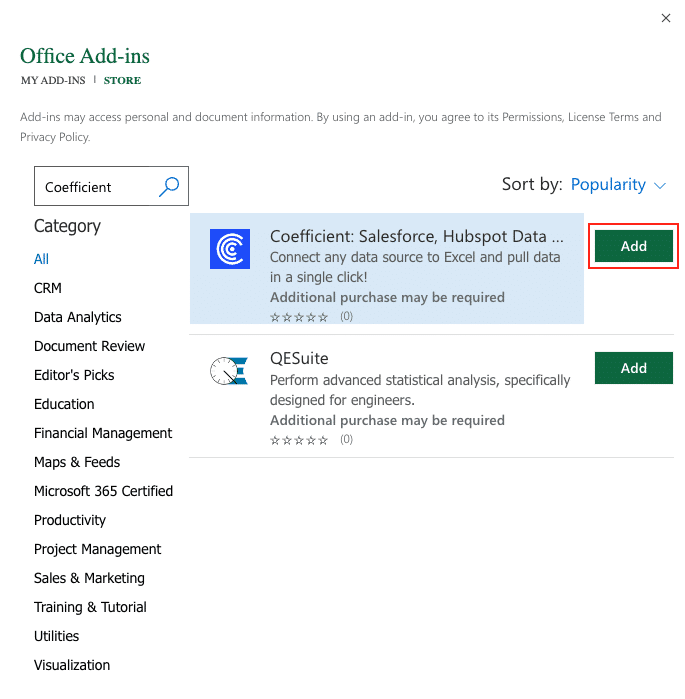
Type “Coefficient” in the search bar and click ‘Add.’
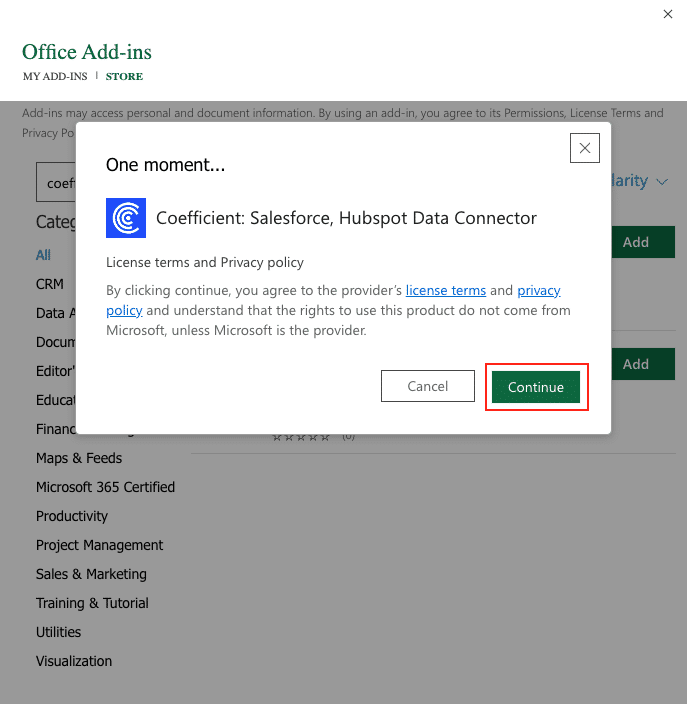
A pop-up will open up. Follow the prompts to complete the installation.
Once finished, you will see a “Coefficient” tab at the top navigation bar.
Click ‘Open Sidebar’ to launch Coefficient.
Now, you can connect Salesforce and Excel in a few clicks.
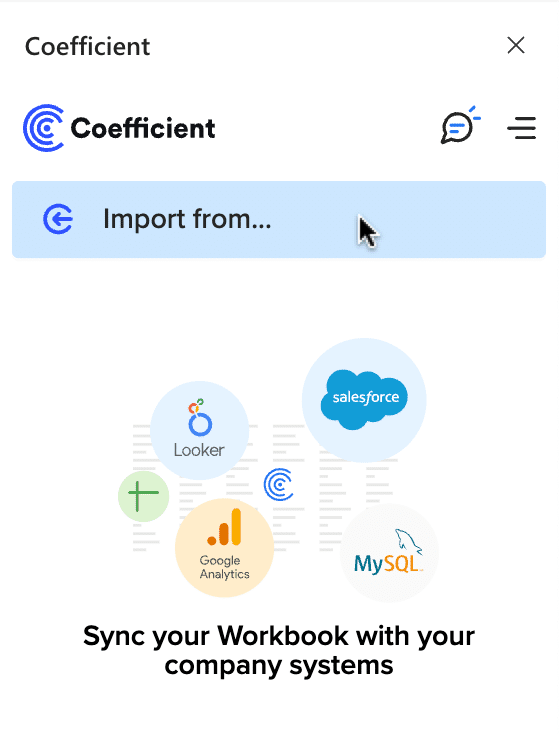
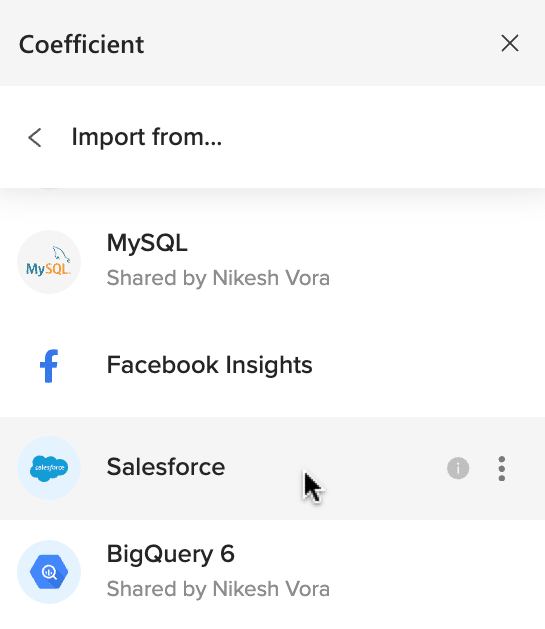
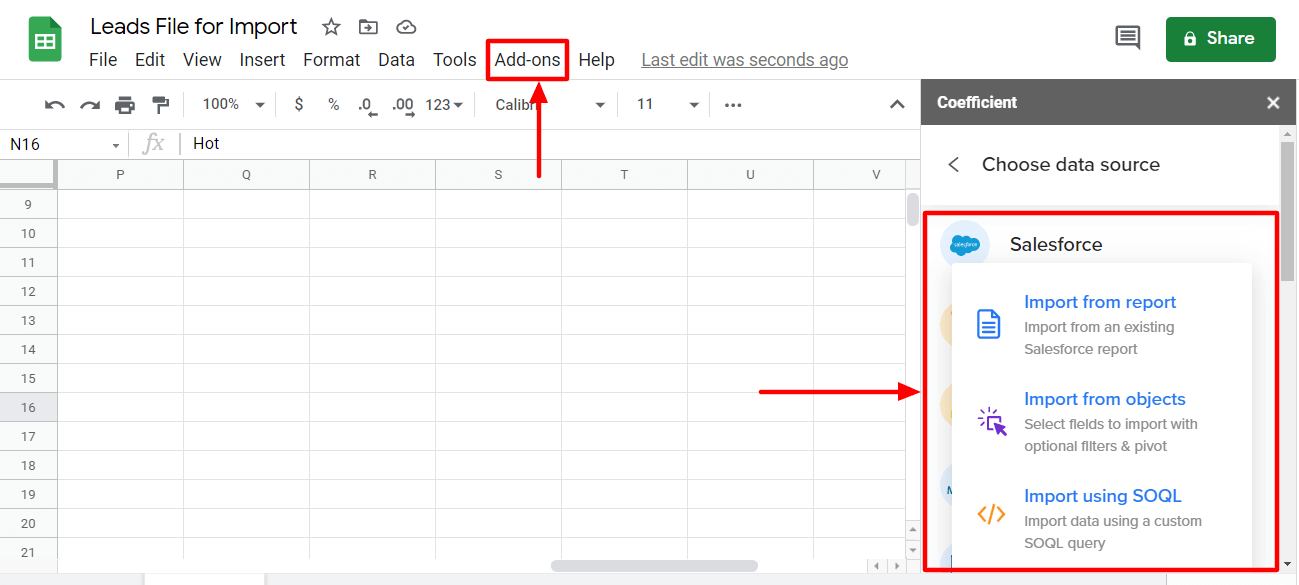
Select ‘Import from…’
Scroll down until you find Salesforce in the menu.
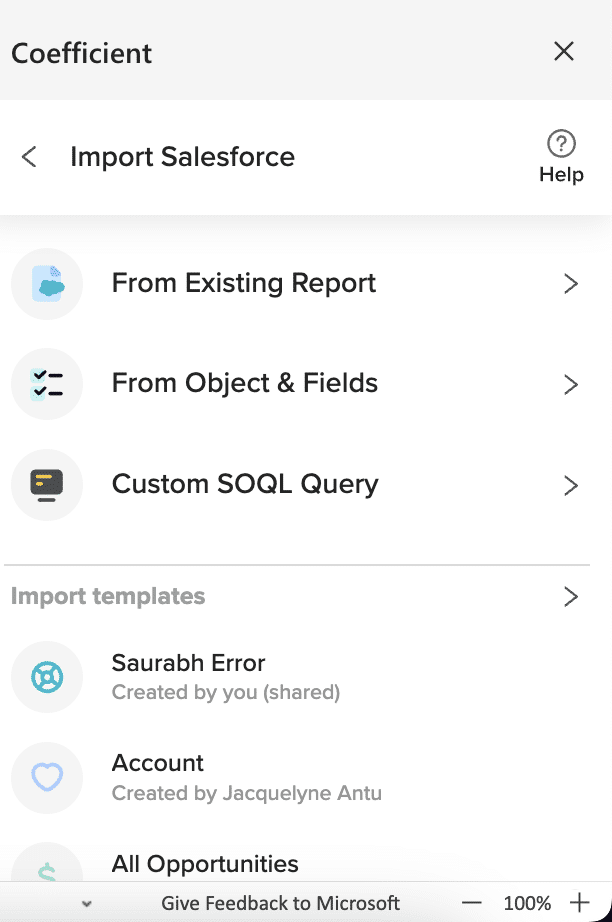
There are several ways to import data from Salesforce with Coefficient.
Import from an existing report
Import from objects and fields
Import using SOQL
In this example, we’ll select ‘From Objects & Fields.’
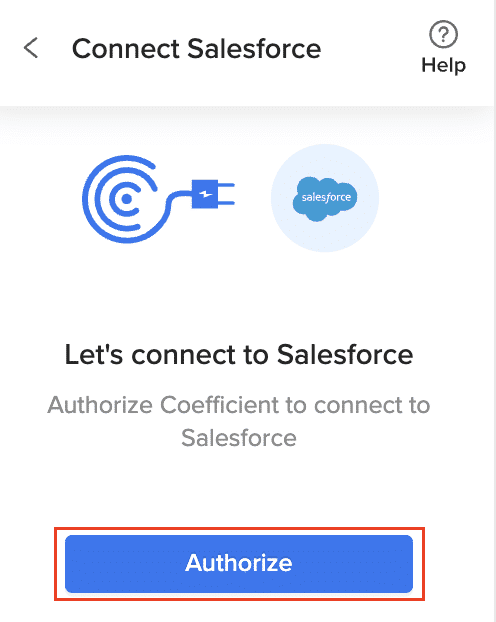
If this is your first time connecting to Salesforce, you’ll need to authorize Coefficient to access your data.
Click ‘Authorize’ and follow the prompts to continue.
After you’ve granted Coefficient access to your Salesforce account, it will redirect you back to Excel to create your import.
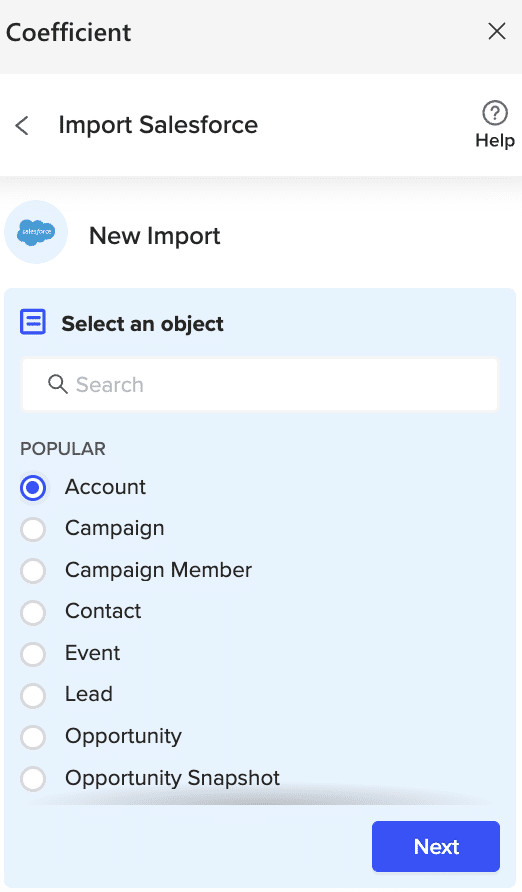
Select an object from the menu and click ‘Next.’
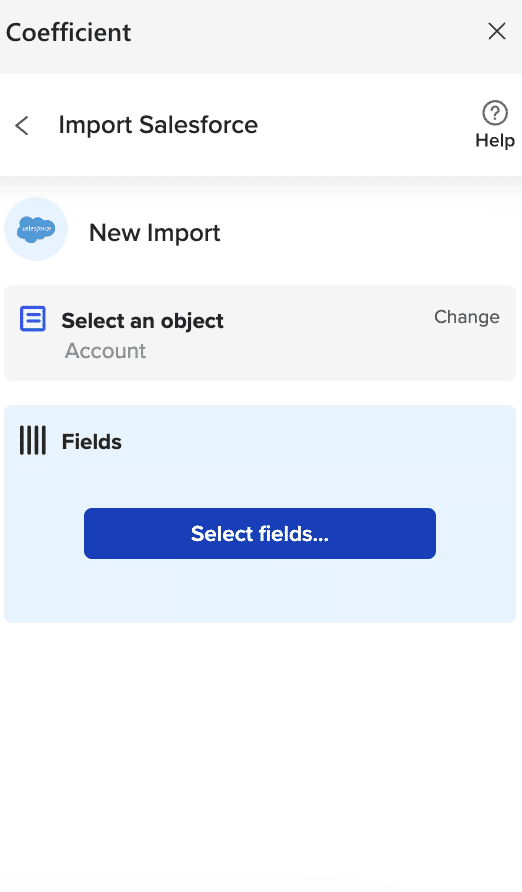
Click ‘Select Fields’ to reveal a list of fields to add to this import.
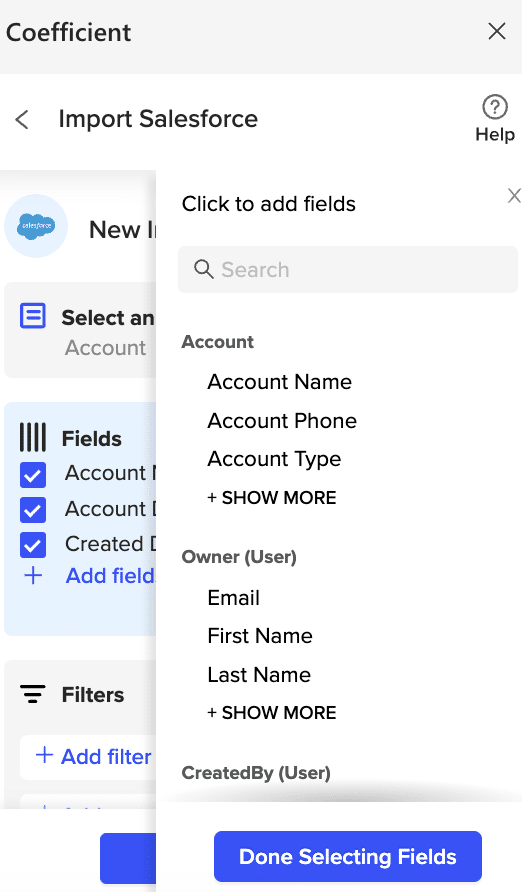
Select the fields you want to import by scrolling through the menu. You can also search for each in the menu.
After making your selections, click ‘Done Selecting Fields’ to continue.
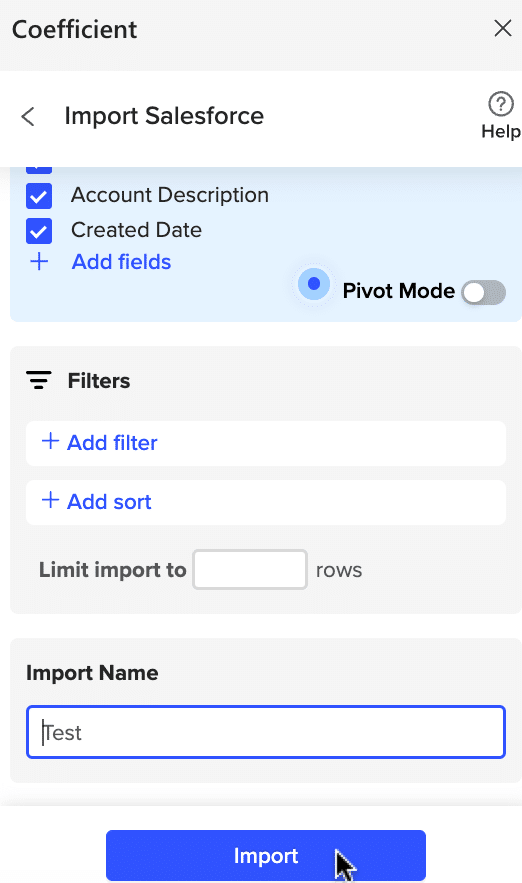
Note: You can add filters to your import as needed.
Name your import and click ‘Import’ to continue.
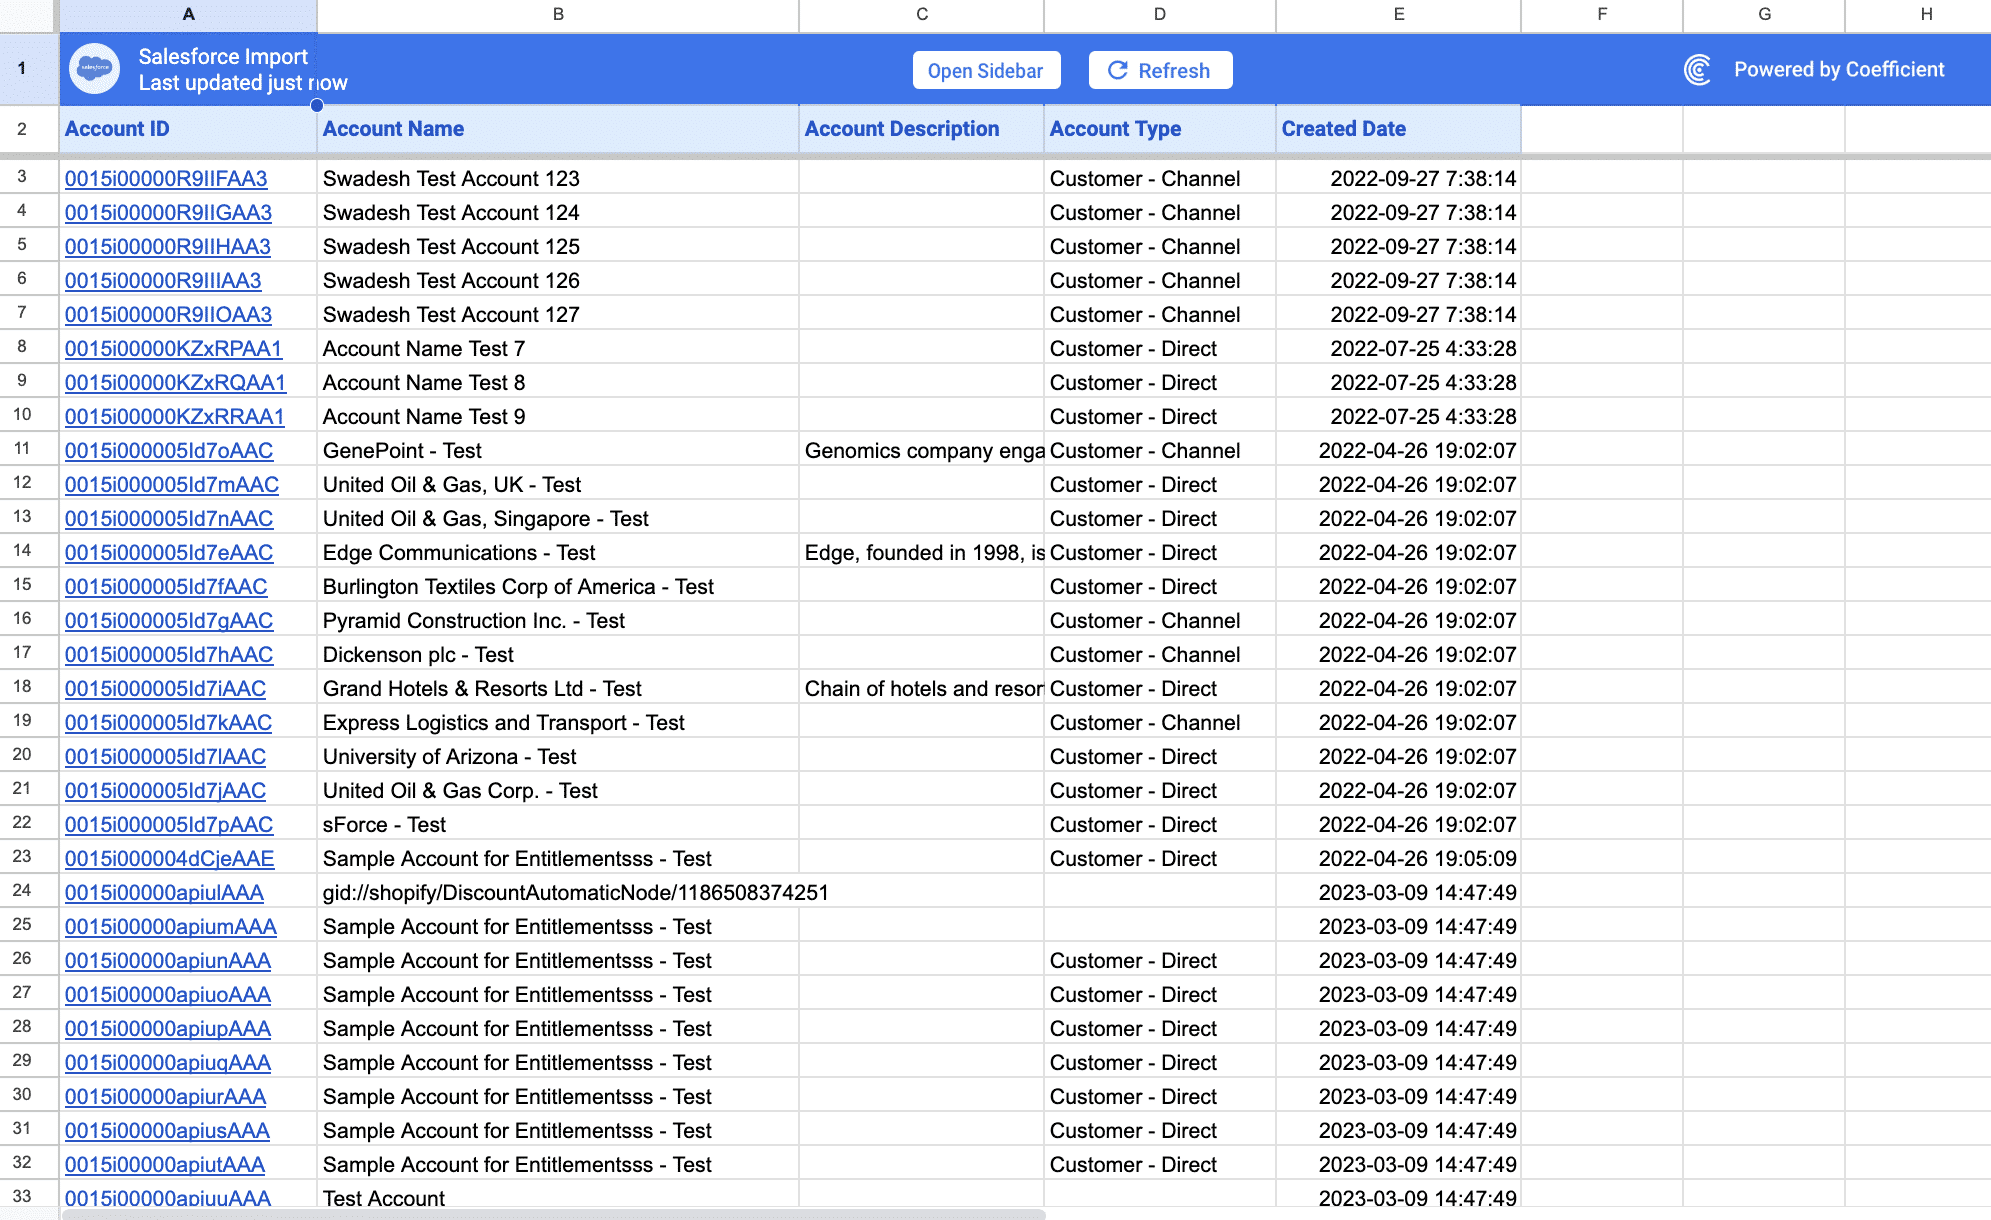
Your Salesforce import will automatically populate in Excel.
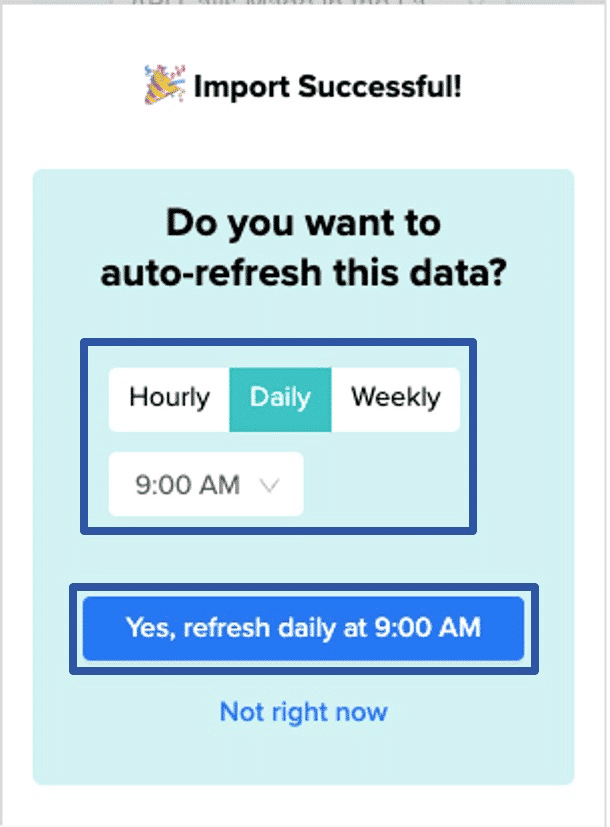
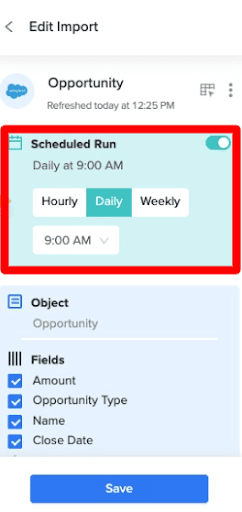
The last step is to use Coefficient’s auto-refresh scheduler to automatically update your data. Simply choose your cadence (Hourly, Daily, or Weekly) and time – Coefficient will take care of the rest.
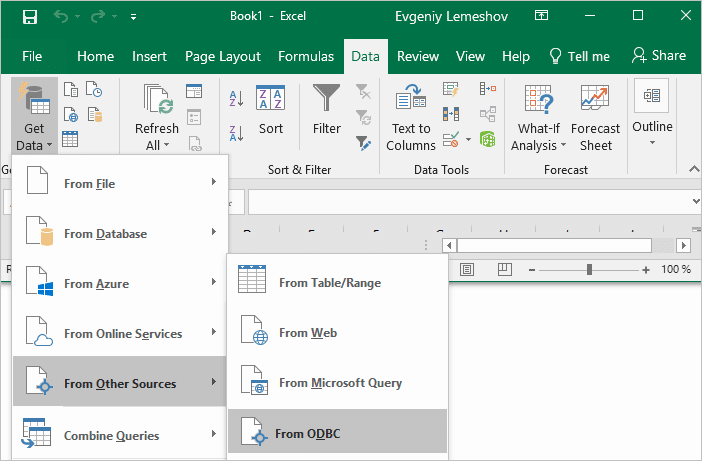
Method 2: Open Database Connectivity (ODBC) Drivers
Excel for Desktop users connect Salesforce to Excel by using an ODBC. In this example, we’ll use the Devart OBDC Driver for Salesforce on macOS..
Note: Ensure you have the necessary Salesforce login credentials and have configured the ODBC data source correctly to facilitate a smooth data import process.
First, open Excel, head to Excel > About Excel to check if your version is compatible with the Devart ODBC driver specifications.
Next, visit the Devart website and navigate to the ODBC Driver for Salesforce page.
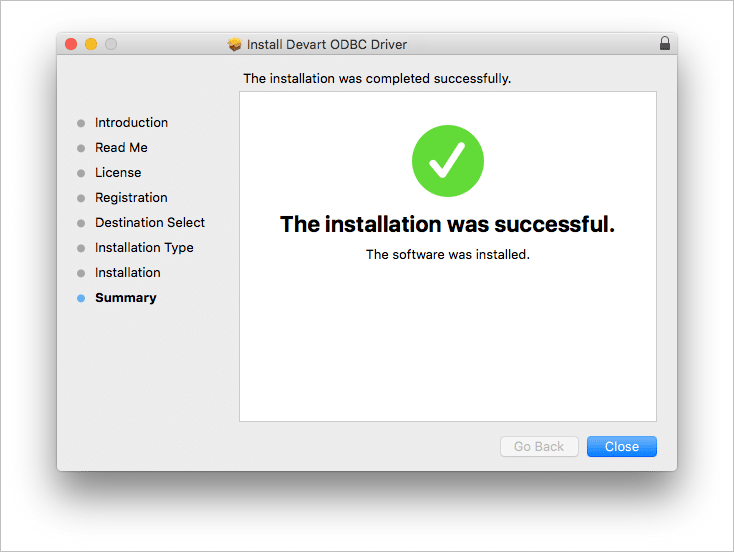
Download the driver compatible with macOS, open the file, and follow the instructions through to completion.
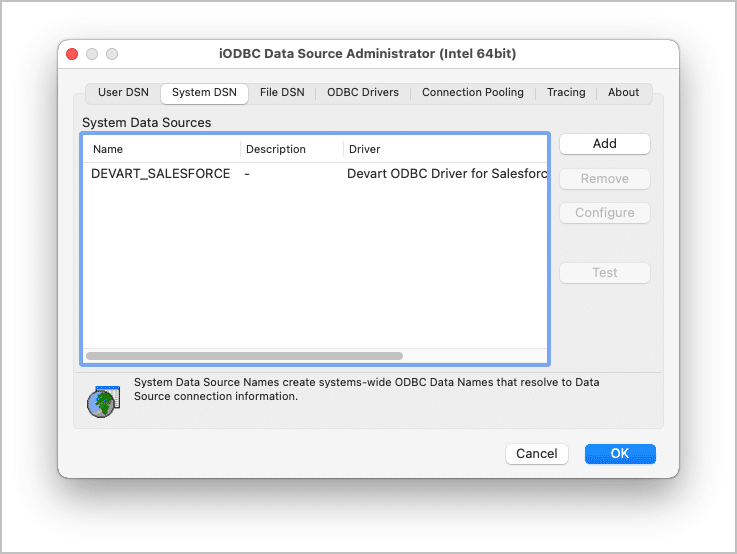
To configure the ODBC Data Source, go to your Mac’s System Preferences > ODBC Manager.
In the ODBC Data Source Administrator, under the “User DSN” or “System DSN” tab, click “Add” to create a new data source.
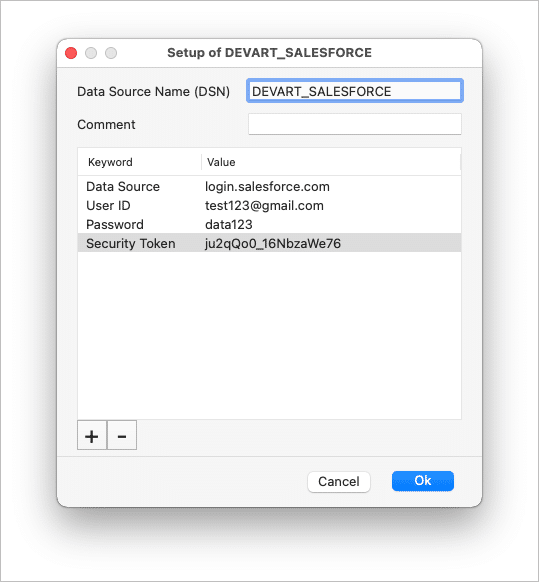
Select the Devart ODBC Driver for Salesforce from the list and fill in your Salesforce connection details, including any necessary authentication tokens.
To connect Salesforce from Excel, open Excel from your desktop and go to the Data tab.
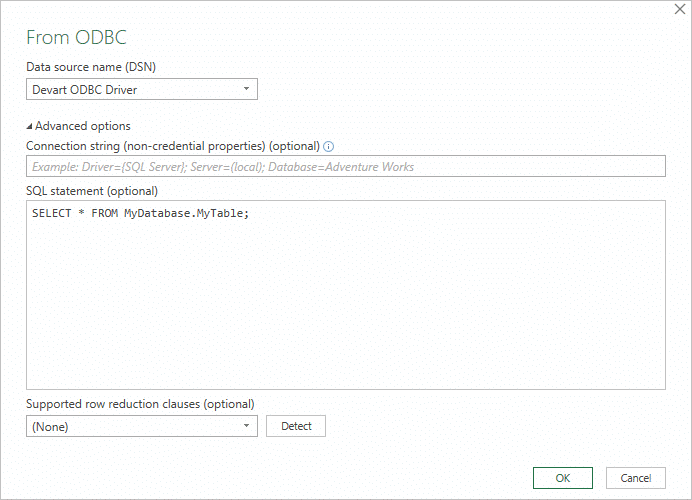
Choose the DSN you configured for Salesforce and enter any required login credentials.
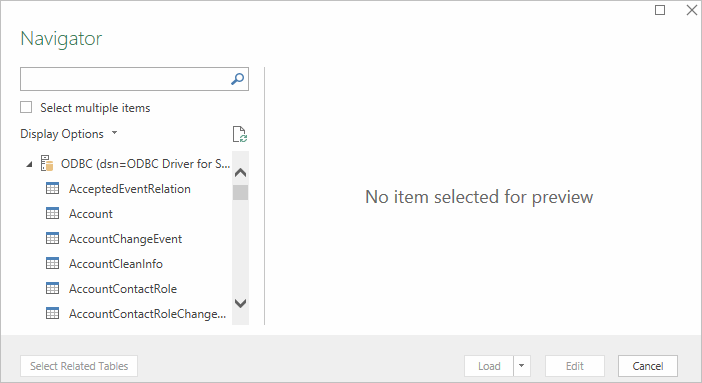
Select the tables or queries you want to import from the Navigator window. You can preview your data here and even edit it using Excel’s Query Editor.
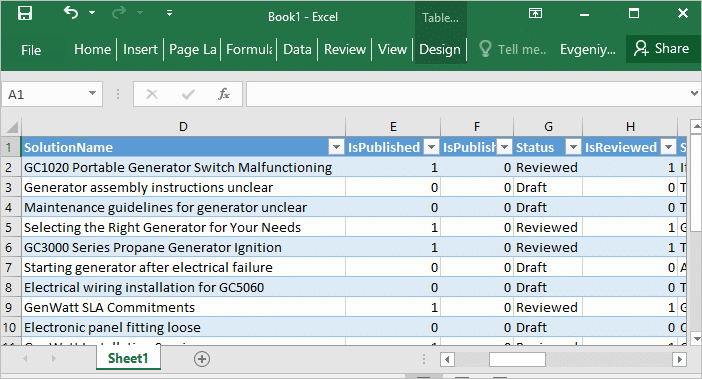
Click “Load” to import your data directly into an Excel worksheet, or “Load To” for more specific placement options.
Cons
Salesforce-Specific: It’s tailored exclusively for Salesforce, limiting its use for organizations that need to integrate multiple data sources within Excel for broader analyses.
Setup Complexity: Advanced features might require a good grasp of Salesforce and Excel, posing challenges for non-technical users or those with limited time to learn the tool’s complexities.
Version Compatibility Concerns: XL-Connector’s functionality is closely tied to specific Excel versions, which may lead to challenges in maintaining compatibility and optimal performance across different Excel updates or installations.
Method 3: Manually Exporting
Another option is manually exporting your report from Salesforce and importing it into Excel.
To do so, navigate to the Reports tab in Salesforce.
Create or select the report you wish to export to Excel.
Once the report is ready, click on ‘Export’ and choose the Excel format (e.g., .xls or .xlsx).
Open the downloaded Salesforce report in Excel to finish.
Cons:
Time and Effort: The need for exporting, possibly reformatting, and then importing data into Excel requires significant manual effort, especially with frequent updates.
Risk of Mistakes: Handling data manually increases the chance of errors during export, transformation, or import, potentially leading to inaccurate data and decisions based on outdated information.
The Best Salesforce Excel Connector? Coefficient
Get the most out of your Salesforce data by connecting it to Excel.
Coefficient provides the most seamless and hassle-free way to pull up Salesforce data into Excel with its intuitive UI and quick setup.
Try Coefficient for free today to try it out for yourself!
Capturing historical Salesforce data for trend analysis doesn’t require complex manual setup. You can automate snapshots or create them manually in Salesforce.
Automated snapshots: Use Coefficient to automatically capture and store historical data in Google Sheets/Excel
Manual setup: Create Salesforce reporting snapshots with custom scheduling and field mapping
Best practices: Consistent field mapping, regular reviews, and optimized scheduling for performance
Salesforce Reporting Snapshots are an essential tool for capturing and analyzing historical data, enabling you to understand trends and make informed decisions. Today, we’ll walk you through the straightforward steps to set up Salesforce Reporting Snapshots efficiently.
Prerequisites Before diving in, ensure you have Salesforce access, and a basic grasp of reports and dashboards. Ready? Let’s jump in!
The Automated Way: Smart Snapshots with Coefficient
Skip the manual snapshot configuration. Coefficient automatically captures historical data from your Salesforce reports and stores it in organized snapshots within your spreadsheet.
Step 1: Connect and Import Your Source Data
Open Coefficient in Google Sheets or Excel. Import the Salesforce report you want to snapshot – whether it’s opportunities, leads, or any custom report.
Choose “From Existing Report” and select your target report. Your live data flows into the spreadsheet instantly.
Step 2: Set Up Automated Snapshots
Click on your imported data and select “Snapshots” from the automation menu.
Choose your snapshot type:
Entire Tab: Copies your full report to a new tab with timestamp
Specific Cells: Appends new data to a designated location for running history
Set your schedule – hourly, daily, weekly, or monthly. Each snapshot preserves the exact data state at that moment.
Step 3: Configure Retention and Organization
Set retention rules to manage how many snapshots you keep. Want the last 12 months of weekly data? Configure it once and forget it.
Your snapshots automatically organize with timestamps. Compare this week’s pipeline to last quarter’s. Track lead quality trends over time. All without manual exports or complex Salesforce configurations.
Why this works: Your historical data builds automatically. No missed snapshots because someone forgot to run a report. No storage limits. Just clean, organized historical data ready for analysis.
Step-by-Step Guide for Salesforce Reporting Snapshots
Step 1: Understanding Reporting Snapshots First off, reporting snapshots allow you to preserve historical data from standard objects, providing insight into past performances, trends, and patterns.
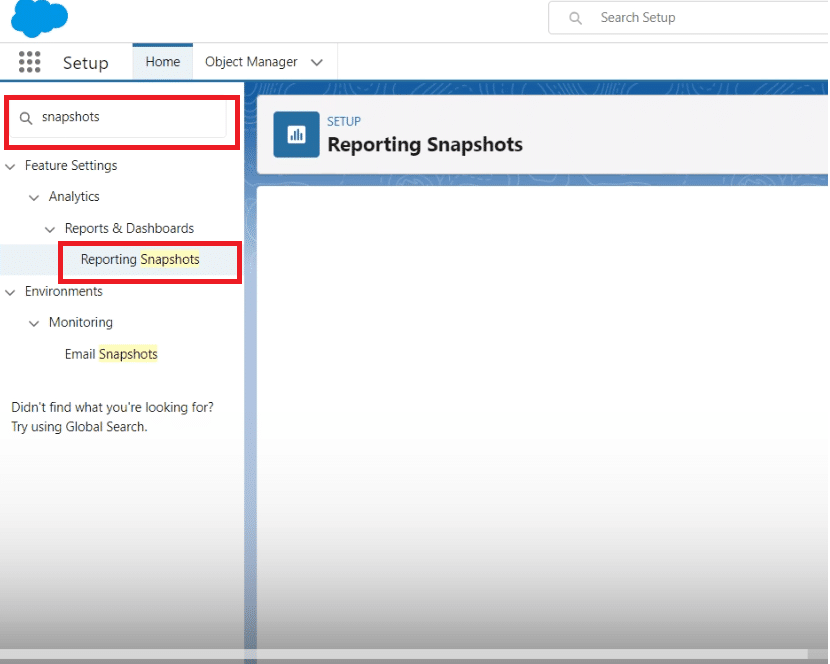
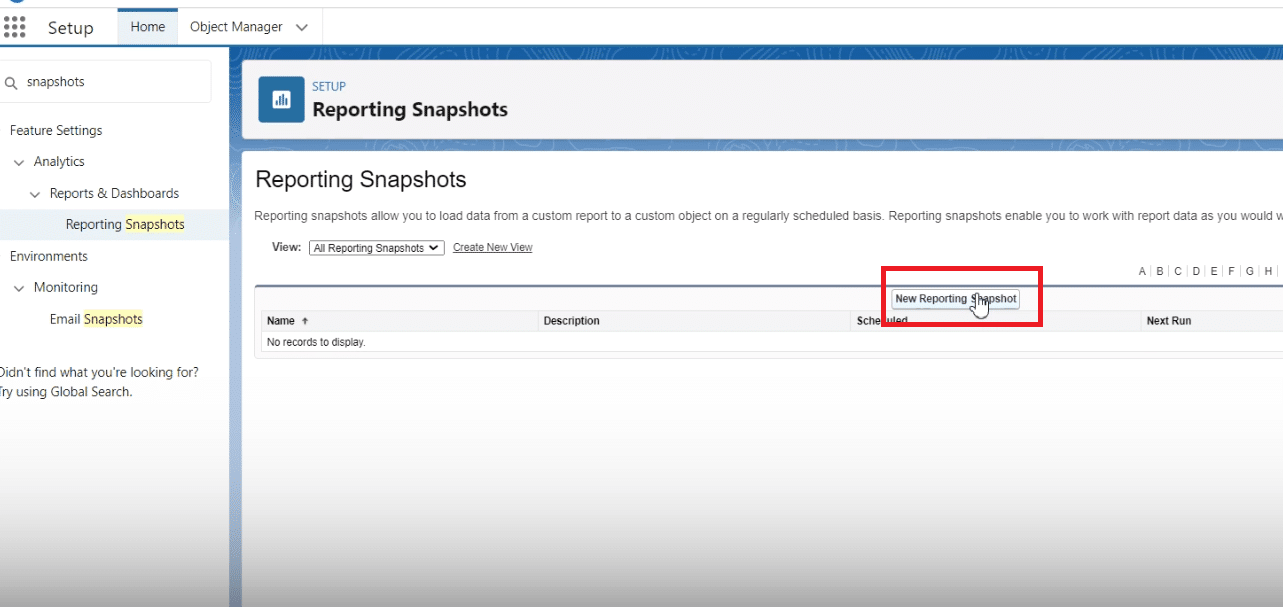
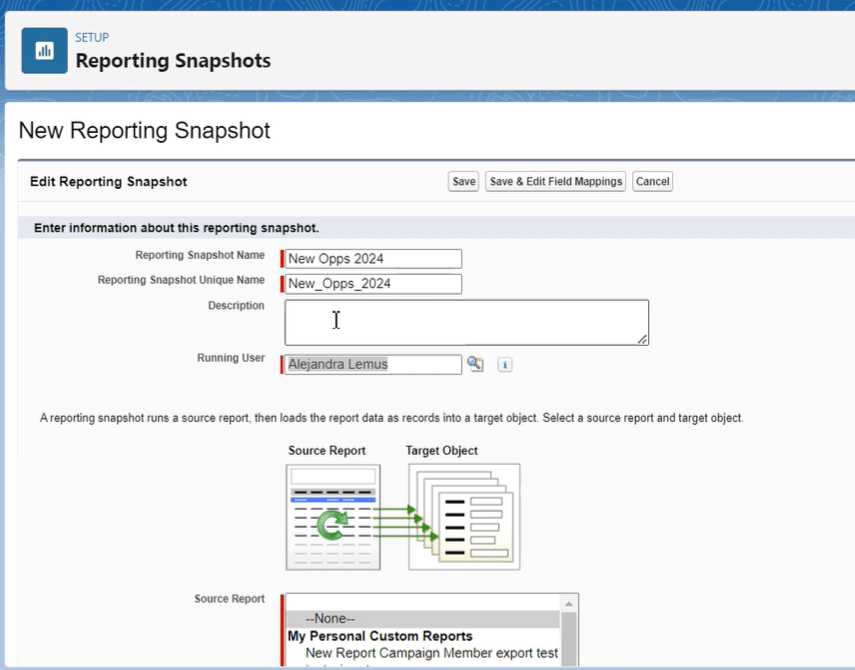
Step 2: Navigate to the Setup Menu Head to the setup menu and use the Quick Find box to search for “snapshots.” This is your gateway to creating new reporting snapshot.
Step 3: Create a New Reporting Snapshot Click on “New Re porting Snapshot.” Here, you’ll base the snapshot on an existing report, like one detailing opportunities above $50,000 without a sales team.
Step 4: Configure the Reporting Snapshot Name your snapshot, which will auto-generate a unique name. Assign a running user—this will be you, especially crucial if you’re managing these decisions strategically, as a CEO, for instance.
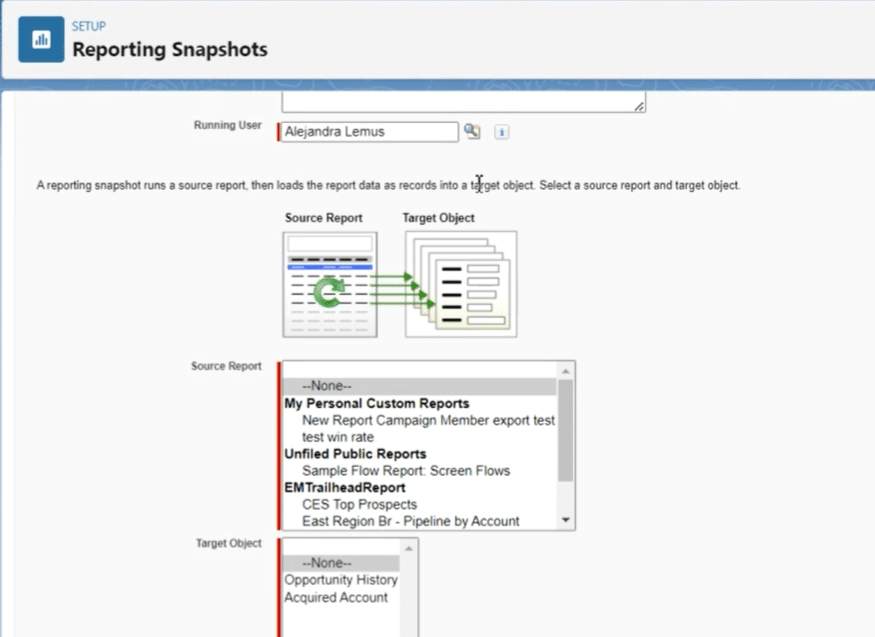
Choose your source report and target object, ensuring the report is either tabular or summary to use in a snapshot.
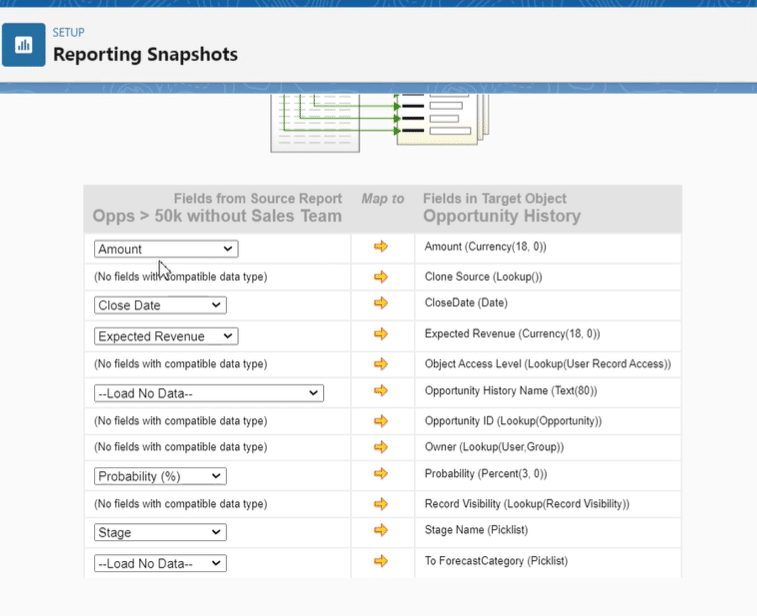
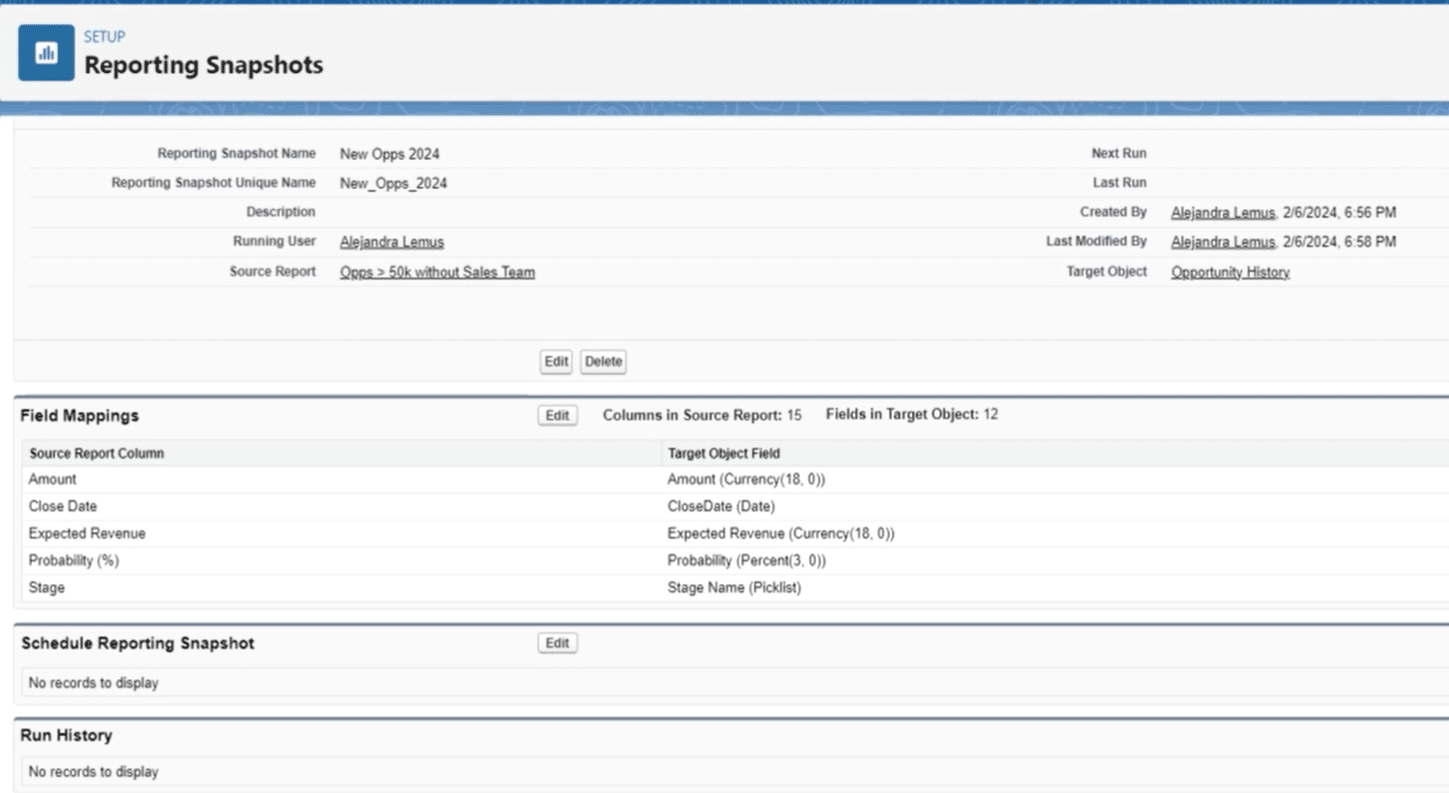
Step 5: Map Fields Between Source and Target Select “Save and Edit Field Mappings.” Map the fields you wish to capture in your snapshot, like aligning “Amount” with “Amount” and “Close Date” with “Close Date.”
Step 6: Schedule the Reporting Snapshot Decide on the snapshot’s frequency—daily, weekly, or monthly. Set up the specific day for weekly runs, the start date, and the preferred start time (say, 2 am for minimal disruption)
Best Practices and Tips
Consistency in Data Fields Ensure consistency in the field mappings between the source report and the target object. This consistency is crucial for accurate trend analysis and tracking success metrics over time.
Regular Reviews and Adjustments Reporting requirements may evolve as business goals change. Regularly review and adjust the reporting snapshots to ensure they stay aligned with your current business objectives.
Optimize Snapshot Scheduling When setting the frequency of snapshots, consider the impact on system performance and the relevance of the data. For example, a snapshot related to quarterly revenue might only need a monthly schedule, whereas daily sales performance might benefit from daily snapshots.
Leverage High-Quality Reports as Sources Quality in, quality out. Ensure the source reports are well-constructed and accurate. A snapshot is only as good as the report it’s based on.
Security and Privacy Considerations When selecting the running user and mapping fields, be mindful of data security and privacy considerations. Ensure that sensitive data is handled according to your organization’s compliance standards.
Expanding Capabilities with Coefficient Integrate Salesforce with Coefficient for an elevated analytics experience. Coefficient, with its robust integration capabilities, streamlines the process of merging Salesforce data with Google Sheets or Excel, offering unparalleled flexibility in customizing reports.
This tool not only augments the power of Salesforce Reporting Snapshots but also ensures your team, regardless of Salesforce licensing, stays informed with real-time updates through Slack and email notifications.
Benefits of Implementation
Implementing Salesforce reporting snapshots empowers your organization to keep a pulse on historical data, identifying trends and making data-driven decisions.
We hope this guide has illuminated the path to mastering Salesforce Reporting Snapshots in six simple steps. Don’t stop here; take action by exploring Coefficient’s solutions to elevate your Salesforce experience even further.
Get started here and unlock the potential of enhanced data analysis and reporting.
Many operators export Salesforce reports and data into Excel for more flexible analysis, reporting, and sharing.
In this guide, we’ll provide a step-by-step walkthrough on exporting reports, objects, and fields into Excel and introduce Coefficient’s two-way Salesforce connector for Excel if you’re interested in automating Salesforce data exports and imports for free.
So let’s start!
TLDR
Step 1:
In Excel, click File -> Add-ins.
Step 2:
Search & Install Coefficient from Excel Add-ins.
Step 3:
Once installed, you will see a “Coefficient” tab at the top navigation bar.
Step 4:
Click ‘Open Sidebar’ to launch Coefficient in Excel.
Step 5:
Click Import Data from the Coefficient sidebar, then select Salesforce as your data source.
Step 6:
Specify your import’s Object fields by clicking Select Fields.
Step 7:
Click Run to start exporting data directly from Salesforce to Excel.
Method 1: Coefficient, a free, no-code option to export Salesforce reports and data
To support a wider spectrum of Salesforce export options, like learning how to export opportunities from Salesforce to Excel or previously built reports in Salesforce, you’ll need an add-on to help you out.
Coefficient is one of Salesforce AppExchange’s top-rate connectors for Salesforce and spreadsheets.
Access Salesforce data: Open up the Coefficient extension in your spreadsheet, select ‘Import From’ -> Salesforce. You’ll be prompted to connect Salesforce.
Select your import type (Reports, Object/Fields, or SOQL): Choose the data or report you want to export to your spreadsheet within a simple WYSIWYG sidebar app.
Your import will automatically populate into a new tab in your spreadsheet. And, you’ll have the option to keep your import on a refresh schedule hourly, daily, or weekly. Here’s a quick walkthrough in Google Sheets; the process will be the same in Excel.
Method 2: Manually in Salesforce
Here’s how to export a report in Salesforce from inside the Salesforce user interface. This option requires more technical chops and familiarity with SOQL.
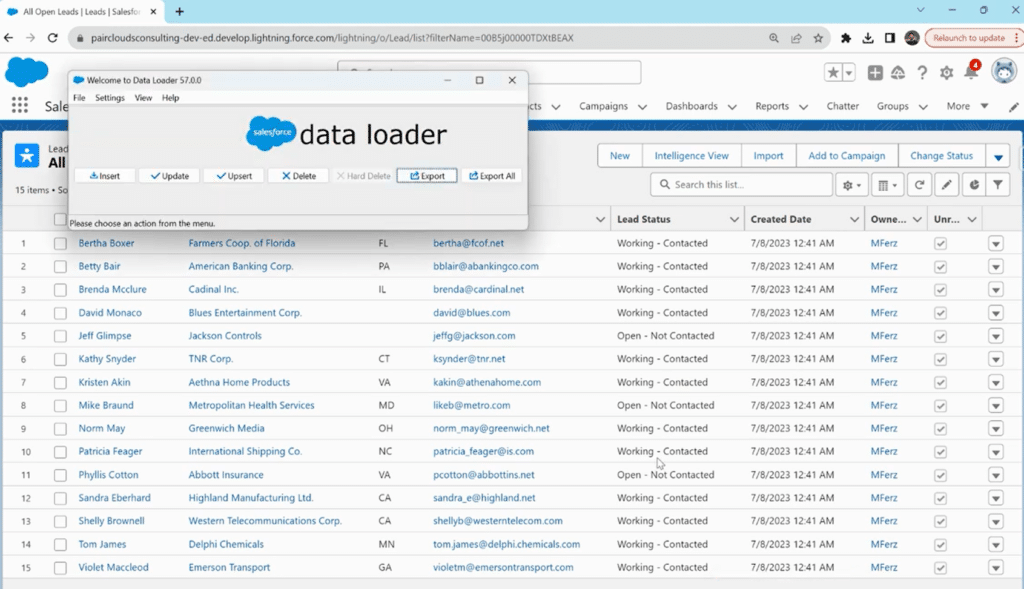
Install and Launch Data Loader
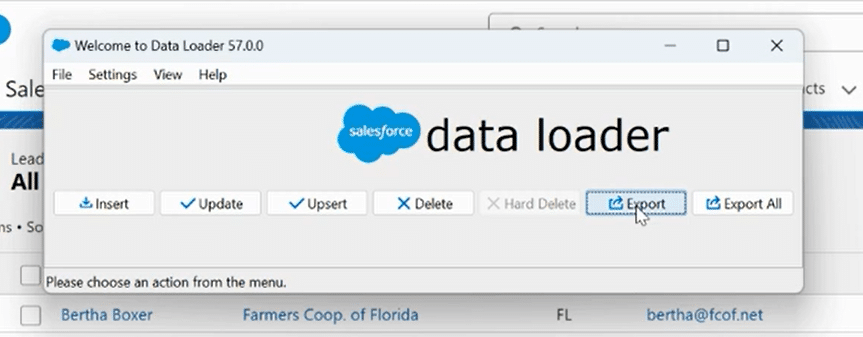
Access Salesforce’s built-in Data Loader tool. You can install it separately within the Salesforce ecosystem. Once installed, double-click on the Data Loader icon to launch the application.
Authenticate Your Account
Click on ‘Export’ on the pop-up window for the Data Loader.
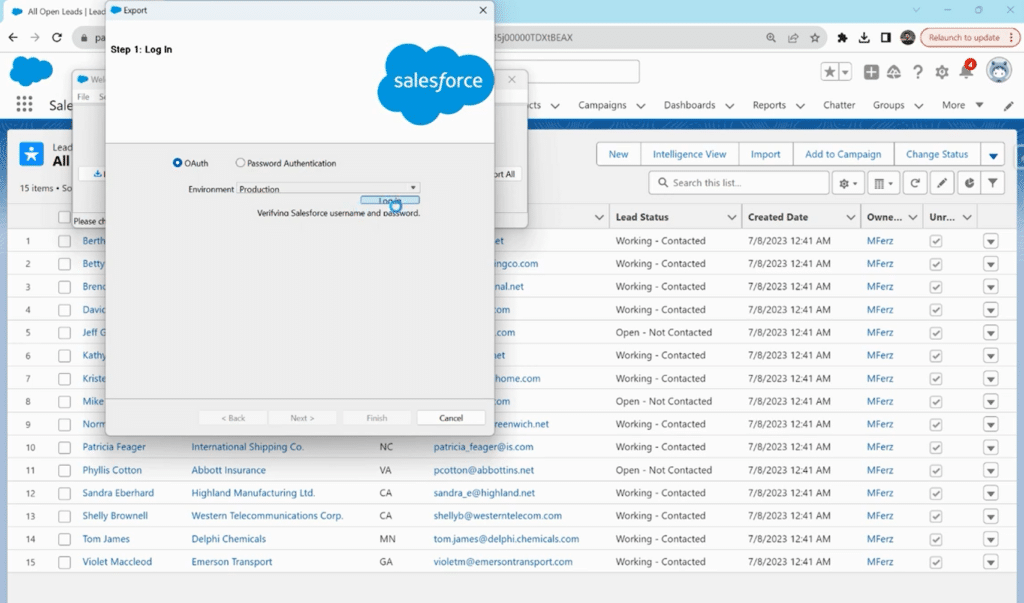
It will automatically connect to your logged-in Salesforce account and prompt you to authenticate in several steps. Follow the directions for authentication using your Salesforce account.
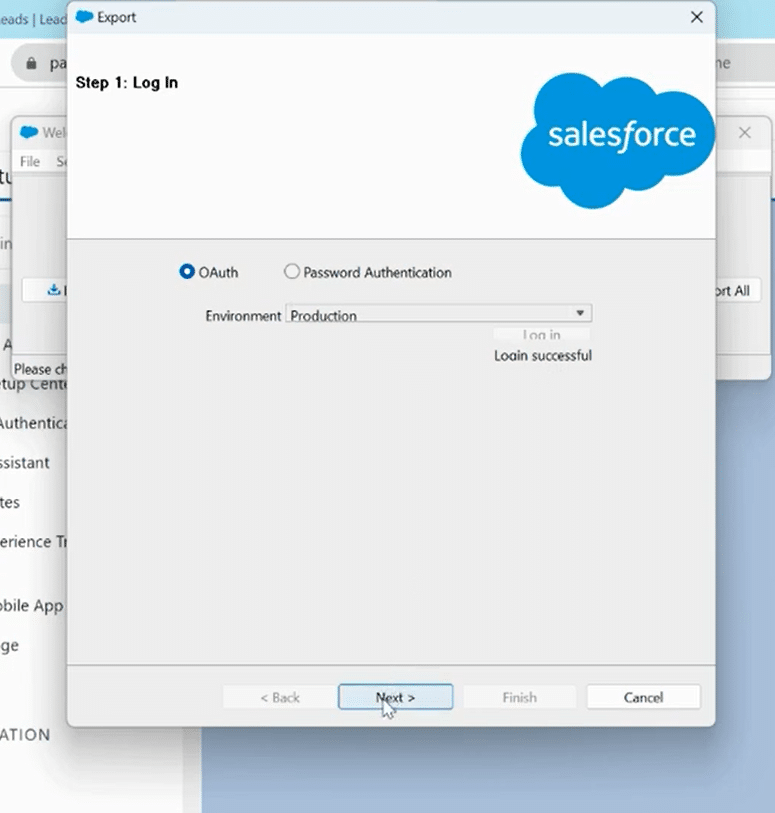
Once done, relaunch the data loader tool. It will show ‘login successful’ this time.
Click on ‘Next’ to start the data export process.
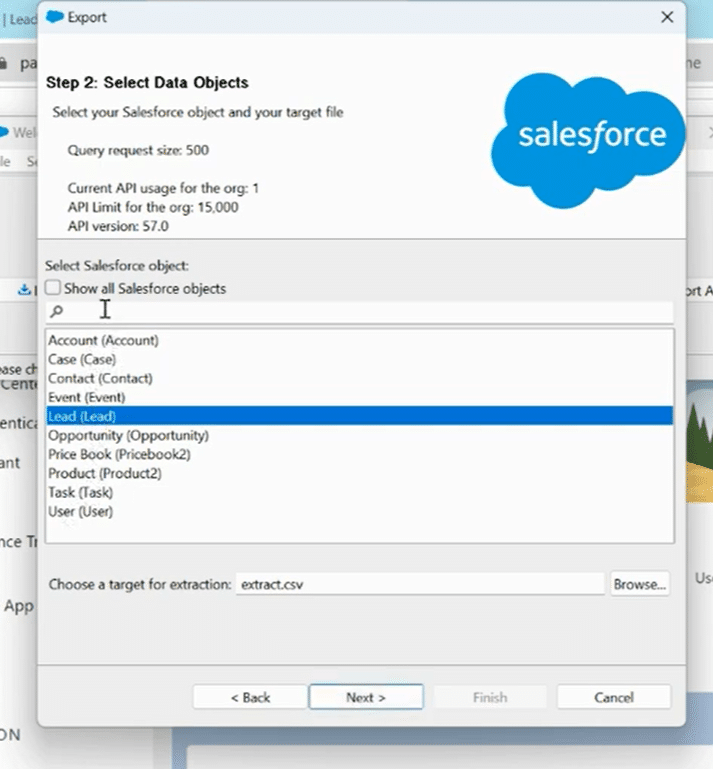
Select Data Objects
The next step is to select which object you need the data from. The drop-down list will show several options, e.g., accounts, Leads, and Opportunities. Select the object that holds your data to export.
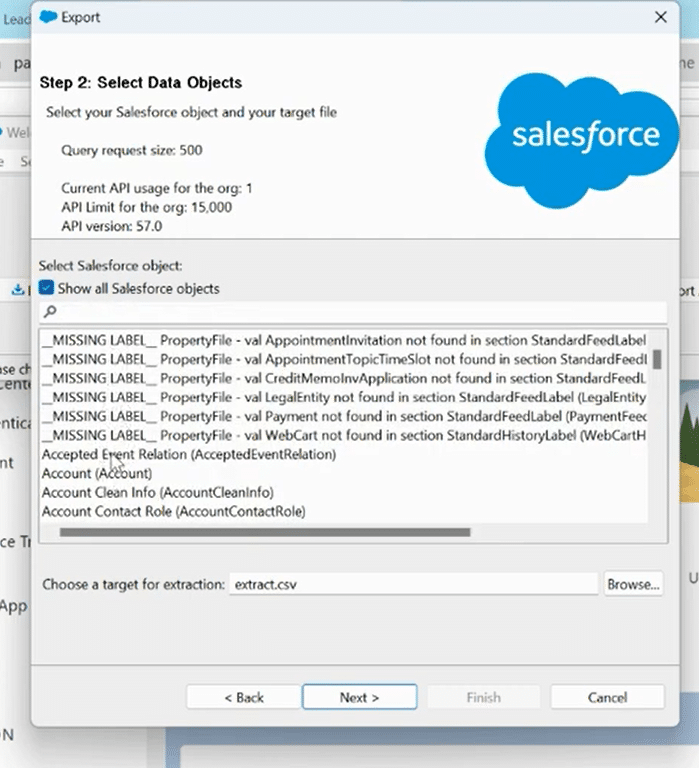
If you can not find the object category you need, Click on the ‘Show all Salesforce objects’ checkbox. A complete list will appear in the drop-down menu, including your custom abject categories or unnamed categories.
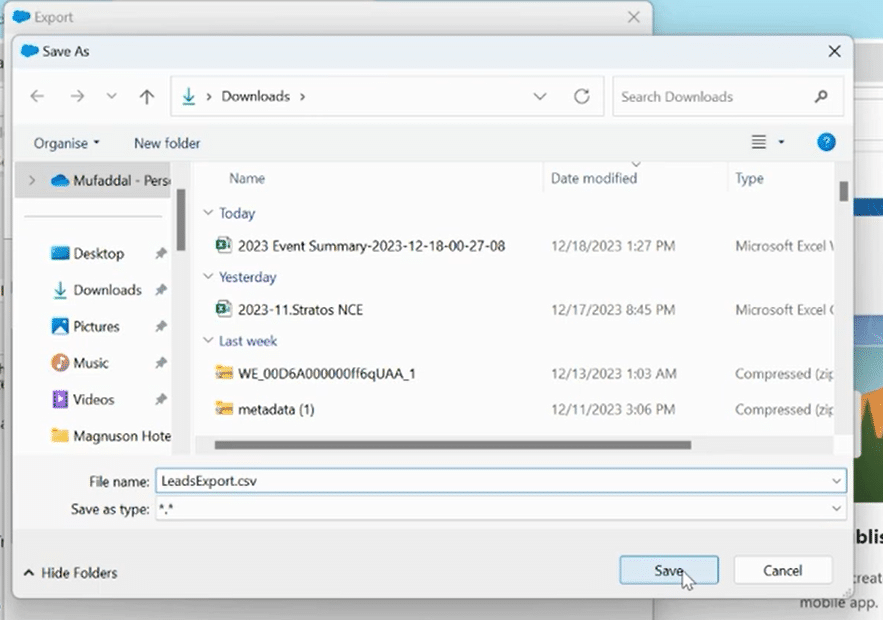
Choose Target Location
In the same window, at the bottom, Click on ‘Browse’ to select the target location for the extraction of your CSV file.
A new pop-up window will appear. Select the folder where you wish to store your exported file and click ‘Save.’
Once the window returns to export, click ‘Next’ to proceed with the final steps.
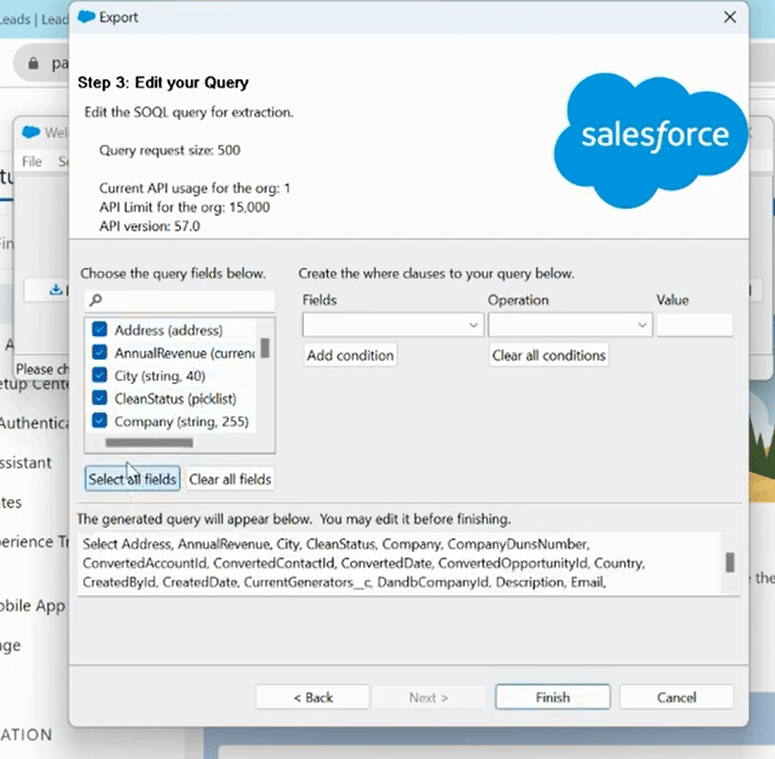
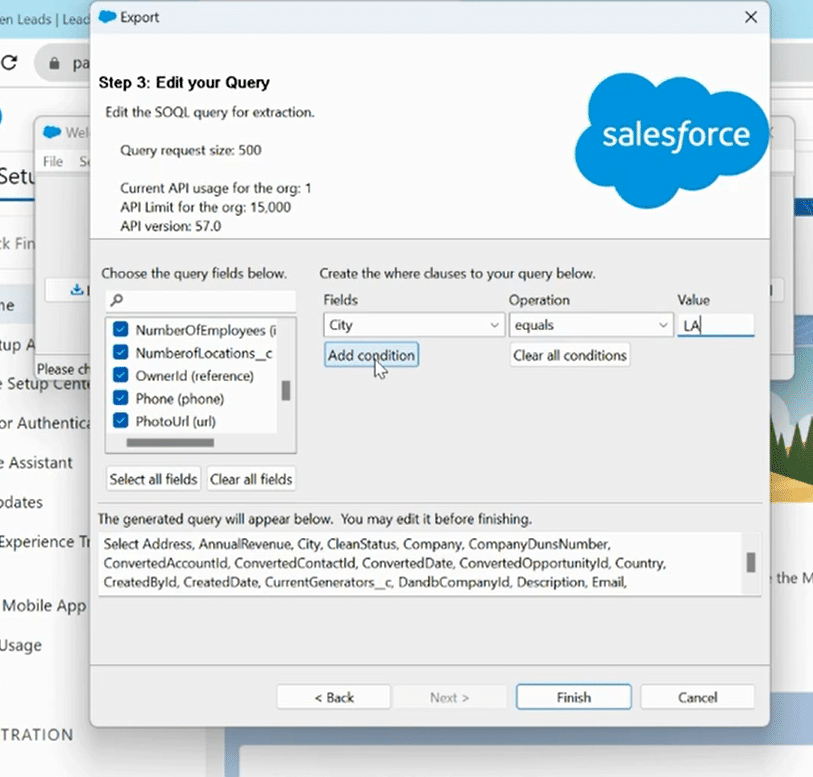
Edit Query or Condition
You can edit your SOQL query for extraction and add conditions to sort and filter out data before saving your CSV file. In the Query drop-down list, you can select a range of fields you want to keep in your export file.
You can choose selective fields manually or click ‘Select all fields.’
In the conditions section, you can create where clauses for your query. You can add fields, operations, and values to specify the data you want to export.
For example, to only get Leads from LA, you can fill in Fields: City, Operation: Equals, Value: LA. The resulting data will consist of only what qualifies for this condition.
If you don’t wish to add any conditions, simply leave the section blank or click ‘Clear all conditions.’
Save the File
Once you finish the last step, navigate and click on the ‘Finish’ button.
That’s all! The final window will show how many extractions went into your CSV file based on your criteria. You can also view your file by clicking on ‘View Extraction’ here.
Salesforce Data Export: Best Practices and Tips
Efficient Salesforce data export is not only about the process itself but also about ensuring data integrity, security, and usability.
Implementing best practices and tips in your data export strategy will provide a seamless, error-free experience.
Choose Appropriate File Formats
Before exporting data, ensure compatibility between Salesforce and Excel file formats. Choose file formats that preserve data integrity and formatting. Consider using CSV (Comma-Separated Values) for straightforward data transfer within the Salesforce interface for simple data backup.
Maintain Data Integrity
Verify the accuracy of your data during and after the export process. Ensure that data relationships, such as parent-child connections, are maintained. Regularly check for duplicate records and discrepancies to prevent data corruption.
Automate Data Updates
Leverage Coefficient’s automation capabilities to schedule regular data updates. By automating the export process, you reduce the risk of human error, ensure data is consistently up-to-date, and free up valuable time for more strategic tasks.
Implement Data Filters
When exporting specific datasets, utilize Salesforce’s filtering options. Narrow your export to relevant records by applying filters based on criteria such as date ranges, record types, or custom fields. This enhances data relevance and reduces the volume of exported data.
Backup Your Data
Before initiating any significant data export, back up your Salesforce data. This precautionary measure ensures that you have a secure copy of your data to fall back on even in the event of unexpected issues or errors during the export process.
Export Salesforce Data to Multiple Fronts with Coefficient!
By following this comprehensive guide on how to export Salesforce list to Excel, you can scale your business with the tools and knowledge necessary to harness the full potential of your data, lists, reports, and opportunities.
Take the first step by trying Coefficient for free toward streamlined imports and exports from Salesforce to Excel.
Struggling to view all your Salesforce data? Salesforce’s limit on displaying report rows can be a real pain, especially when you’re dealing with extensive datasets.
If you’ve ever found yourself wanting to analyze or edit more than 2,000 records from your Salesforce reports, you’re in the right place. This guide will walk you through the steps to export and manage large Salesforce data sets with ease, transforming what seems like a daunting task into a straightforward process.
Understanding Salesforce Export Limits
First off, it’s crucial to understand why you’re hitting this roadblock. Salesforce has a display limit that only allows up to 2,000 rows to be viewed directly from the platform’s report view.
This limitation ensures platform performance and stability but can be a hurdle when you need to work with large data sets.
Prepping Your Salesforce Report for Export
Before you dive into exporting, you need to prepare your report. Ensure your report is configured to display all the data you need, keeping in mind the types of data you’ll be analyzing or editing once exported.
Step-by-Step Guide to Exporting Your Report
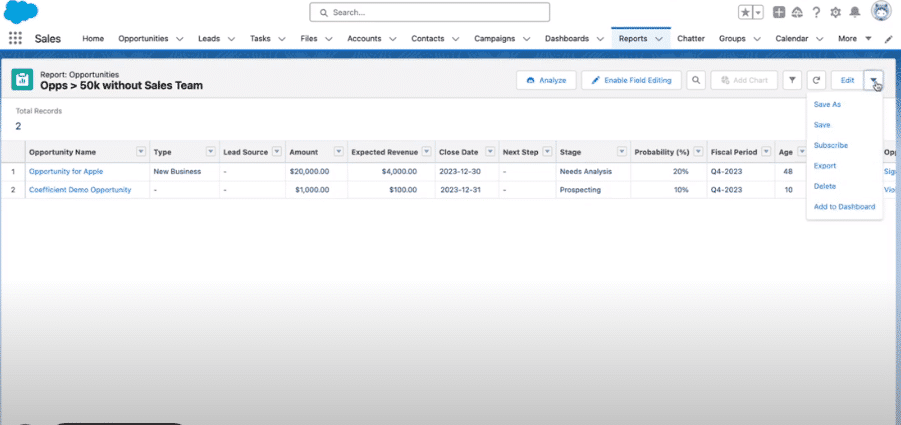
Navigating the Export Process
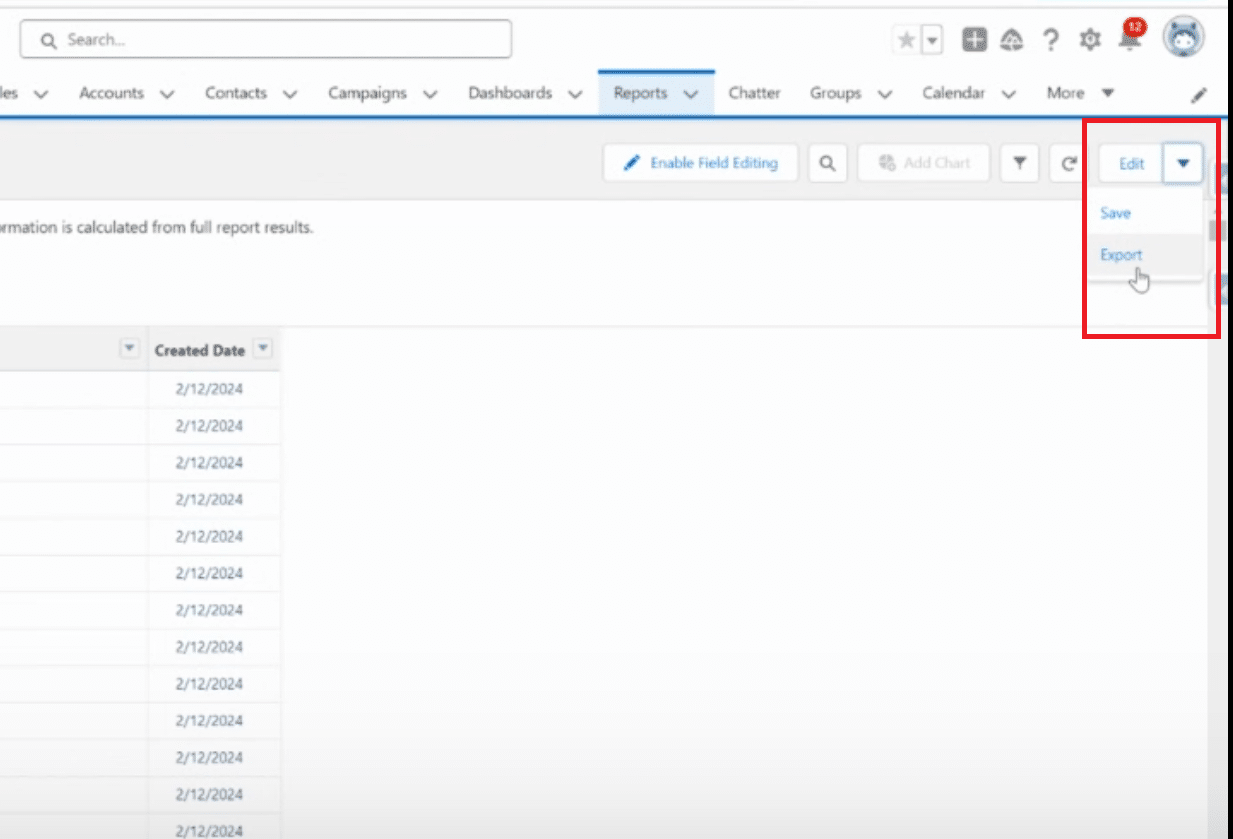
Once your report is ready, locate the ‘Export’ button. This option is typically found near the ‘Edit’ button within your report view.
Salesforce provides a straightforward way to export your data, ensuring you can access your entire dataset without being capped by the viewing limit.
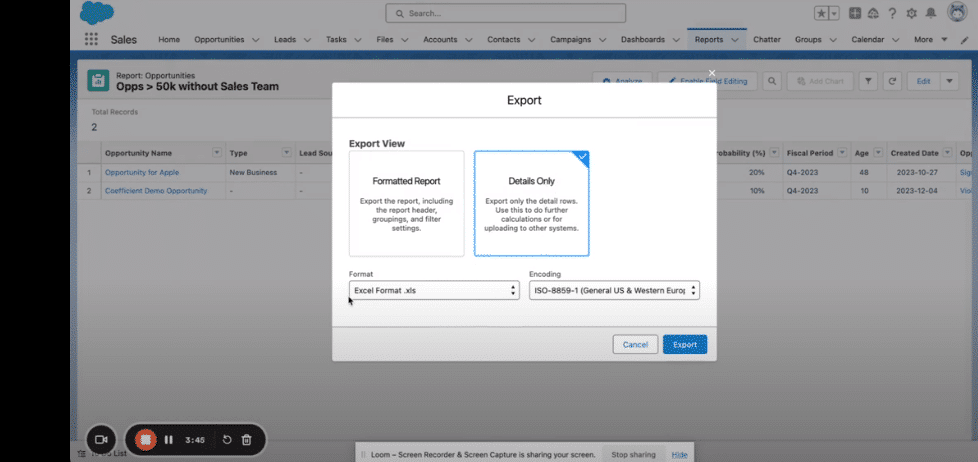
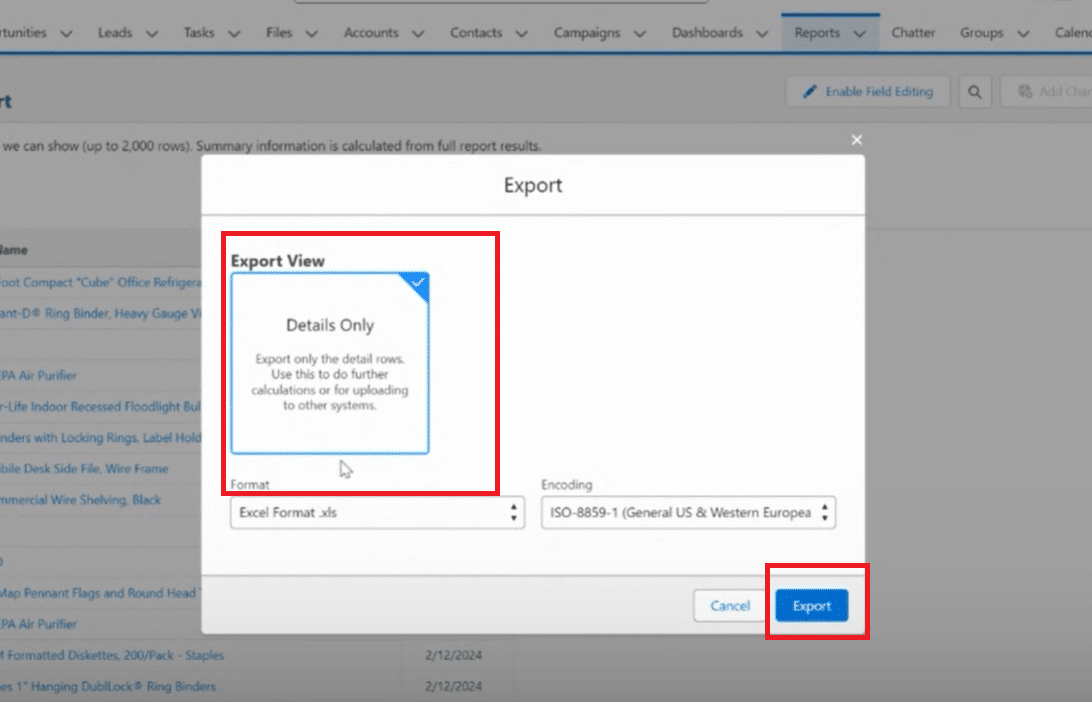
Choosing Your Export Format
When prompted, select Excel as your export format. This choice is popular among Salesforce users due to Excel’s flexibility and powerful data manipulation features.
Click ‘Export’ to initiate the download of your report file.
Handling Your Large Salesforce Export in Excel
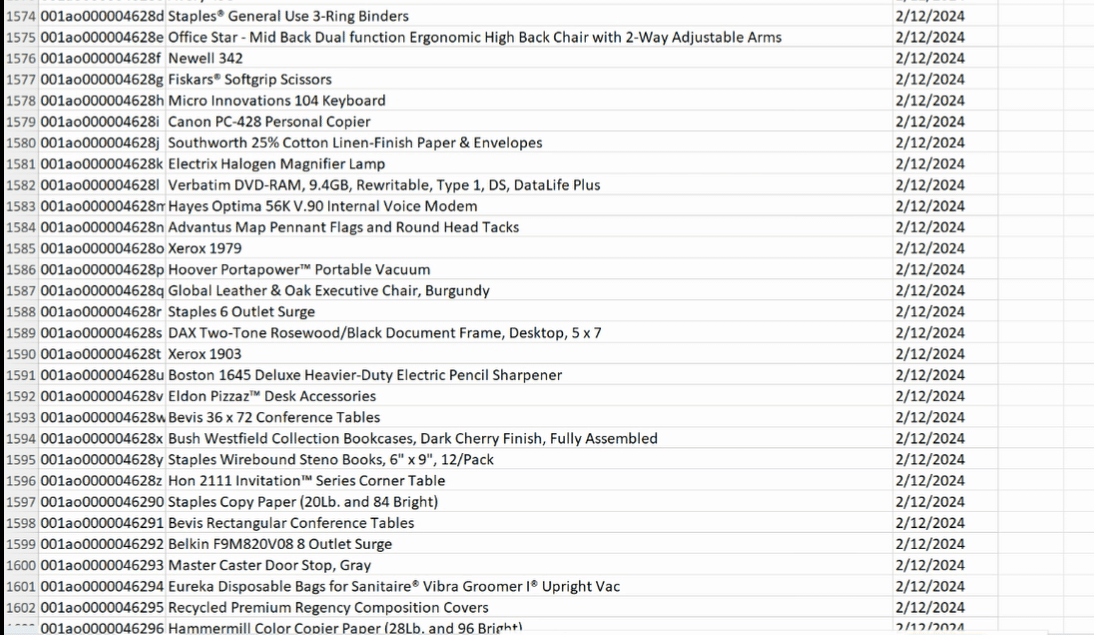
Upon downloading your report, open the file in Excel. Here, you’ll notice all your records are present, surpassing the 2,000 record viewing limit enforced by Salesforce.
Scrolling down to the bottom, you can see the total count matches the expected number of records, confirming that you now have access to your full dataset.
Tips for Managing and Analyzing Large Data Sets in Excel
Utilize filtering and conditional formatting to navigate through your data efficiently.
Use pivot tables to summarize and analyze specific data segments.
Consider breaking down large datasets into manageable chunks by splitting your data into multiple sheets if necessary.
Using Coefficient to Simplify Data Management
While exporting and managing your data in Excel is a solid solution, consider elevating your Salesforce data management experience with Coefficient.
As a highly acclaimed 5-star rated tool on AppExchange, Coefficient offers seamless integration with both Google Sheets and Excel, allowing you to effortlessly import, analyze, and report your Salesforce data.
With features like real-time data refreshes, automatic data import, and direct updates from spreadsheets, Coefficient streamlines complex processes into user-friendly operations, empowering your team to stay ahead with timely insights.
Conclusion
Exporting large Salesforce reports and managing them in Excel might seem daunting, but it’s an achievable task with the right steps. By following this guide, you can bypass Salesforce’s display limitations, gaining full access to your valuable data.
For an even more streamlined experience, consider exploring Coefficient’s powerful integration solutions, designed to revolutionize your Salesforce strategy and elevate your data management processes.
Importing leads into Salesforce. The digital equivalent of doing taxes.
Nobody enjoys it. It’s unnecessarily complicated, and one small error can create big problems down the line. And yet, it’s a critical process that determines whether sales teams thrive or struggle.
TLDR
Step 1:
Install Coefficient at Coefficient.io or from Google Sheets or Excel marketplace
Step 2:
Launch Coefficient sidebar and select “Export to…” then choose Salesforce as destination
Step 3:
Select “Leads” as target object and map your spreadsheet columns to Salesforce lead fields
Step 4:
Configure import settings and validation rules
Step 5:
Execute the import to transfer lead data directly into Salesforce
Step 6:
Set up automatic sync schedule (optional) for ongoing lead management
RevOps teams spend countless hours cleaning spreadsheets, fixing field mappings, duplicate records, creating custom objects and dealing with re-import errors. Every minute lost is time not spent driving revenue growth.
What if you can create an two-way automated sync between your spreadsheets, Salesforce, and other systems?
Quick Video Walkthrough to Import Data into Salesforce Automatically
The results:
Faster sales cycles and higher conversion rates
Dramatically improved hygiene in data management
More accurate forecasts and confident decision-making
Here’s how this changes the game and makes lead management a breeze:
Reduce your CSV dependence when importing leads
The Painpoint – RevOps teams waste hours wrestling CSV files, cleaning fields, setting up permissions and fixing mismatched mappings. The Fix – Coefficient eliminates this busywork by:
Importing directly from spreadsheets to Salesforce: Create a two-way sync between your spreadsheet and Salesforce—no more CSV exports or manual uploads.
Standardizing data automatically: Apply transformations (like field renaming, merging duplicates) directly in your spreadsheet that persist with every refresh.
Empowering your entire team: Share connections across your org so everyone can pull and refresh data without requesting CSV files.
Get new leads to sales teams instantly
The Painpoint – Delays between lead capture and first sales contact kill conversions.
The Fix – Coefficient reduces that lag by:
Automating lead imports on a flexible schedule — Schedule data updates hourly, daily, or weekly, ensuring sales always has the freshest leads without manual intervention
Triggering Salesforce workflows promptly — Get new leads into Salesforce faster, activating assignment rules that route prospects to the right reps when interest is highest
Alerting teams to new opportunities — Set up automatic Sack and email notifications when specific conditions are met, enabling immediate follow-up on qualified leads
Case Study – How Miro scaled lead management during 10X growth
Miro’s RevOps team was drowning. As the company surged from 200 to 2,000 employees, their manual reporting couldn’t keep up. Two people. Endless requests. Limited visibility into their sales funnel.
Alex Bugajski, Head of Go-to-Market Strategy, found a lifeline in Google Sheets. Not just any spreadsheet—one supercharged with Coefficient. Alex built three solutions that transformed their operations:
Real-Time SLA Tracking: Miro built a daily metrics dashboard that shows how leads move through the funnel, allowing SDRs to monitor conversion rates and make immediate adjustments without waiting for weekly reports.
Automated Account Routing: Their team replaced manual territory assignments with a self-sustaining system that requires just quarterly updates, saving hours of work while ensuring leads reach the right AEs, CSMs, and SEs without delay.
Multi-Source Forecasting: By combining Salesforce data with product usage signals, Miro created more accurate forecasting that helps sales leaders prioritize opportunities with the highest likelihood to close.
“Not only could I design and optimize solutions, but I also could manage analytics, data modeling, hygiene reporting, and error checks with more scalability than ever before in Salesforce,” says Alex.
Read the entire story to see how Miro’s RevOps team unlocked real-time data empowerment with Coefficient.
Step-by-Step Guide to Upload Leads in Salesforce Manually
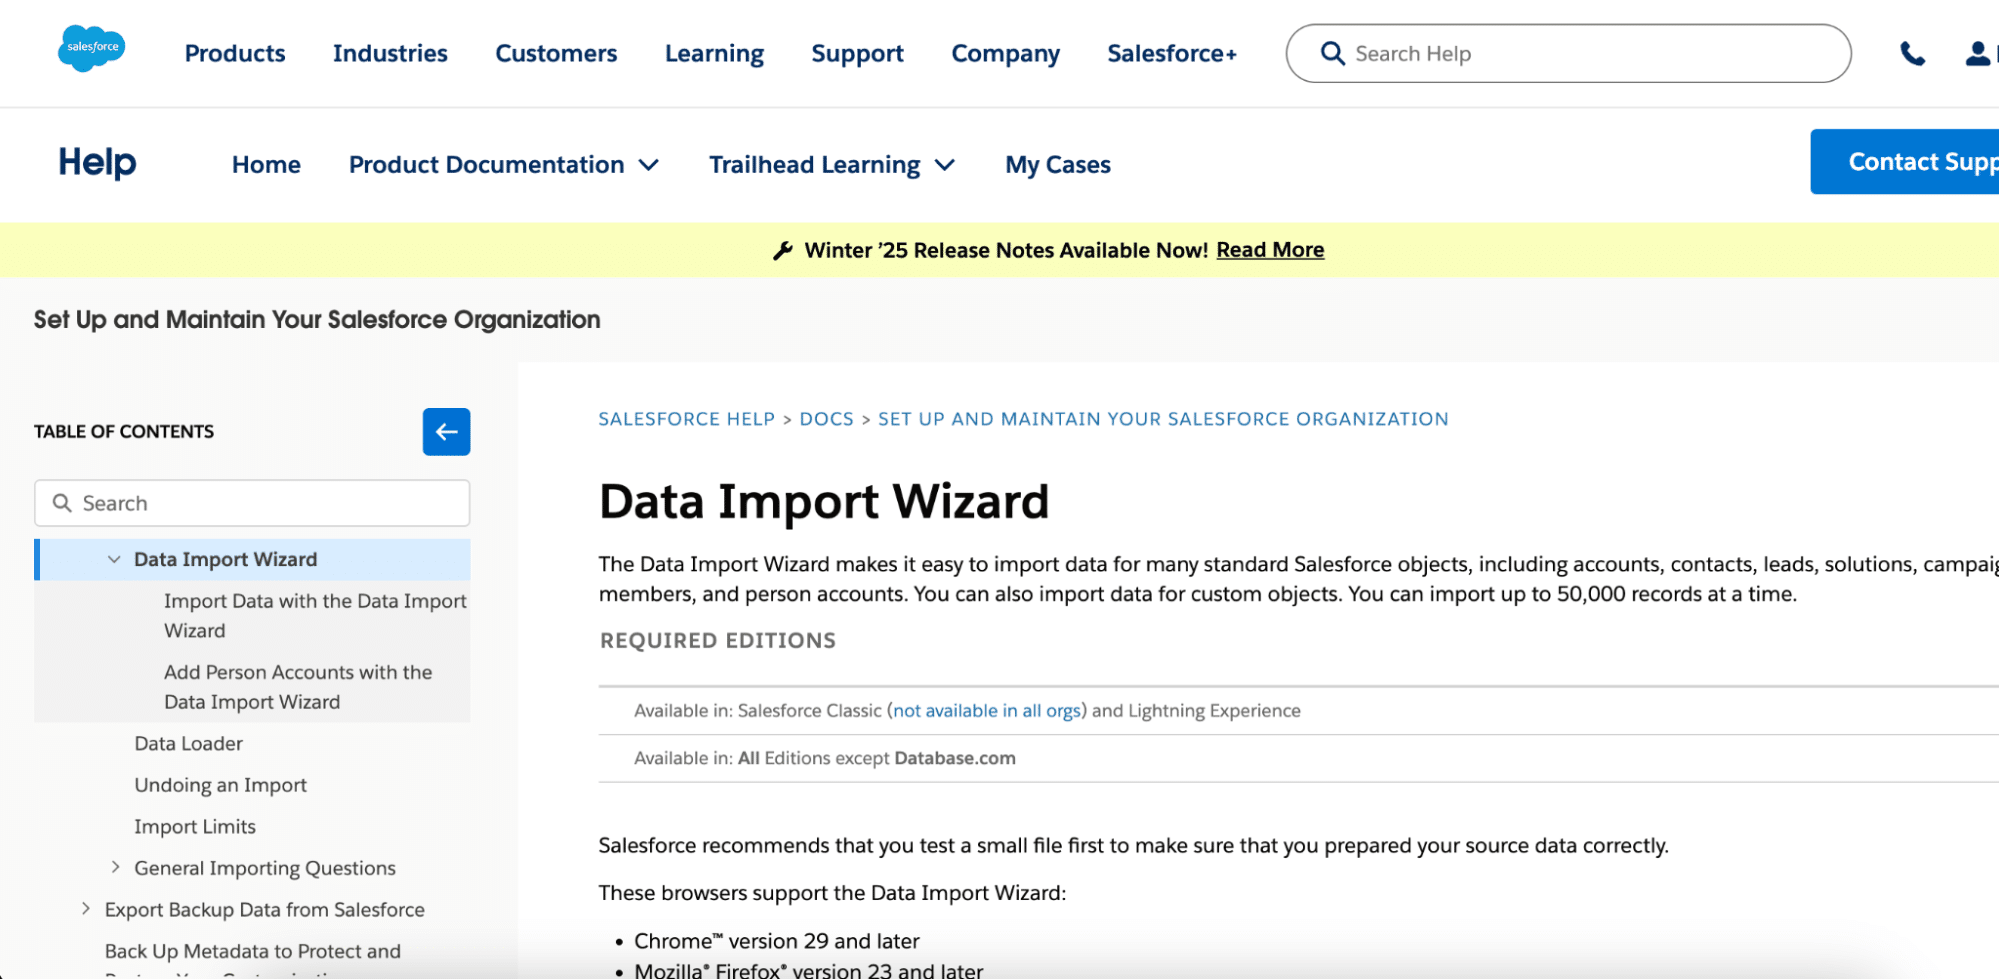
Salesforce’s data import wizard seems simple enough to use on paper:
Step 1: On the Leads home page, navigate to Setup → Data Import Wizard → Launch Wizard
Step 2: Select Leads → Add New Records
Step 3: Upload your CSV file and map the fields
Step 4: Review your mappings and click Start Import
Step 5: Wait for completion and check for errors. You can check the details data load job in setup page.
Step 6:Refresh the Leads home page to see your newly imported leads.
Bulk Transfer Leads in Salesforce
Coefficient connects spreadsheets directly to Salesforce, eliminating tedious manual imports. For RevOps teams, this makes lead management faster and more reliable.
It’s quick to set up, free to get started, and lets you bulk update records in seconds. Here’s how it works:
Step 1: Connect your spreadsheet to Salesforce and your other business systems using Coefficient (install from Extensions Menu in Google Sheets or Excel)
Step 2: Unify, clean, and format your data directly in your spreadsheet – perfect for working with leads, contacts, opportunities, or any object
Step 3: Export your changes back to Salesforce in bulk with just a few clicks – select your target object, map your fields, and click Export
Optional: Set up auto-refresh to keep your data current without manual updates
That’s it! Your changes appear in Salesforce instantly, saving hours of manual work.
Ready to see how Coefficient can transform your lead management—just like it did for Miro and countless other teams? Try Coefficient for yourself today!
Avoid problems with frequent manual uploads
Type of data in your lead lists typically comes from various sources—marketing automation tools and third-party enrichment providers—forcing you to spend valuable time unifying, cleaning, and formatting data in your spreadsheet.
Even after careful preparation, import processes often fail, creating a frustrating cycle of corrections and re-imports. It’s exhausting and drains productivity.
It doesn’t have to be this way. Imagine effortlessly pulling, cleaning, and enriching leads directly in your spreadsheet, then seamlessly importing them into Salesforce without the headaches.
Yes, Absolutely! But here’s the thing, Salesforce’s built-in import tools (like Data Import Wizard and Data Loader) can be a real headache. You’re constantly wrestling with CSV formatting, field mapping gets confusing, and one small mistake can mess up your entire import.
That’s where a tool like Coefficient shines. Instead of jumping through hoops, you just work with your leads in Excel or Google Sheets. Once your data looks good, Coefficient syncs it straight to Salesforce. Either when you want or automatically on schedule. No more formatting nightmares, way fewer errors, and you stay in control of your data quality. It’s honestly just a smoother way to get your leads where they need to go.
How do I mass transfer leads in Salesforce?
Go to the quick find box and type “mass transfer”
Select the type of record (leads) from the list of objects
Enter the name of the existing record owner in the “transfer from” field
Choose the new owner for the leads
Select which leads to transfer based on criteria
While this process works for ownership changes, managing lead data more broadly can be challenging.
Coefficient lets you analyze lead assignments in a spreadsheet and push updates back to Salesforce, giving you more control over your lead management process.
How to add bulk leads in Salesforce?
Click the Leads tab in Salesforce
In the View drop-down, select the desired view of leads and click Go
Choose the list of leads you want to work with
Click “Add to Sales Campaign” to add the selected leads
This approach works for adding existing leads to campaigns, but creating new leads in bulk requires different steps.
Coefficient simplifies the process by letting you prepare bulk data in spreadsheets (where data cleaning is easier) and then import it directly to Salesforce, with options for scheduling regular imports.
How to import leads from Sales Navigator to Salesforce?
From Sales Navigator Admin Home, select Admin Settings
Click Change in the CRM Settings section
Scroll to “Allow lead creation from Sales Navigator” and set the toggle to Yes
Select a Lead Source value to associate with leads created from Sales Navigator
While this integration is helpful, it still requires manual work in Sales Navigator.
Coefficient offers complementary value by allowing you to combine LinkedIn data with other sources in spreadsheets, enrich it with additional information, and then import the complete lead records to Salesforce, creating more valuable prospect profiles.
When you’re done reading this guide, you’ll have actionable tips to streamline your data export and import processes so you don’t spend countless hours inputting and updating data.
Top 5 methods to export and import Salesforce data
There are several ways to export and import data into your Salesforce account, including using built-in tools and third-party data connectors for Salesforce. However, in this guide, we’ll focus on the five common ways to export and import your Salesforce data.
Coefficient – Top-rated data automation solution for Salesforce imports and exports
Native Salesforce Data Management – Import Wizard & Data Export Service
Salesforce API – Developer-focused programmatic access
TLDR
Step 1:
Get Started by installing Coefficient Add-on for Google Sheets or Excel
Step 2:
Launch Coefficient from Extensions Menu.
Step 3:
Click Import Data from the Coefficient sidebar, then select Salesforce as your data source.
Step 4:
Select the Salesforce account you want to connect and click Connect.
Step 5:
Specify your import’s Object fields by clicking Select Fields
Step 6:
Click on Import to start pull data from Salesforce into your spreadsheet.
Step 7:
Set an auto-refresh schedule hourly, daily, or weekly. This automates updating your Salesforce data on Google Sheets or Excel when your source data changes.
Video Walkthrough: How Export Data from Google Sheets to Salesforce
Method 1. Coefficient
Out of the three methods presented, Coefficient is the best option to export and import Salesforce data from Google Sheets and Excel, especially for businesses dealing with massive data volumes with a simple six step process that’d take 2-3 minutes. Companies like Klaviyo reclaimed two months worth of manual operations work using Coefficient.
Coefficient’s solution makes building your dashboards and reports effortless and analyzing data a breeze since it gets updated in real time, let alone automatically. In fact, you can give a Google Sheets Salesforce dashboard template a try in just a few clicks.
For instance, if you want to export Salesforce data and import it into Google Sheets, simply open a new Google Sheets file and launch the Coefficient Data Connector Add-on.
Note: You can follow the same steps in Excel as well after installing the Coefficient for Salesforce Excel Add-in. Click Import Data, select Salesforce as your data source, and choose whether to import from reports, objects or specific fields, or a custom SOQL query.
Coefficient lets you choose from several data sources.
After authorizing the connection, your data instantly exports from Salesforce to your Google Sheets file. You can add and remove data fields as you go along, so you only work with the data you need without repeating the exporting process.
Coefficient also auto-refreshes your exported data on Google Sheets, so you never have to build the same analysis or keep exporting your file every time your Salesforce data changes or gets updated.
Schedule your data imports in Coefficient easily.
Schedule live data refreshes hourly, daily, or weekly by setting the frequency, day, and time in the Scheduled Run option. This ensures your data is always accurate and up-to-date.
Coefficient’s powerful features make your Salesforce data exporting (and importing) quick, easy, automated, and completely effortless, bolstering your data workflows and analysis.
Common Methods to Export and Import Salesforce Data
When you’re done reading this guide, you’ll have actionable tips to streamline your data export and import processes so you don’t spend countless hours inputting and updating data.
Top 5 methods to export and import Salesforce data
There are several ways to export and import data into your Salesforce account, including using built-in tools and third-party data connectors for Salesforce. However, in this guide, we’ll focus on the five common ways to export and import your Salesforce data.
Coefficient – Top-rated data automation solution for Salesforce imports and exports
Native Salesforce Data Management – Import Wizard & Data Export Service
Salesforce API – Developer-focused programmatic access
TLDR
Step 1: Get Started by installing Coefficient Add-on for Google Sheets or Excel
Step 2: Launch Coefficient from Extensions Menu.
Step 3: Click Import Data from the Coefficient sidebar, then select Salesforce as your data source.
Step 4: Select the Salesforce account you want to connect and click Connect.
Step 5: Specify your import’s Object fields by clicking Select Fields
Step 6: Click on Import to start pull data from Salesforce into your spreadsheet.
Step 7: Set an auto-refresh schedule hourly, daily, or weekly. This automates updating your Salesforce data on Google Sheets or Excel when your source data changes.
Video Walkthrough: How Export Data from Google Sheets to Salesforce
Method 1: Coefficient
Out of the five methods presented, Coefficient is the best option to export and import Salesforce data from Google Sheets and Excel, especially for businesses dealing with massive data volumes with a simple six step process that’d take 2-3 minutes. Companies like Klaviyo reclaimed two months worth of manual operations work using Coefficient.
Coefficient’s solution makes building your dashboards and reports effortless and analyzing data a breeze since it gets updated in real time, let alone automatically. In fact, you can give a Google Sheets Salesforce dashboard template a try in just a few clicks.
For instance, if you want to export Salesforce data and import it into Google Sheets, simply open a new Google Sheets file and launch the Coefficient Data Connector Add-on.
Click Import Data, select Salesforce as your data source, and choose whether to import from reports, objects or specific fields, or a custom SOQL query.
Show Image
Coefficient lets you choose from several data sources.
After authorizing the connection, your data instantly exports from Salesforce to your Google Sheets file.
You can add and remove data fields as you go along, so you only work with the data you need without repeating the exporting process.
Coefficient also auto-refreshes your exported data on Google Sheets, so you never have to build the same analysis or keep exporting your file every time your Salesforce data changes or gets updated.
Show Image
Schedule your data imports in Coefficient easily.
Schedule live data refreshes hourly, daily, or weekly by setting the frequency, day, and time in the Scheduled Run option. This ensures your data is always accurate and up-to-date.
Advanced Coefficient Features
Beyond basic imports and exports, Coefficient offers powerful advanced features that transform how you work with Salesforce data. These capabilities eliminate manual data entry and provide real-time access to your CRM data directly within your spreadsheets.
Export to Salesforce (Upserts and Writebacks)
Coefficient’s Export to Salesforce feature lets you push updated data from your spreadsheets directly back into Salesforce, supporting sophisticated operations like upserts that can update existing records or create new ones automatically.
How to Export to Salesforce:
Step 1: Prepare your data
We recommend creating a Salesforce import of your data into Google Sheets/Excel using Coefficient before performing the Export to Salesforce. This allows automatic field detection and mapping.
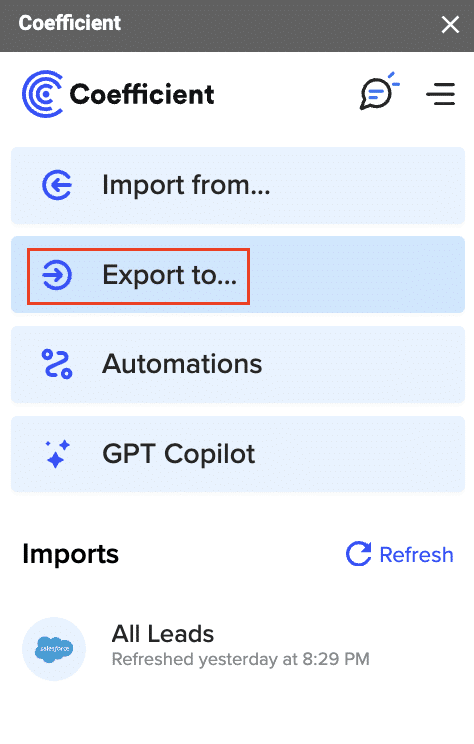
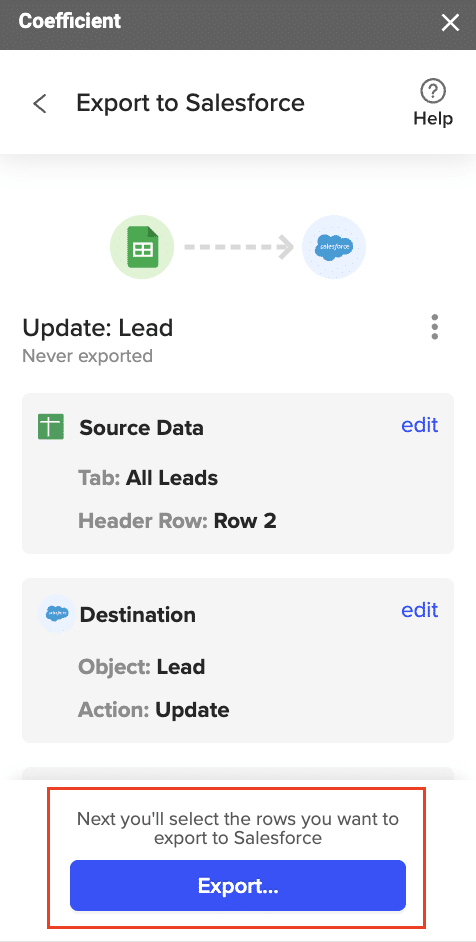
Step 2: Click “Export to…”
Open the Coefficient sidebar and click on the “Export to…” button, then select Salesforce as your destination.
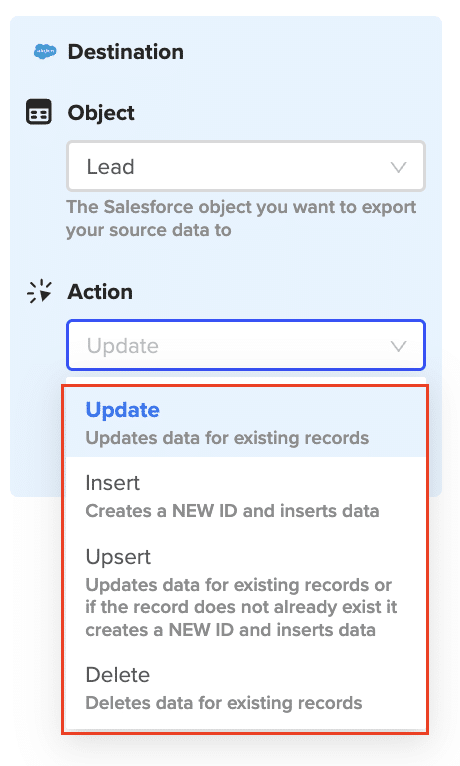
Step 3: Configure destination settings
Select the Tab and Header row (the row with Salesforce field headers), then choose your Salesforce Object and desired Action:
Update: Modifies existing records (requires record ID)
Insert: Creates new records
Upsert: Updates existing or creates new records (requires External ID field)
Delete: Removes entire records
Step 4: Map your fields
Coefficient automatically maps fields if your data came from a Salesforce import. For manual data, you’ll need to map columns to Salesforce fields yourself.
Step 5: Configure advanced settings
Column for Results: Choose where to write export status information
Batch Size: Set processing batch size (max 10,000 rows)
Export Empty Cells: Enable to clear existing Salesforce values in bulk
Include export button: Add a quick-access button to your sheet
Step 6: Preview and execute
Review your settings, select which rows to export, and use the “Preview Changes” option to see exactly what will be updated before pushing to Salesforce.
Real-time Formula Functions
Access live Salesforce data directly in your spreadsheet cells using Coefficient’s powerful formula functions. These formulas work like native spreadsheet functions but pull data straight from your Salesforce org.
=salesforce_lookup Function
Pull field values from a single Salesforce record by matching any field. It works just like VLOOKUP, but for your Salesforce data.
Coefficient’s powerful features make your Salesforce data exporting (and importing) quick, easy, automated, and completely effortless, bolstering your data workflows and analysis.
Pros
Coefficient is uber-easy to set up and install and you can get it up and running in seconds.
It’s a powerful tool that requires little to no effort when exporting and importing your Salesforce data.
Build once and refresh forever with auto-refresh schedules to ensure you always work with the latest and most accurate data.
You can use AI to build custom SOQL queries.
Coefficient supports multiple data source integrations to your spreadsheet like Hubspot, Stripe, Quickbooks for advanced data analysis.
No object data mapping and manual query building required since Coefficient works instantly and on the fly as soon as you set up your data source connections.
Upserts and writebacks are native to the Coefficient app
Cons
Coefficient has a free plan which is limited, but it offers affordable pricing plans.
Method 2: Salesforce native data management functionality
To import using Salesforce data import wizard, follow these steps.
Step 1: Prepare your file for import
In our example, we’ll show you how to import leads into Salesforce.
To prepare your file for import, be sure to:
Clean your import file for consistency and accuracy, such as deleting unnecessary details, enforcing name conventions, updating the info, removing duplicates, and correcting any spelling errors.
Change any configurations necessary to ensure successful Salesforce import. For instance, you may need to add new values to your picklists, make new custom fields, or temporarily deactivate some workflow rules.
Compare your import file’s data fields with the Salesforce fields you’re importing into to verify and ensure your data gets mapped into the right fields.
After preparing your import data, save it as a CSV file.
Step 2: Launch the Salesforce Data Import Wizard
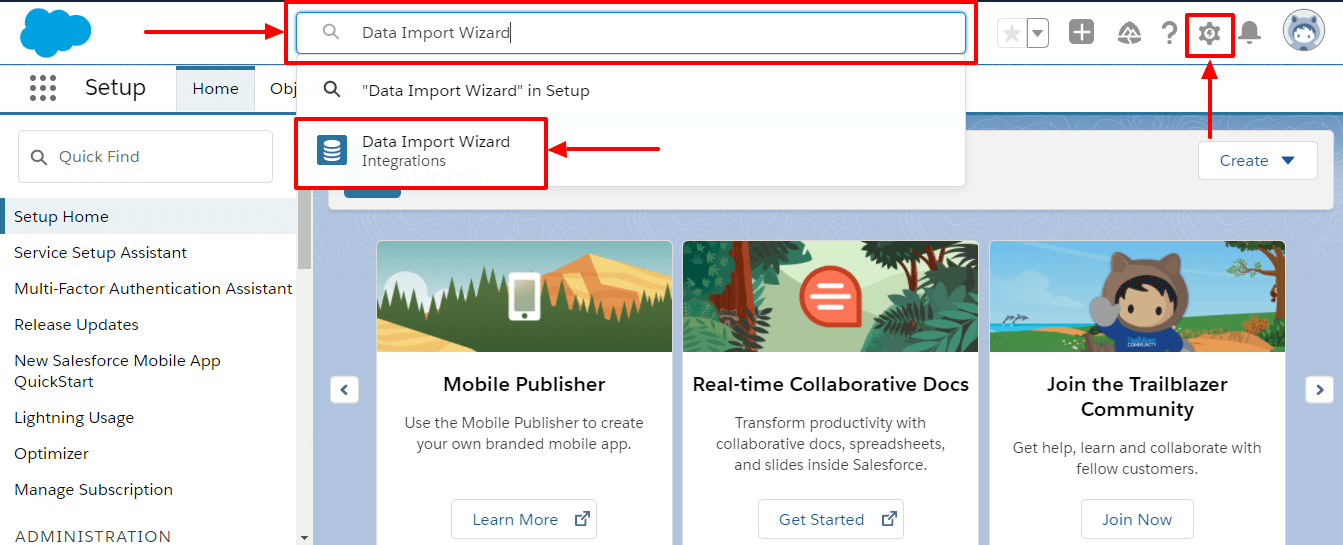
Click the Setup icon on the Salesforce interface, type in “Data Import Wizard” in the Quick Find search box, and select Data Import Wizard.
Use Salesforce’s search box to find the Data Import Wizard integration.
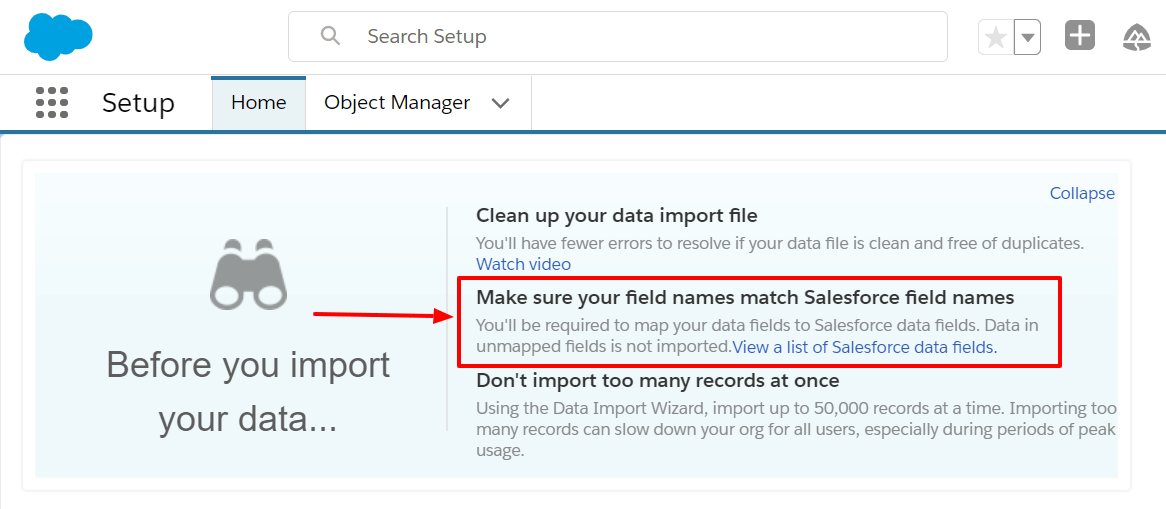
Review the Salesforce field names in your import file to ensure they match the standard Salesforce field names by clicking the View a list of Salesforce data fields link.
Follow the data import reminders before you begin importing.
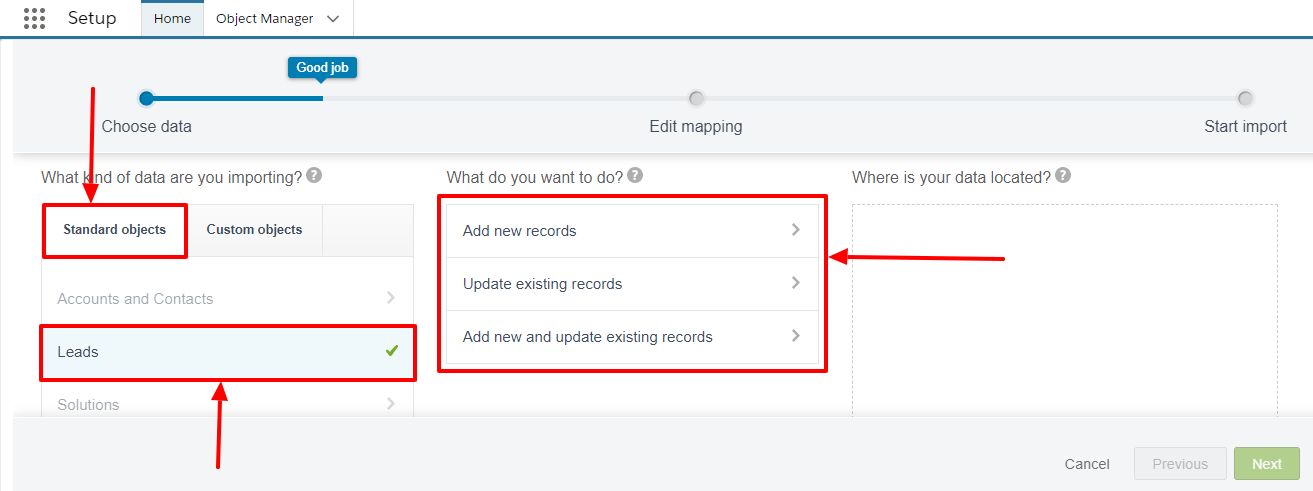
Click Launch Wizard! and choose the data to import. Under Standard Objects, click Leads. Other options under this tab include, Solutions, Accounts, Contacts, and Campaign Members.
Specify if you want to update your existing Salesforce records, add new records, or perform both simultaneously.
These are the fields you need to set up for data imports.
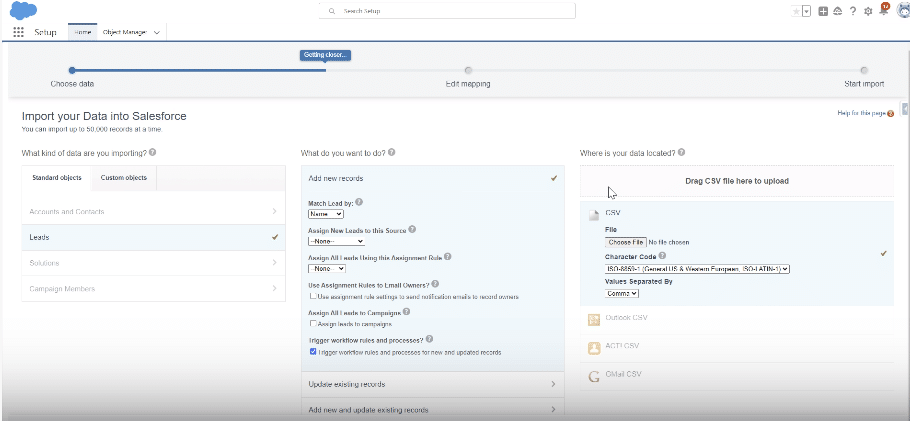
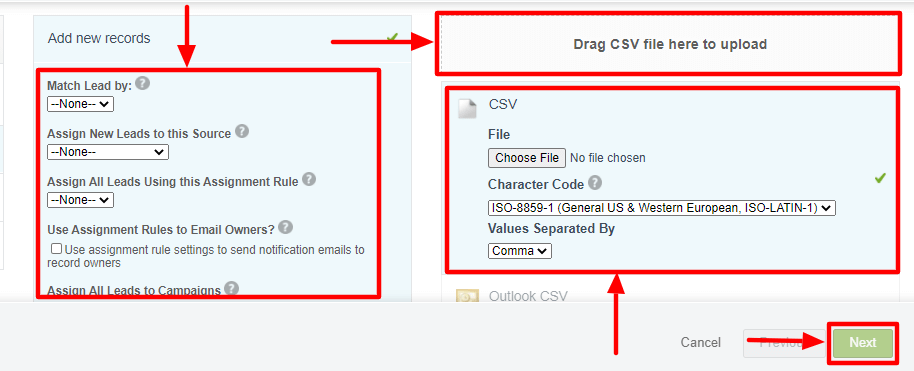
Select matching and other required criteria and upload the file where your data is located.
Drag and drop your CSV lead import file in the space provided or choose from the data source options, specify the character encoding method, and select your file.
Uploading your CSV file to Salesforce is easy.
Click Next when you’re done.
Step 3: Map your import file data fields to Salesforce data fields
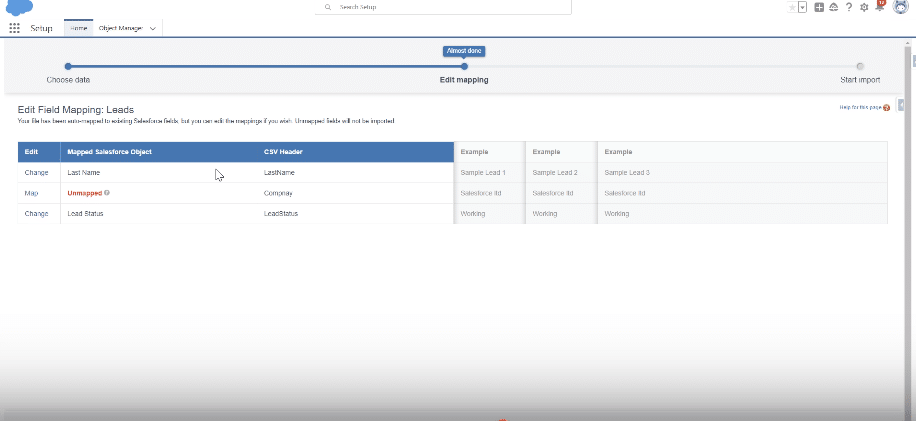
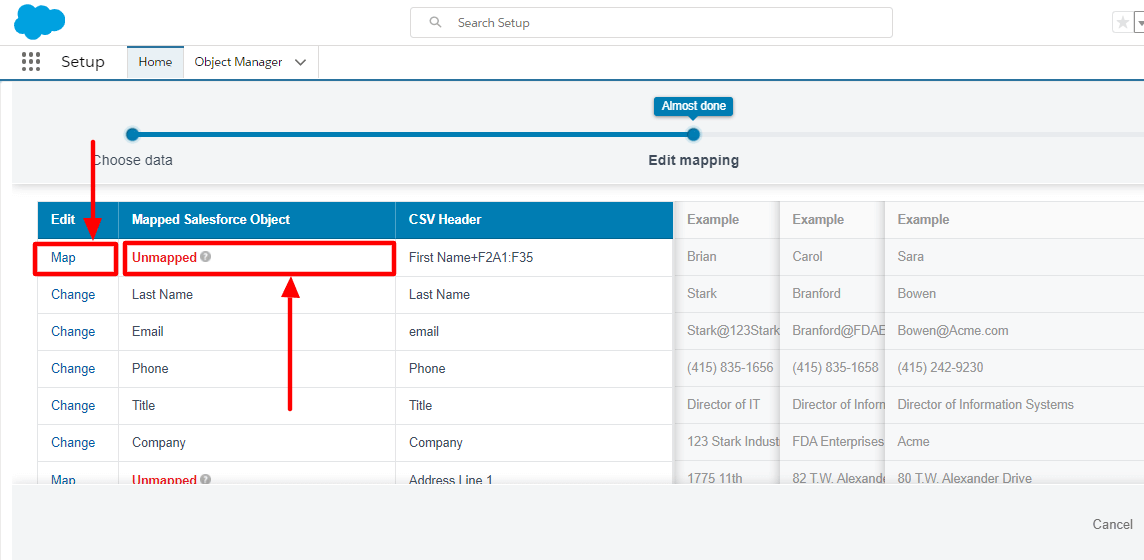
The data import wizard will automatically map as many data fields to Salesforce standard data fields as possible. If it can’t, you’ll need to do it manually since unmapped fields won’t be imported to Salesforce.
Salesforce will mark your unmapped fields. Click Map under the Edit column to change and map the fields to an existing Salesforce field.
The edit mapping interface is intuitive and easy to set up.
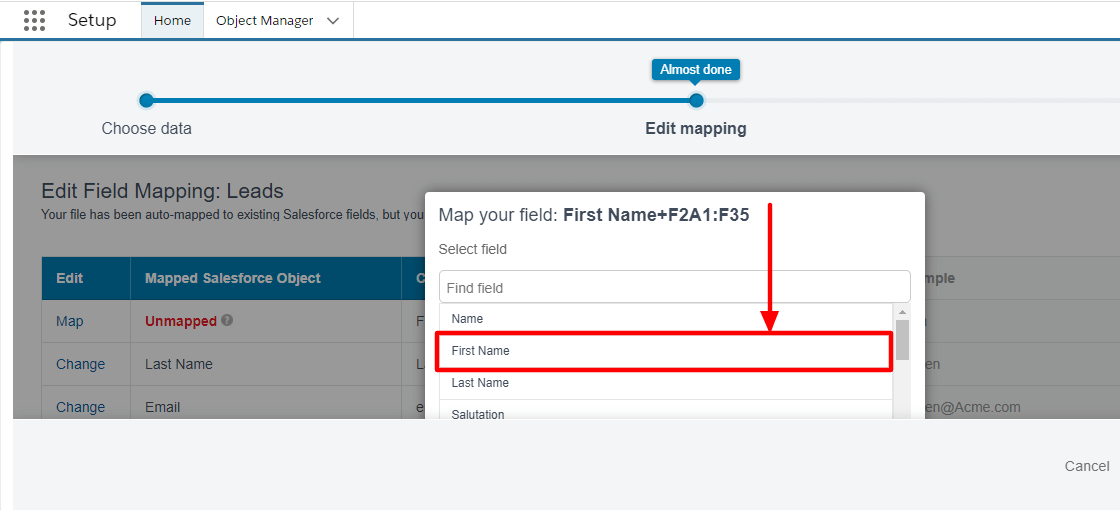
In our example, you’ll need to change the unmapped field by selecting Map and choosing the First Name in the Salesforce standard list fields.
Change your unmapped field.
You can also change the automatic mappings performed by Salesforce by clicking Change under the Edit column beside the field you want to modify.
After reviewing your import information, you can go back to the previous steps to change unmapped data and ensure all the information is correct. Click Start Import.
B. Export Salesforce Data using in-built Data Export
Follow the steps below to export data from Salesforce via the data export service.
Step 1: Navigate to the Data Export option on Salesforce
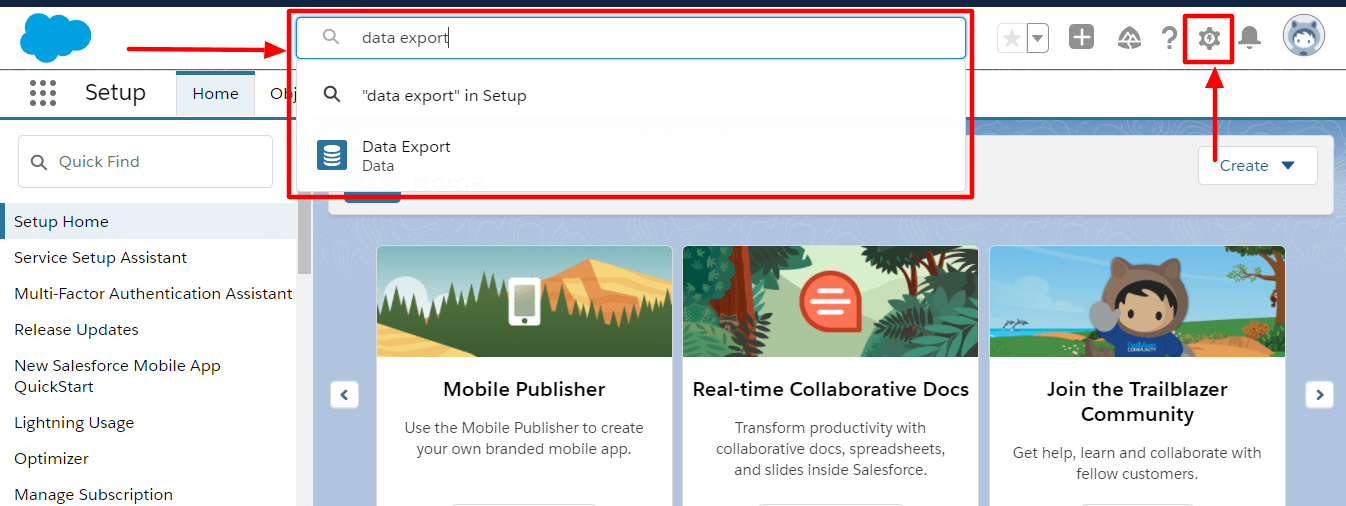
On the Salesforce interface, navigate to Setup and enter Data Export in the search box.
Find Data Export by using the search box.
Choose Export Now, which prepares your data for export immediately, or select Schedule Export, which lets you schedule your file exporting to weekly or monthly intervals.
Step 2: Choose the types of information to export
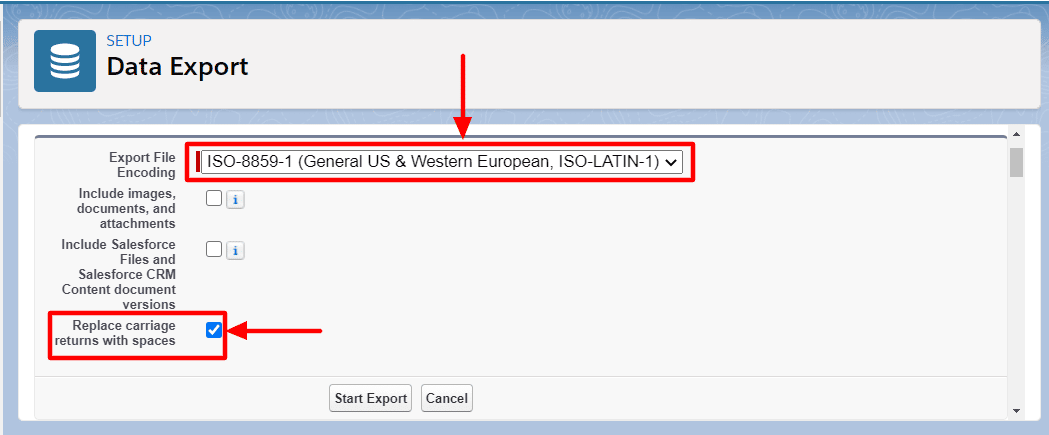
Choose your preferred encoding for your export file.
Click the box beside Replace carriage returns with spaces,so your export files have spaces instead of line breaks or returns. This is useful for importing and for other integrations.
Set up details on the data export setup page.
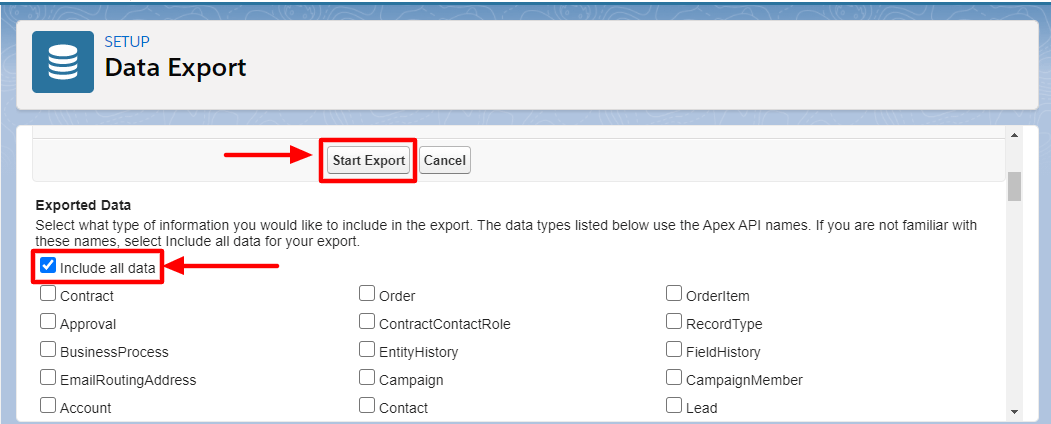
Select the types of info you want to include in your export. If you’re not familiar with Apex API names, choose Include all data and click Start Export.
Select which type of information to include in your export.
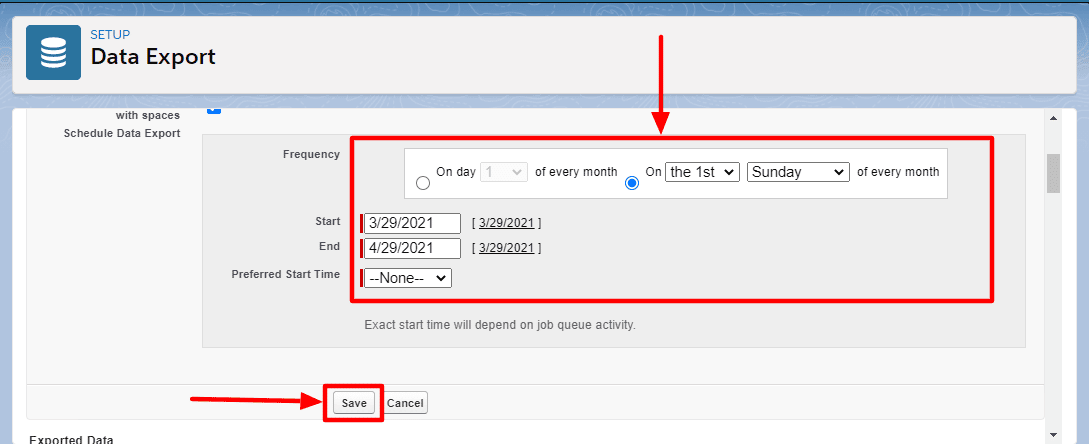
Step 3: Schedule your export
Configure your export schedule by setting the frequency, start and end dates, and the time.
Choose the frequency and preferred start time of your data export.
Click Save when you’re done (or Start Export if you’re not scheduling, but instead exporting your Salesforce files immediately).
You’ll receive an email from Salesforce when your zip archive of CSV files is ready. Large exports are usually broken into multiple files, and you can download the zip files from the link within the email.
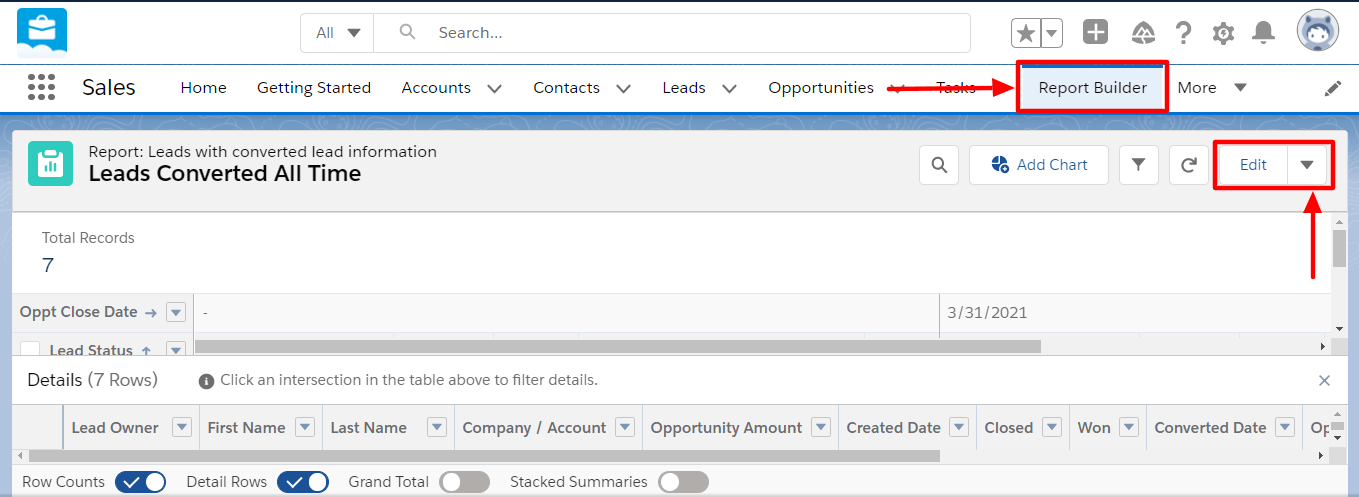
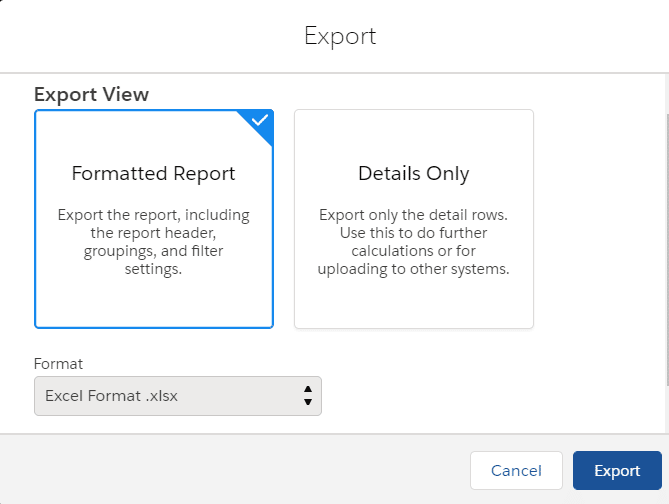
Want to learn how to export leads from Salesforce quickly? Open your report, click the dropdown arrow beside the Edit button, and select Export.
Export leads from Salesforce easily.
Choose your export view, click Export, and you’ll instantly get a downloaded CSV or .xlsx spreadsheet file.
Salesforce presents two export view options.
Pros
The Salesforce data import wizard and export data service are native Salesforce tools. This means you won’t need to install third-party apps for your Salesforce data export and import.
Cons
Both methods are tedious and time-consuming since you’ll need to set up your data import and export manually. What’s more, whenever you want to update the data on your Spreadsheets, you’d have to repeat the import/export process every time.
You might also need to map some of your data if Salesforce fails to do it automatically, which can be cumbersome and labor-intensive.
Your exported files in zip format will only be available for 48 hours upon exporting and will be deleted afterwards.
You can only import up to 60,000 records at a time. Also, all the objects for importing must be supported by the Wizard. The process is not fully automated since you’ll need to set your data importing manually.
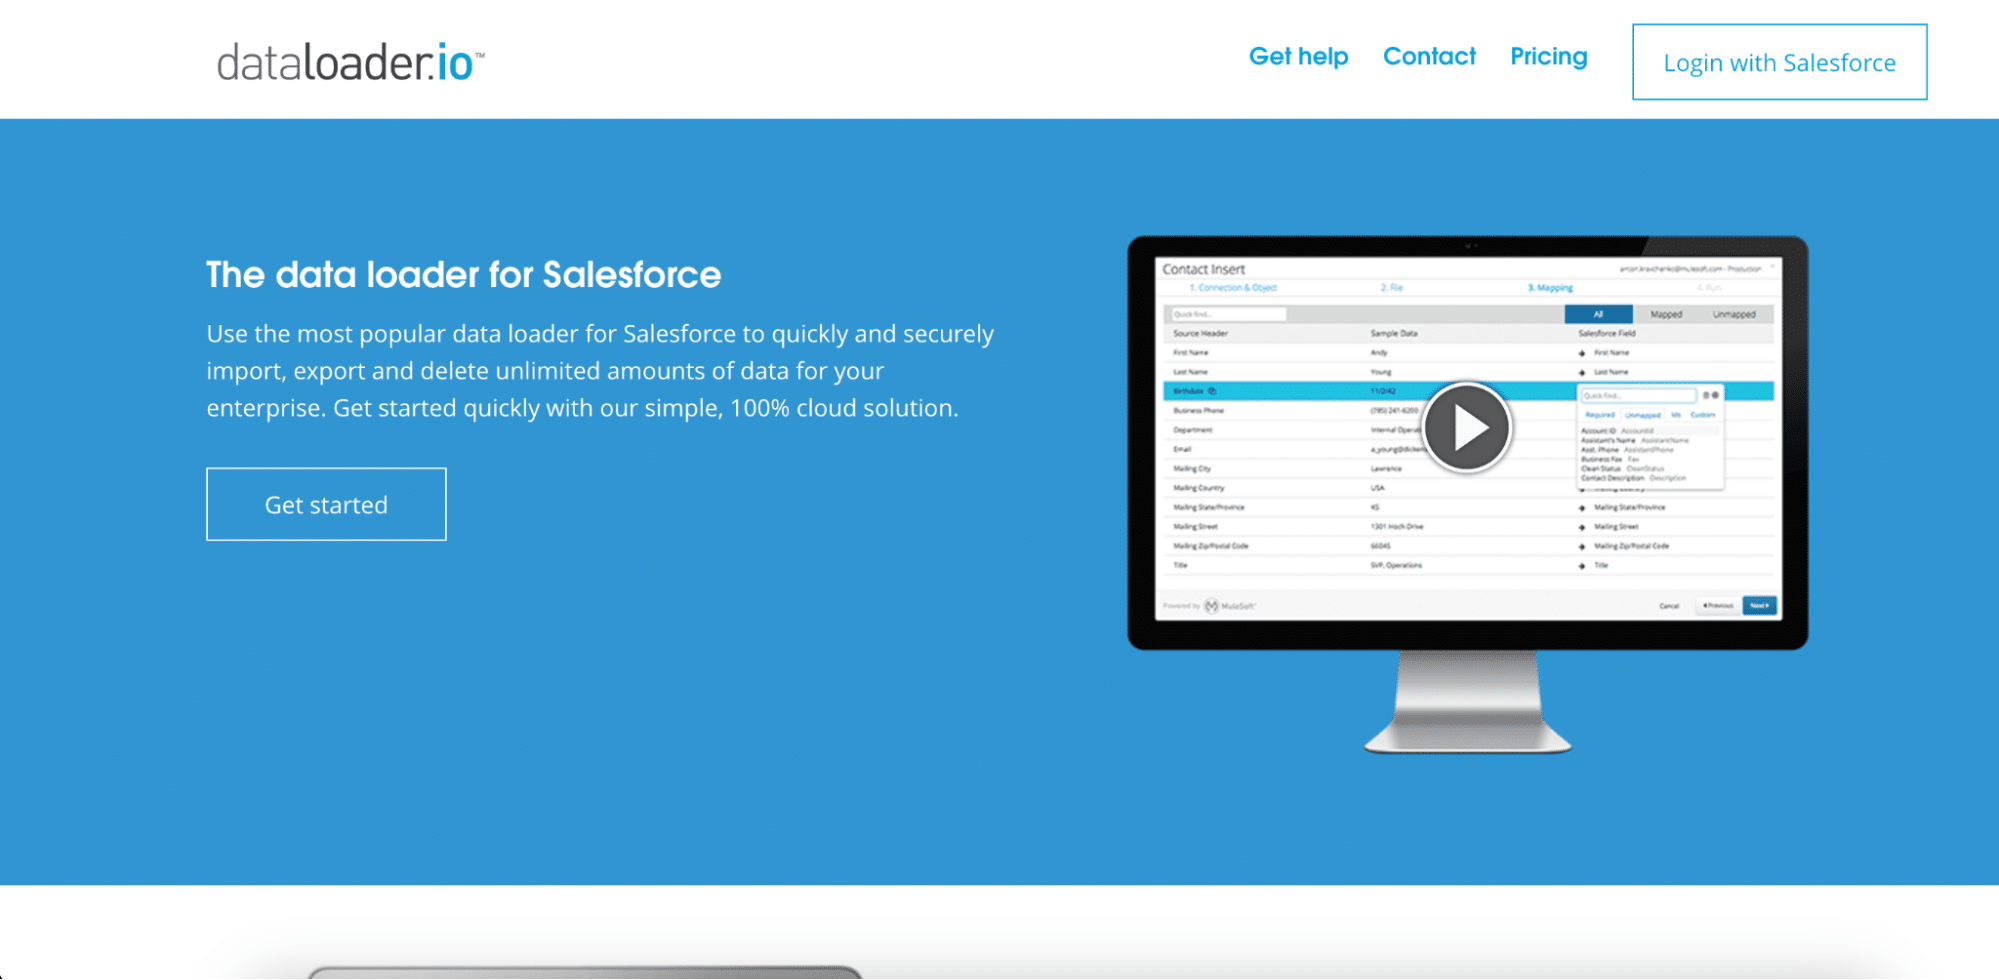
Method 3. Dataloader.io
Dataloader.io is a third-party data loader app for Salesforce that lets you import and export your data in bulk.
It allows you to update, insert, export, import, upsert, and delete your Salesforce records for standard and custom objects with ease.
In our example on importing Salesforce contacts, we’ll use the Upsert operation. That means we’ll create a new record or update an existing one. We’ll also enable email notifications so reports are automatically sent when the import is complete.
We’ll also show how you can schedule daily imports, so your CSV file gets imported to your Salesforce account automatically.
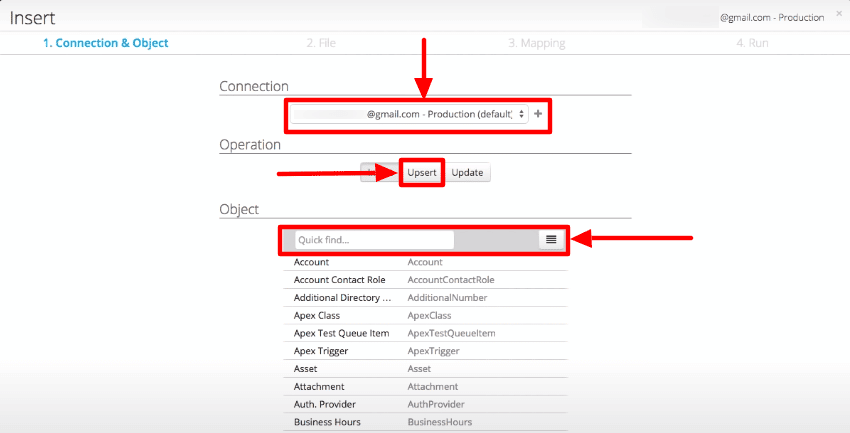
Step 1: Select your Salesforce connection, operation, and object type
After installing and logging into Dataloader.io, select New Task, then Import.
In this example, we’ll use the default connection. Select Upsert, then search for the object type you want to import (in this case, Contacts), and click Next.
Use Dataloader.io to import data in bulk. Image source: dataloader.io.
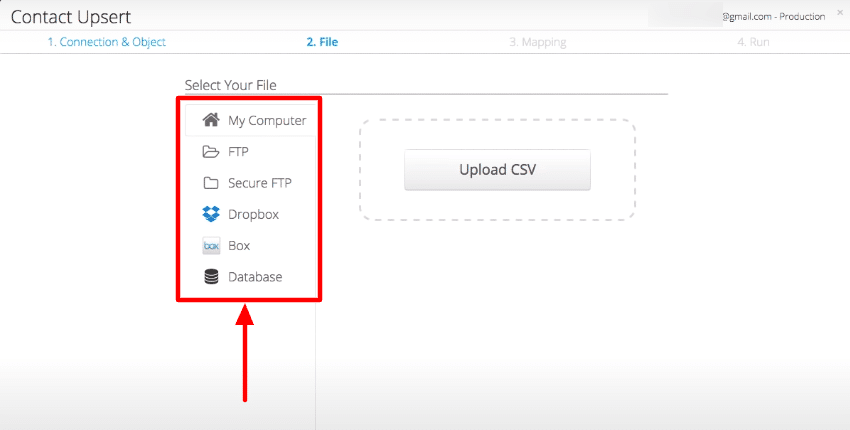
Step 2: Choose a CSV file
Dataloader.io offers direct connectivity to File Transfer Protocol (FTP), Secure FTP, Dropbox, and Box. Select where your CSV file is stored for uploading.
Select your file source. Image source: dataloader.io.
You can also configure a third system, such as Database or another Salesforce instance (the server your Salesforce organization lives on), to upload the CSV file in the same location automatically.
This allows Dataloader.io to automatically import your up-to-date data from their data sources directly into Salesforce.
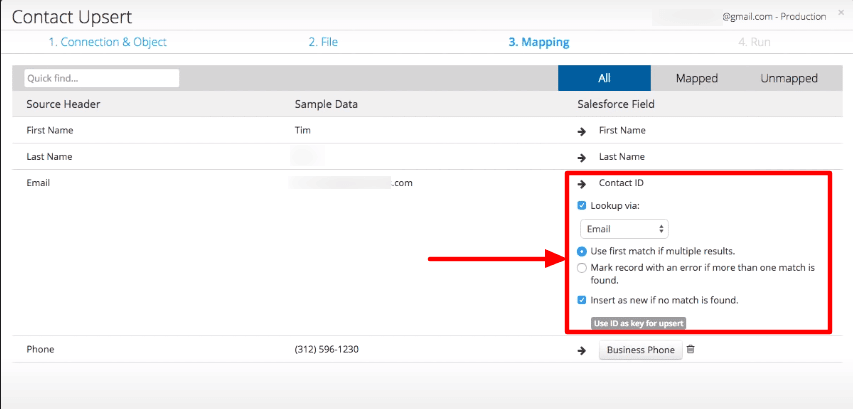
Step 3: Define the mapping
Dataloader.io automatically inputs your data into the matching Salesforce fields: First name, Last name, Email, and Phone.
Modify Email to map to a Contact ID and configure a Lookup via email to set the email address as a unique identifier.
Select the check box on the left side of Insert as new if no match is found and click Next.
Set up your contact ID. Image source: dataloader.io.
Step 4:Schedule importing task
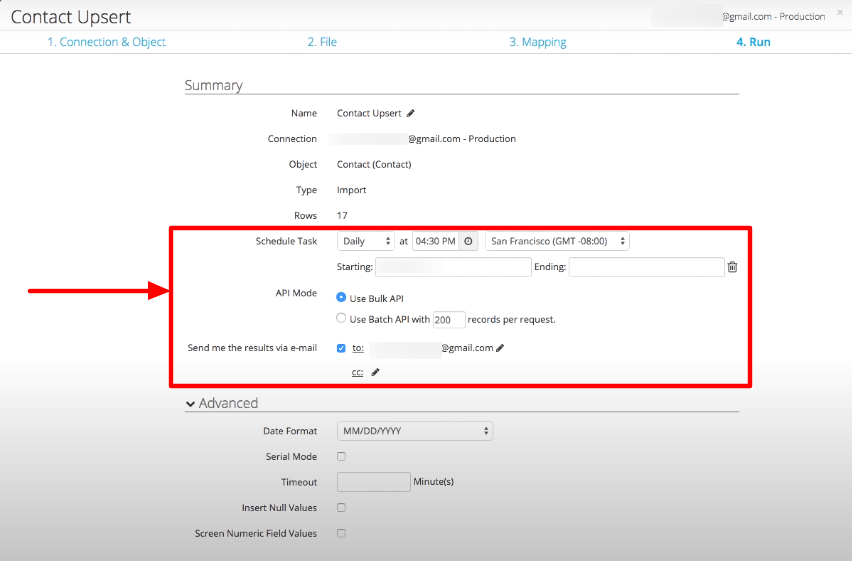
Set a schedule in the Summary page so Dataloader.io automatically performs the import task into Salesforce with your defined mapping configurations daily (or hourly, weekly, monthly).
Schedule your data imports. Image source: dataloader.io.
Select bulk API for faster importing and enable the Send me the results via email option to get automatic email reports every time the task runs. You can also configure the advanced settings based on your preferences.
Click Save and Run once you’re done. Your new records should be uploaded instantly to Salesforce and existing records should be updated.
The general steps to export data from Salesforce using Dataloader.io include creating an export task, selecting your connection and object, building your custom query, then saving and running your task.
The tricky part is the custom query building aspect of the process since you need to understand SOQL well to review and ensure you’re asking your query properly.
The Dataloader.io data exporting feature also lets you use its SOQL Query editor to write your custom queries.
Pros
The app’s interface is easy to navigate and understand.
It automatically translates the query into SOQL as you select your preferred object fields to build your query.
Cons
While Dataloader.io offers essential automation features for exporting and importing, setting these up can still take up your time.
You need to build your query when exporting, which can be complicated and confusing if you don’t know a lot about object fields and types and what they are specifically, including SOQL.
You can access basic Salesforce data importing and exporting features with Dataloader.io’s free version. However, you need the paid plans to get a bigger file size limit and schedule more than one task and email notifications (among others).
Method 4: Manual CSV Export/Import
Salesforce provides built-in CSV functionality for quick data exports and imports, perfect for one-time data transfers or small datasets.
CSV Export Process
Step 1: Navigate to the object or report
Go to any list view in Salesforce (Leads, Accounts, Contacts, Opportunities, etc.) or open a saved report containing the data you want to export.
Step 2: Export the data
For list views, click the gear icon and select “Export”. For reports, click the dropdown arrow next to “Edit” and select “Export”.
Step 3: Choose export format
Select your preferred format (CSV or Excel) and choose whether to export all records or just those currently visible.
CSV Import Process
Step 1: Prepare your CSV file
Ensure your CSV file has column headers that match Salesforce field names. Clean your data by removing duplicates and correcting formatting issues.
Step 2: Use Data Import Wizard
Navigate to Setup > Data Import Wizard and select “Launch Wizard”. Choose your object type and upload your CSV file.
Step 3: Map fields and import
Map your CSV columns to Salesforce fields, review your settings, and start the import process.
Pros
Quick and simple for small datasets
No third-party tools required
Built into Salesforce natively
Works well for one-time data transfers
Cons
Manual process requires repetition for ongoing needs
Limited to 50,000 records per import via Data Import Wizard
No automation or scheduling capabilities
Basic error handling and validation
Method 5: Salesforce API
For developers and organizations with complex integration needs, Salesforce provides comprehensive APIs for programmatic data access.
REST API
The REST API uses standard HTTP methods and supports JSON and XML data formats. It’s ideal for web applications and mobile apps.
Key capabilities:
Create, read, update, and delete records
Execute SOQL queries
Access metadata
Perform bulk operations
Bulk API
The Bulk API is designed for large data sets and long-running operations. It processes data asynchronously in batches.
Key capabilities:
Handle millions of records
Asynchronous processing
CSV and JSON support
Insert, update, upsert, and delete operations
SOAP API
The SOAP API provides programmatic access to Salesforce functionality using standard SOAP protocols.
Key capabilities:
Strongly typed
Extensive metadata support
Transaction control
Client library support
Pros
Maximum flexibility and customization
Can handle very large datasets
Integrates with existing systems
Full programmatic control
Supports real-time and batch processing
Cons
Requires development expertise
Complex setup and maintenance
API limits based on Salesforce edition
Ongoing management and monitoring needed
How to bulk update records in Salesforce?
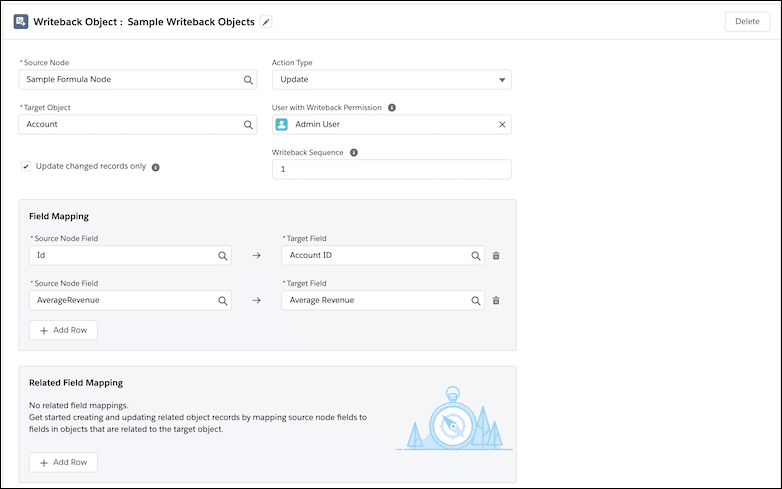
Salesforce offers a Writeback Object node feature to update, create, or upsert your Salesforce org records with transformed data.
Set up your Writeback Object node. Image source: Salesforce.com.
Salesforce lets you create a maximum of five Writeback Object nodes within a Data Processing Engine definition. This allows you to write back your transformed data to custom or standard objects, updating them in bulk. There are a few tools out there that can help with writing back to Salesforce, however, Coefficient takes the cake with its writeback feature for Salesforce.
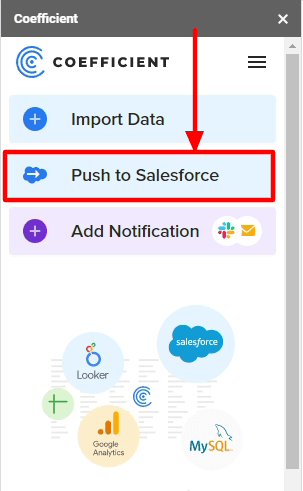
Update your Salesforce data in bulk through Google Sheets using Coefficient.
Open your Spreadsheet file, and from the Coefficient window, select Push to Salesforce, select your preferred action, and you can update bulk Salesforce from Google Sheets quickly and easily.
This is a huge time- and energy-saver since it only takes a few clicks (and seconds) to do bulk Salesforce record updating.
Conclusion
We hope you feel enabled to choose the best-suited Salesforce export and import option to leverage the right tools for your organization that automate and streamline data handling, sharing, and analysis.
The more efficiently you can move and sync your data, the better its quality. This can help revolutionize your company’s Salesforce adoption, boosting your ability to generate accurate dashboards and reports.
Ultimately, seamless Salesforce data importing and exporting amplifies your data flow, allowing you to derive insights effectively and efficiently.
The pursuit of revenue growth is more relentless than ever.
Leading this charge is Revenue Operations (RevOps), which unites sales, marketing, and customer success to maximize revenue across the entire customer journey.
At the heart of it is Salesforce, a leading CRM solution trusted by businesses worldwide.
But Salesforce is not just a standalone tool; it’s a robust ecosystem. It becomes more potent when integrated into other cutting-edge apps, APIs, and services. In fact, recent studies show CRM integrations can boost revenue up to 20%.
In this comprehensive guide, you will discover the top Salesforce integrations that revenue teams can leverage in 2024 and beyond.
Let’s get started!
What is Salesforce?
Salesforce is a dynamic cloud-based Customer Relationship Management (CRM) platform. It’s not just a software solution. As a business, Salesforce becomes a strategic partner that empowers you to build and nurture customer relationships, drive sales, and grow revenue.
Salesforce’s strength is not only about its features. The real thing is its ability to integrate with a vast ecosystem of third-party applications and services.
These integrations extend Salesforce’s functionality, making it a central hub for all customer-related activities.
Benefits of Using Top Salesforce Integrations
In RevOps, staying ahead of the competition needs a vision and the ability to execute strategies efficiently.
Salesforce integrations are the backbone of this execution. You can add these APIs and third-party apps independently or by integrations of unified platforms like Zapier.
This eventually leads to offering many benefits that can make a significant impact on your organization’s revenue growth, such as:
1. Streamlined Workflows and Processes
It’s easier to streamline workflows and automate long and repetitive tasks. Integrations also help to reduce manual errors in storing customer data and allow teams to focus on high-value activities.
And a 92% reduction in error, allowing teams to do more in less time with data integration and sales processes.
2. Enhanced Data and Insights
You can get information from several sources through app integration in the Salesforce CRM, creating a clear view of your customers and prospects.
This enriched data provides RevOps teams with invaluable insights to make informed decisions.
Also, data-driven businesses see a 19% increase in lead conversion rates after using advanced analytics, which results from consistently qualified new leads!
3. Expanded Functionality
Integration tools expand the functionality of your CRM.
You get to add features for inbound and outbound marketing automation, e-signatures, and external systems for analytics. These are not native to Salesforce but are much needed for your business.
Statistics from MarketSplash show that 67% of companies invest in CRM software and integration solutions to improve sales and marketing efforts. With more functionalities, they increase their revenue by an average of 41%.
4. Easy Scalability
As your business grows, Salesforce platform integrations make it easier to scale your operations with their constant updates and features, too. You can add new tools and functionalities without overhauling your CRM setup.
In a nutshell, competitive edge matters. This means leveraging integrations for your Salesforce account is not only helpful — it’s crucial for revenue growth.
So let’s find out the top 10 types of integrations offered on the Salesforce Appexchange.
Pardot bridges the gap between marketing and sales. It enables marketing teams to capture, nurture, and qualify leads. Real-time lead scoring and behavior tracking will ensure your sales teams get quality leads and high conversion rates.
Key Features:
Lead Scoring: Rank leads based on their engagement and behavior, ensuring sales teams focus on the most promising prospects.
Drip Campaigns: Automate personalized email marketing campaigns. Nurture leads throughout the sales funnel.
Analytics and Reporting: Gain insights into campaign performance and ROI. There is more room for data-driven marketing strategies.
Recent Updates:
Pardot now offers improved AI-driven analytics. This enables more accurate lead scoring and personalized content recommendations.
Pricing:
Pricing varies based on the number of users and features required. It starts at $1,250 per month.
Bonus Tip:
Use dynamic content in Pardot. It will deliver personalized messages to leads, increasing engagement and conversion rates.
Coefficient is a game-changing, free Google Sheets and Excel add-on designed to make it easier for RevOps to collect and analyze the data they need to drive revenue. It seamlessly connects Salesforce data to their spreadsheets, where it can be combined with other data for more complete analysis.
Coefficient is designed to make reporting and analysis easier, offering free dashboard templates alongside robust spreadsheet automation and collaboration features.
Key Features:
Real-time Data Sync: Ensure your Salesforce data in Google Sheets is always up-to-date.
Automated Alerts: Configure alerts for data modifications and when thresholds are crossed. Route these notifications to Gmail or Slack as needed.
Data Writebacks: Change data in Google Sheets and write it back to Salesforce automatically.
Recent Updates:
Prefer Microsoft Excel over Google Sheets? The Coefficient has you covered!
Coefficient’s monthly pricing starts at $49 per user, with a free trial available.
Bonus Tip:
Leverage Coefficient’s data writeback feature to quickly update Salesforce records directly from Google Sheets. It saves time and reduces data entry errors.
DocuSign integration simplifies contract workflows. You can send, track, and sign contracts directly within Salesforce. This eliminates the need for paper-based processes. It also accelerates deal closures and enhances the customer experience.
Key Features:
Electronic Signature: Speed up deal closures by collecting legally binding e-signatures.
Agreement Templates: Create reusable templates for standard contracts. Save time and ensure consistency.
WorkflowAutomation: Automate contract approval processes and notifications.
Recent Updates:
DocuSign’s recent updates include improved mobile capabilities for signing contracts on the go and more compliance features.
Pricing:
Pricing varies based on the number of envelopes (documents) sent monthly, with plans starting at $10.
Bonus Tip:
Use DocuSign’s integration with Salesforce CPQ (Configure, Price, Quote). It streamlines the generation of sales quotes and contract management, too!
Gong records and analyzes sales calls, providing valuable insights. It helps RevOps teams understand what’s working in their sales and what needs improvement. This integration enhances sales coaching, leading to better outcomes.
Key Features:
Call Recording: Record sales calls and meetings for review and analysis.
Conversation Analytics: Gain insights into sales call effectiveness. Find areas for improvement.
Sales Coaching: Use AI-driven insights to coach sales reps and improve their performance.
Recent Updates:
Gong’s latest updates include enhanced transcription accuracy and integration with video conferencing platforms. Also, a more friendly user interface is needed.
Pricing:
Pricing is available upon request.
Bonus Tip:
Use Gong’s AI-driven insights to identify successful sales call patterns. Coach your sales team accordingly, leading to improved conversion rates.
Outreach is a powerful sales engagement platform. It allows scale automation of outreach sequences, email tracking, and personalized communication. It empowers your sales team to engage with prospects more effectively.
Key Features:
Sequencing and Automation: Create automated email and call sequences to engage prospects at the right time.
Email Tracking: Track email engagement and receive alerts when prospects open or click on emails.
Personalization: Customize outreach efforts to resonate with individual prospects.
Recent Updates:
Outreach continuously updates the platform to enhance user experience and add new features. There are too many to track!
Pricing:
Pricing varies based on the number of users and features required, with plans typically starting at $100 per user per month.
Bonus Tip:
Salesforce users can leverage the power of sequences to automate follow-ups and nurture leads. It increases your chances of conversion.
ZoomInfo is an integration that enriches contact and company profiles in Salesforce with up-to-date data. This integration ensures your database is always accurate. It also helps you target suitable leads and make data-driven decisions.
Key Features:
Contact and Company Data Enrichment: Update and complete contact and company records.
Real-time Data Sync: Keep your Salesforce database current with the latest information.
Targeted Lead Generation: Identify and target ideal prospects with precision.
Recent Updates:
ZoomInfo has expanded its database coverage. Now, it provides access to an even more comprehensive range of contacts and companies.
Pricing:
Pricing varies based on the number of users and data credits required.
Bonus Tip:
Use data enrichment to maintain a highly accurate database. This allows your sales and marketing teams to target suitable leads at the correct times.
Tableau brings real-time analytics and reporting capabilities to Salesforce. You can create interactive dashboards and reports in other systems and integrate them into your Salesforce account.
It will enable your RevOps team to visualize data and gain actionable insights.
Key Features:
Data Visualization: Transform complex data into visual insights that are easy to understand.
Real-time Analytics: Access up-to-the-minute data for timely decision-making.
Customizable Dashboards: Build customized dashboards tailored to your specific KPIs.
Flexible Data Transfer: Spreadsheet lovers can export Tableau to Excel with Coefficient for more streamlined analytics and reporting.
Recent Updates:
Tableau regularly releases updates to enhance its data visualization capabilities and performance.
Pricing:
Tableau offers a variety of pricing options, including individual and enterprise plans.
Bonus Tip:
Create interactive dashboards that provide a holistic view of your RevOps performance. It will lead to quick and data-driven decision-making.
Slack is the most popular and seamless connector of the Salesforce user interface for team communication and collaboration.
It connects your sales, marketing, and support teams. This allows them to share real-time information, updates, and insights.
Key Features:
Real-time Messaging: Enable instant communication and updates within Salesforce records.
Channel Integration: Connect Salesforce data to specific Slack channels for focused collaboration.
Notifications: Receive important Salesforce updates within Slack.
Recent Updates:
Slack is improving its integration capabilities to provide a more smooth collaboration experience.
Pricing:
Slack offers various pricing tiers, including a free plan with limited features.
Bonus Tip:
Leverage different slack channels and connecting workspaces to other organizations. It will help develop shared environments with outside groups, clients, or teams.
Conga Composer simplifies document generation from Salesforce data. It automates the creation of contracts, proposals, and other documents. This reduces manual work and ensures accuracy.
Key Features:
Template Creation: Design templates for various document types, ensuring brand consistency.
Dynamic Document Generation: Populate documents with Salesforce data.
WorkflowAutomation: Create document generation workflows to streamline business processes.
Recent Updates:
Now offers improved template management and advanced document automation features.
Pricing:
Pricing varies based on the number of users and features required, with plans typically starting at $15 per user per month.
Bonus Tip:
Use Conga to create personalized proposals and contracts. Make sure they reflect the specific needs and preferences of your prospects. This increases the likelihood of closing deals.
Zuora is crucial for businesses with subscription-based models. It manages recurring customer subscriptions and automates billing, invoicing, and revenue recognition processes within Salesforce.
Key Features:
Subscription Billing: Automate subscription billing and invoicing processes.
Revenue Recognition: Ensure compliance with revenue recognition standards.
Subscription Metrics: Gain insights into subscription performance and growth.
Recent Updates:
Zuora has enhanced its platform to meet evolving subscription management needs.
Pricing:
Pricing varies based on the number of subscriptions and features required.
Bonus Tip:
Use Zuora’s subscription metrics to analyze customer behavior and identify opportunities. This can assist in upselling or cross-selling add-on services.
Level-Up Salesforce with These Integrations
These top Salesforce integrations represent a goldmine of potential for RevOps teams in 2023. They will help your organization streamline operations, gather valuable insights, expand functionality, and scale quickly.
Ready to Revolutionize Your Salesforce Data Analysis?
Managing large volumes of data in Salesforce can be challenging. Data loaders for Salesforce simplify this process, improving efficiency and data accuracy. Here’s a look at the top Salesforce data loaders for 2024.
Feature Comparison Table of Top Data Loaders for Salesforce
Feature
Coefficient
Salesforce Data Import Wizard
Dataloader.io
XL-Connector
Salesforce Google Data Connector
Row Limits / Export Limits
Unlimited
50,000 records
100,000 records (Free), Unlimited (Paid)
Unlimited
2,000 rows
Data Sources
50+
Salesforce
Salesforce
Salesforce
Salesforce
Builder License Cost
$49/user/month
Free
$99/month
$20/user/month
Free
Viewer License Cost
Free
N/A
N/A
N/A
Free
AI Functionality
Yes
No
No
No
No
Refresh frequency
Real-time
Manual
Scheduled
Manual
Real-time
Alerts
Yes
No
No
No
No
Security
SOC 2 Type II
Salesforce native
SOC 2 Type II
Salesforce native
Google & Salesforce native
1. Coefficient: The Ultimate Salesforce Data Loader
Coefficient stands out as a powerful data loader for Salesforce, offering seamless integration with Google Sheets and Excel. Its real-time data syncing and advanced automation features make it an indispensable tool for Salesforce users looking to improve their data management processes.
Highlights of Coefficient
Real-time Salesforce data sync with spreadsheets
AI-powered data cleaning and transformation
Advanced automation for report distribution and alerts
Pros
Intuitive Interface: Coefficient’s user-friendly design makes it accessible for both technical and non-technical users.
Powerful Automation: Set up automatic data refreshes and alerts to keep your team informed and data up-to-date.
Seamless Integration: Works flawlessly with Google Sheets and Excel, enhancing your existing workflow.
Cons
Learning Curve: While user-friendly, mastering all features may take some time for new users.
Pricing: Premium features may be costly for smaller organizations.
Pricing
As of April 2024, Coefficient offers a free plan with limited features. Paid plans start at $29/month for individuals and $49/user/month for teams. Enterprise pricing is available upon request.
What do users say about Coefficient?
Positive review: “Coefficient has transformed our Salesforce reporting. The real-time sync and automation features have saved us countless hours.” – John D., Sales Manager (Source: G2)
Critical review: “Great tool, but the learning curve can be steep for some of the more advanced features.” – Sarah L., Marketing Director (Source: Google Workspace)
Support
Coefficient offers comprehensive support including documentation, video tutorials, email support, and priority support for enterprise customers.
2. Salesforce Data Import Wizard: Native Salesforce Solution
The Salesforce Data Import Wizard is a built-in tool that allows users to import data directly into Salesforce. It’s an excellent option for those looking for a native solution without additional costs.
Highlights of Salesforce Data Import Wizard
Native Salesforce tool
User-friendly interface for basic data imports
Pros
Cost-Effective: Included with Salesforce licenses at no additional cost.
Ease of Use: Designed specifically for Salesforce, making it intuitive for users familiar with the platform.
Cons
Limited Functionality: Lacks advanced features like automation and real-time syncing.
Data Volume Restrictions: May not be suitable for large-scale data imports.
Pricing
Free with Salesforce licenses as of April 2024.
What do users say about Salesforce Data Import Wizard?
Critical review: “Works well for basic needs, but lacks advanced features for complex data management.” – Lisa T., CRM Specialist (Source: G2)
Support
Support is provided through Salesforce’s standard channels, including documentation and community forums.
3. Dataloader.io: Popular Cloud-Based Salesforce Data Loader
Dataloader.io is a widely-used cloud-based data loader for Salesforce, known for its user-friendly interface and robust features.
Highlights of Dataloader.io
Cloud-based solution
Support for large data volumes
Pros
User-Friendly: Intuitive interface makes it easy for non-technical users to manage data.
Flexibility: Supports various data operations including insert, update, upsert, and delete.
Cons
Limited Free Version: The free version has restrictions on data volume and frequency of use.
Dependence on Internet: Being cloud-based, it requires a stable internet connection.
Pricing
As of April 2024, Dataloader.io offers a free plan with limited features. Paid plans start at $99/month for additional features and higher data limits.
What do users say about Dataloader.io?
Positive review: “Dataloader.io has simplified our data management process. It’s reliable and easy to use.” – Alex K., Sales Ops Manager (Source: AppExchange)
Critical review: “While it’s great for most tasks, we sometimes hit limits with very large datasets.” – Chris M., IT Director (Source: G2)
Support
Dataloader.io provides email support, documentation, and a knowledge base for users.
4. XL-Connector: Excel-Centric Salesforce Data Management
XL-Connector is an Excel-based solution for managing Salesforce data, offering a familiar interface for users comfortable with spreadsheets.
Highlights of XL-Connector
Deep Excel integration
Supports complex Excel formulas and functions
Pros
Excel Familiarity: Leverage existing Excel skills for Salesforce data management.
Offline Capability: Work on data offline and sync when connected.
Cons
Limited to Excel: Not suitable for organizations using other spreadsheet tools.
Learning Curve: May require time to master advanced features.
Pricing
As of April 2024, XL-Connector offers a 14-day free trial. Paid plans start at $20/month per user.
What do users say about XL-Connector?
Positive review: “XL-Connector has streamlined our Salesforce data management. It’s a game-changer for Excel users.” – Emma S., Business Analyst (Source: AppExchange)
Critical review: “Great for Excel users, but we found it limiting when collaborating with team members who prefer other tools.” – David R., Sales Manager (Source: G2)
Support
XL-Connector provides email support, documentation, and video tutorials.
5. Salesforce Google Data Connector: Native Google Sheets Integration
The Salesforce Google Data Connector provides a native integration between Salesforce and Google Sheets, allowing for seamless data transfer between the two platforms.
Highlights of Salesforce Google Data Connector
Native integration with Google Sheets
Real-time data sync capabilities
Pros
Google Workspace Integration: Ideal for organizations heavily invested in Google’s ecosystem.
Real-Time Updates: Changes in Salesforce reflect immediately in connected Google Sheets.
Cons
Limited Customization: Fewer options for data transformation compared to some third-party tools.
Google Sheets Dependency: Not suitable for organizations primarily using Excel or other spreadsheet tools.
No Support: Support was sunset for this data loader in Fall of 2024.
Pricing
Free with Salesforce and Google Workspace licenses as of April 2024.
What do users say about Salesforce Google Data Connector?
Positive review: “The direct integration between Salesforce and Google Sheets has greatly improved our reporting workflow.” – Rachel K., Operations Manager (Source: G2)
Critical review: “While it’s great for basic needs, we found it lacking some advanced features for complex data management.” – Tom L., IT Specialist (Source: Salesforce Trailblazer Community)
Support
Sunset in fall of 2024.
Making the Right Data Loader Choice
Selecting the right data loader for Salesforce can significantly impact your data management efficiency and accuracy. While native solutions like the Salesforce Data Import Wizard and Google Data Connector offer basic functionality, third-party tools like Coefficient provide advanced features such as real-time syncing, automation, and AI-powered data cleaning.
Consider your specific needs, budget, and existing tech stack when making your decision. For organizations looking for a comprehensive solution that works with both Google Sheets and Excel, offers powerful automation, and provides real-time data syncing, Coefficient stands out as a top choice.
Ready to improve your Salesforce data management? Get started with Coefficient today and experience the difference in your data workflows.
The Salesforce Data Import Wizard is the best free option for basic data loading needs. However, for more advanced features without cost, Coefficient offers a free plan that includes real-time syncing and basic automation capabilities.
How do I use Data Loader in Salesforce?
To use the native Salesforce Data Loader:
Download and install the Data Loader from Salesforce.
Log in to your Salesforce account through the Data Loader.
Choose your operation (insert, update, upsert, delete, or export).
Select your data file and map the fields.
Run the operation and review the results.
For a more user-friendly experience with advanced features, consider using Coefficient, which offers an intuitive interface and real-time syncing capabilities.
Is dataloader.io owned by Salesforce?
No, dataloader.io is not owned by Salesforce. It’s a third-party tool created by MuleSoft, which is now a part of Salesforce. However, for a fully integrated solution, Coefficient offers seamless Salesforce data management with additional features like AI-powered insights and advanced automation.
What’s the difference between dataloader.io and Salesforce Data Loader?
Dataloader.io is a cloud-based tool offering a user-friendly interface and support for large data volumes. Salesforce Data Loader is a native desktop application with basic import/export capabilities. For a solution that combines the best of both worlds – cloud-based convenience and powerful features – consider using Coefficient for your Salesforce data management needs.