Salesforce allows for a wide variety of customization, enabling the CRM to fit your precise business needs.
But Salesforce’s standard features are already designed to fit many sales use cases right out of the box. One such feature is Forecast Categories.
Read on for a complete guide to Salesforce Forecast Categories and Collaborative Forecasts, along with how they can help your sales org.
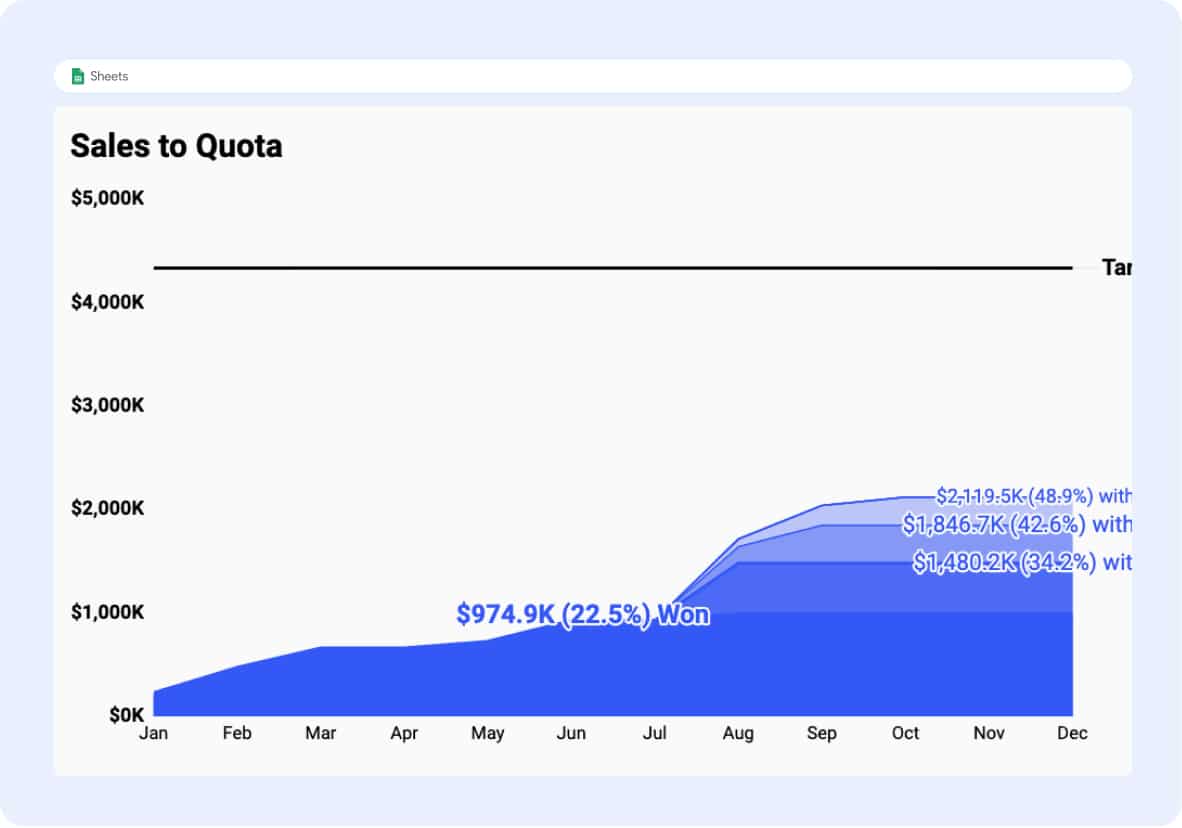
Need to visualize Salesforce opportunities and how you’re forecasting now? Grab this free Salesforce report template and connect Salesforce to Google Sheets to power it with your live data in just a few clicks.
What is the Salesforce Forecast Category?
The Salesforce Forecast Category allows sales teams to rank the likelihood of an Opportunity reaching the Closed Won stage.
The Forecast Category helps sales teams understand where an Opportunity is in the sales process. This allows sales teams to compare opportunities and decide which opps deserve the most attention.
The Forecast Category in Salesforce doesn’t provide extensive customization. But it’s designed to work within sales frameworks that many teams already employ.
What Can a Forecast Category Tell You?
An opportunity with a Forecast Category can tell you:
- If an opportunity is stagnant
- How an opportunity ranks compared to other opps
- How a Sales Rep is performing in a given quarter
- What amount of attention an opportunity should get
- The amount of revenue in lower forecast categories
- How the sales pipeline is looking at the end of the month
The Forecast Category can enhance your analytics and your understanding of your sales pipeline.
How Forecast Categories Work in Salesforce
The Forecast Category helps classify opportunities in Salesforce. When a Stage (API Name: StageName) is created, the Forecast Category is a required field. The options for Forecast Category are:
- Omitted
- Pipeline
- Best Case
- Commit
- Closed
Although Salesforce has out-of-the-box options, these can be adjusted. The options can be viewed by navigating to Fields & Relationships on the Opportunity object and selecting Stage as the field.
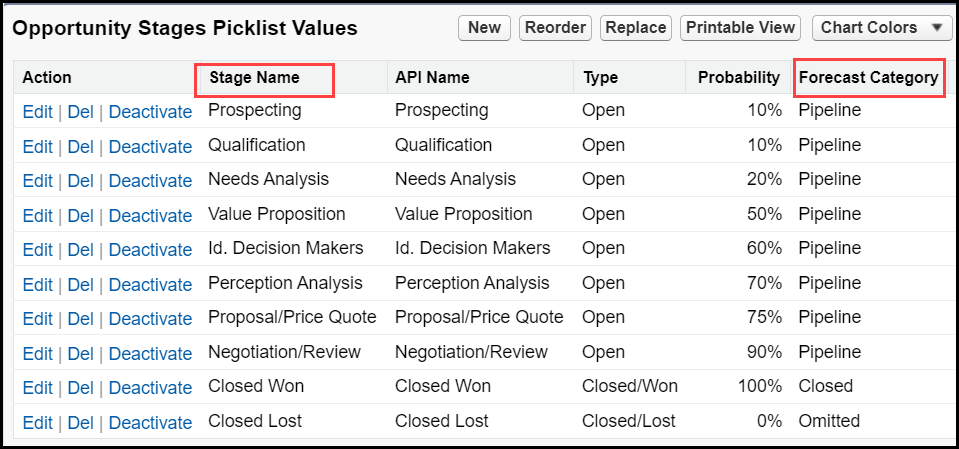
As you create your own sales process, you can choose the stages (custom or standard) you want in each Forecast Category.
How to Adjust a Forecast Category on an Opportunity Stage
To adjust a Forecast Category on an Opportunity stage:
- Navigate to the Setup menu > Object Manager > Opportunity Object and select Fields & Relationships. Search for “Stage”.
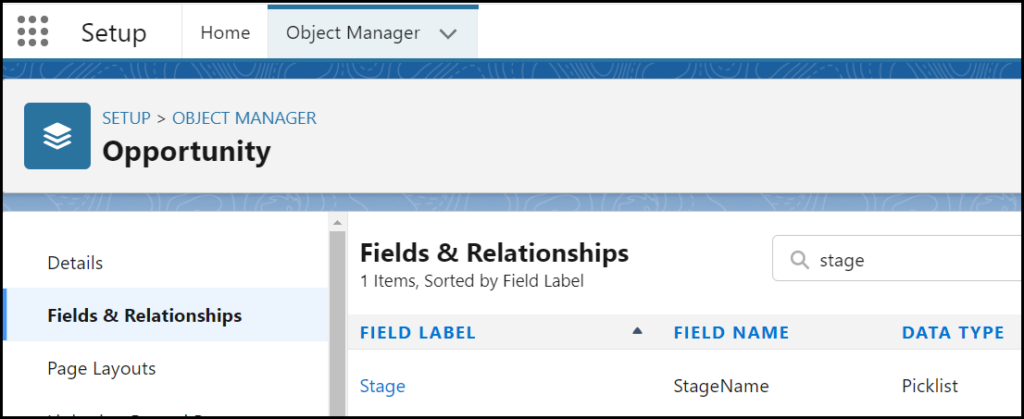
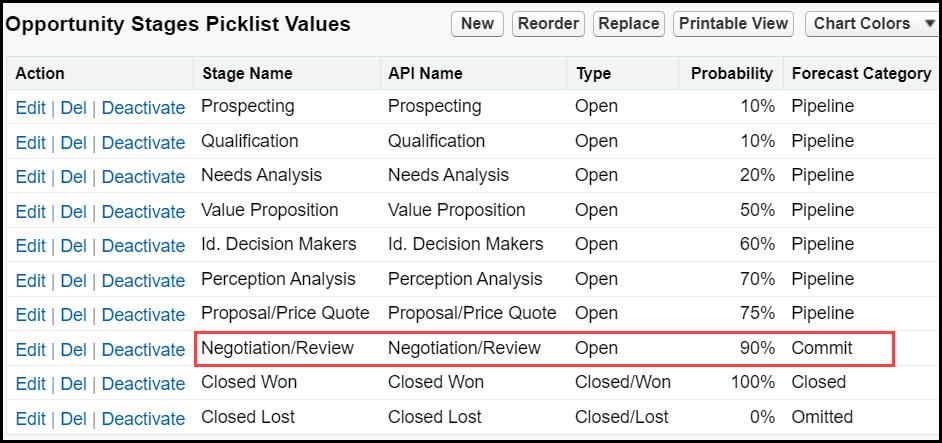
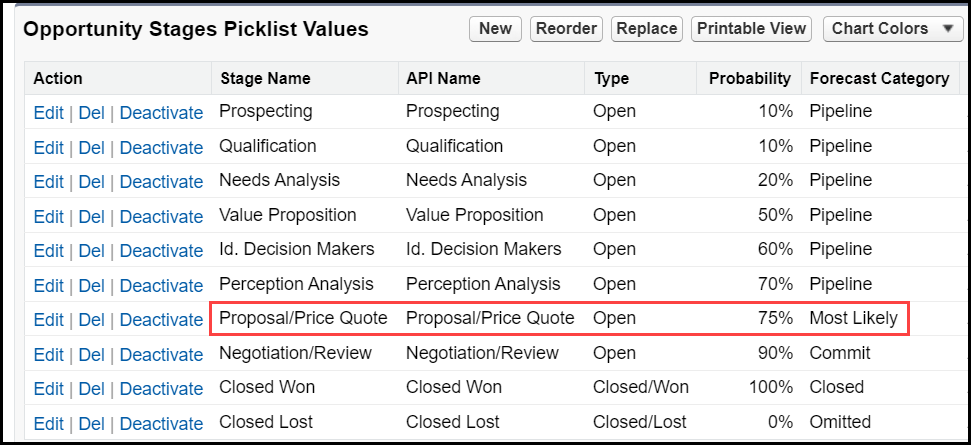
- Once you select Stage, scroll down until you reach Opportunity Stages Picklist Values.
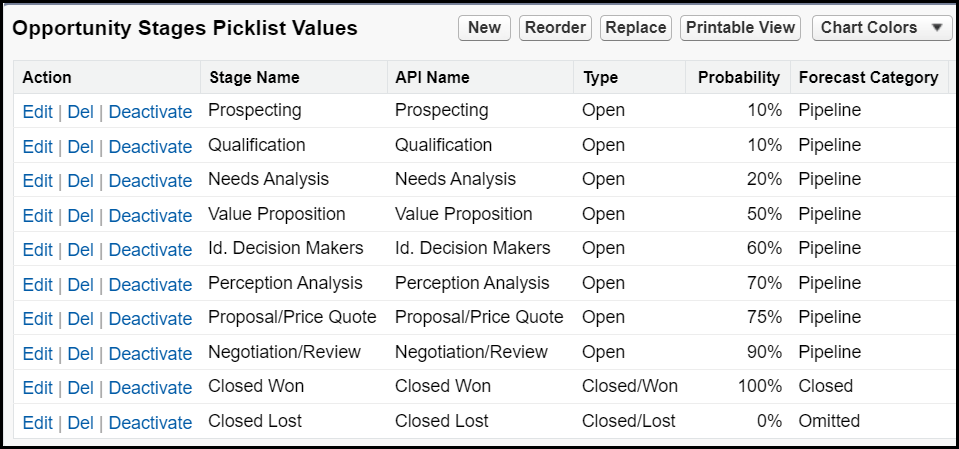
- Let’s say you want to change the Negotiation/Review stage from Pipeline to Commit. Select Edit beside Negotiation/Review, then select the dropdown beside Forecast Category and choose Commit.
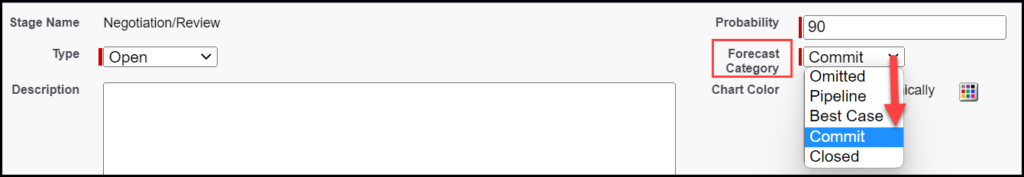
- Hit Save at the bottom, and your result will appear on the table in the picklist values section.
It’s easy to make standard changes to the Stage field and how those fields are bucketed in the Forecast Category.
But what about the Collaborative Forecast feature in Salesforce — how does that function work?
What is a Collaborative Forecast In Salesforce?
The Collaborative Forecast feature allows for more visibility and granularity in the categorization of opportunities. This feature must be enabled/disabled in a separate part of the Setup menu.
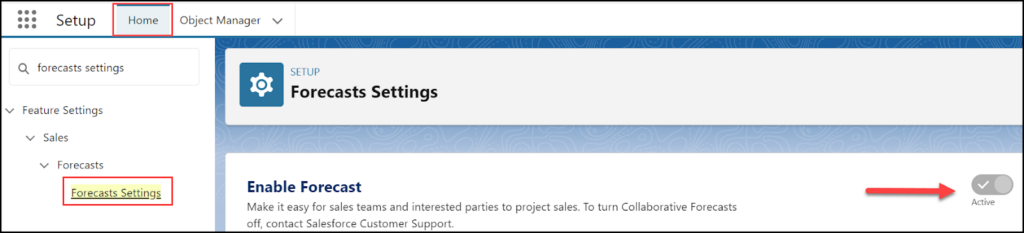
If Collaborative Forecasts are enabled, navigate to the Setup Home tab and search for Forecast Settings.
You’ll see a toggle for Enable Forecast. Turning on this feature enables other functionality within Salesforce.
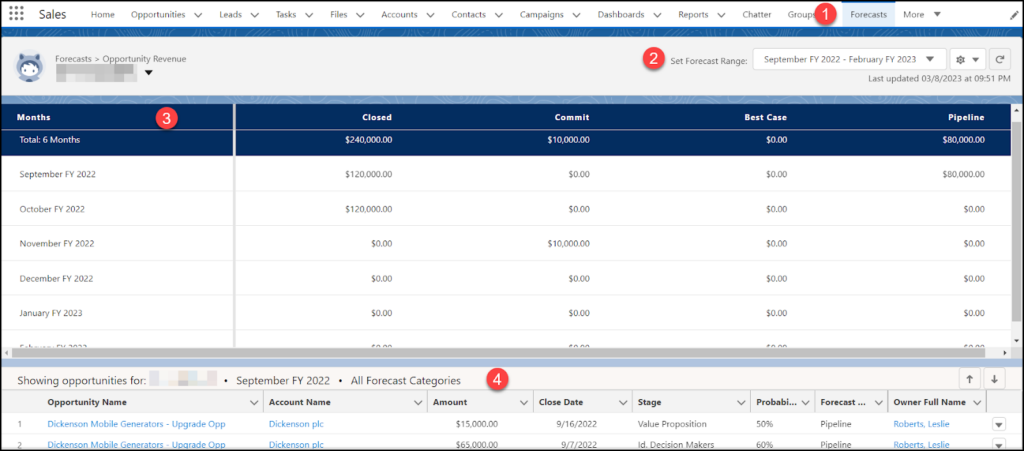
Now you can see the Forecasts tab and the associated data, all without having to go to the report builder and creating it from scratch. Once Collaborative Forecasts have been enabled, you can:
- Add the Forecasts tab to your Navigation bar
- Set the Forecast Range to your specific Month and Fiscal Year
- Click the cells to expose more information regarding those values
The Forecast Category field is also turned on in Opportunity Fields & Relationships.
Now let’s add a value to the Forecast Category — specifically, the Most Likely category.

Stop exporting data manually. Sync data from your business systems into Google Sheets or Excel with Coefficient and set it on a refresh schedule.
Get Started
How to Add Value to Forecasts
Salesforce recently came out with a new category for Collaborative Forecasts called “Most Likely”.
However, this option is not automatically included in your Salesforce org. You must add it manually. To add Most Likely to the Forecast Category, do the following:
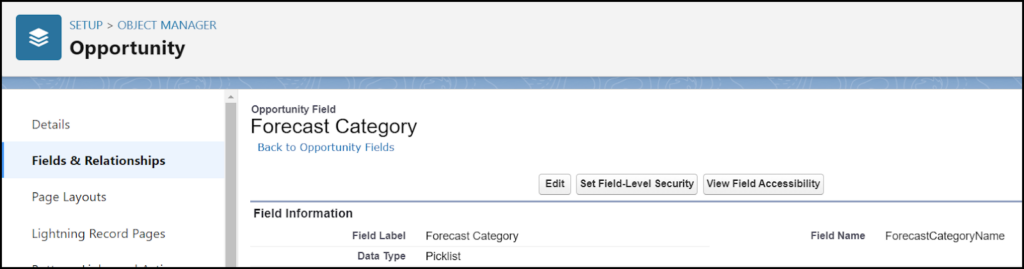
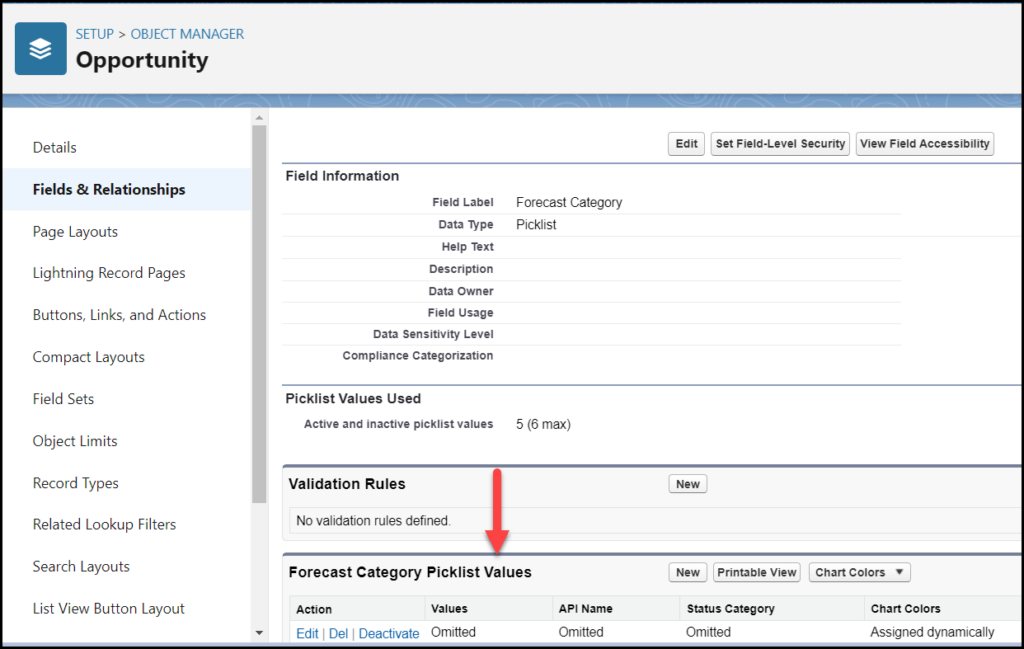
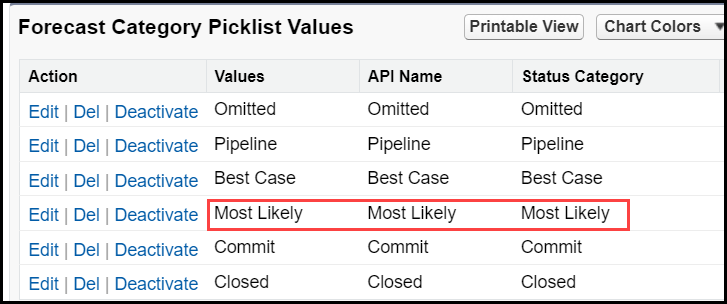
- Navigate to Setup > Object Manager > Opportunity > Fields & Relationships and select Forecast Category. Once inside of the field, scroll down to Forecast Category Picklist Values.
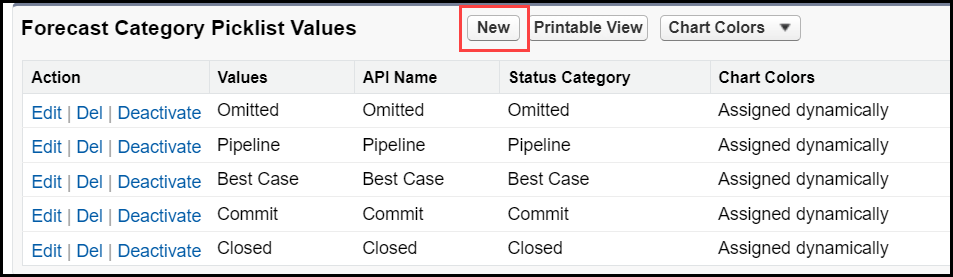
- Select New.
- Ensure the Label is “Most Likely”, the API Name is “Most_Likely”, and the Status Category is Most Likely. Hit Save at the bottom.
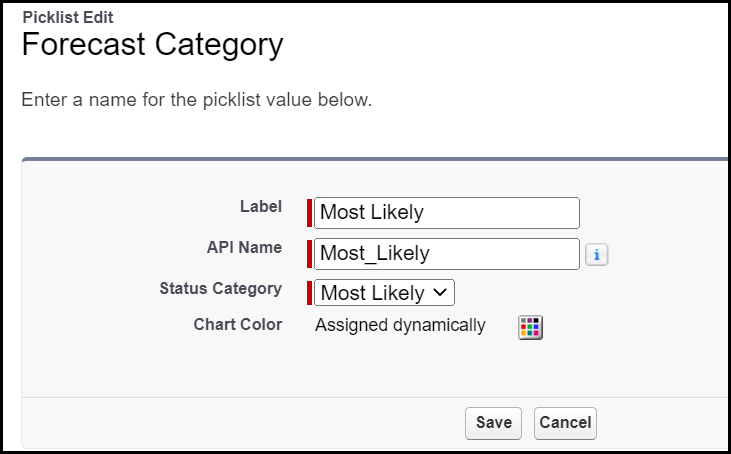
- You will now see “Most Likely” as an option.
- Now you can navigate back to your Stage field and change it to the Most Likely Forecast Category.
And voila. Changing the forecast category, in this case to Most Likely, is as simple as that.
Salesforce Opportunity Dashboard for Google Sheets
While built-in Salesforce features such as Forecast Category offer insights into the status of opportunities, sales managers ultimately need to visualize these metrics in meaningful and easy-to-grasp dashboards.
Salesforce dashboards allow sales leaders to monitor opportunities, set sales strategy, and understand where sales efforts are best spent. But building dashboards inside the Salesforce CRM is sometimes cumbersome, time-consuming, or impossible depending on your needs.
That’s why we designed our Salesforce Opportunity Dashboard for Google Sheets. With this pre-built Google Sheets dashboard, you can manage your sales opportunity pipeline, and monitor sales targets for individuals and teams.
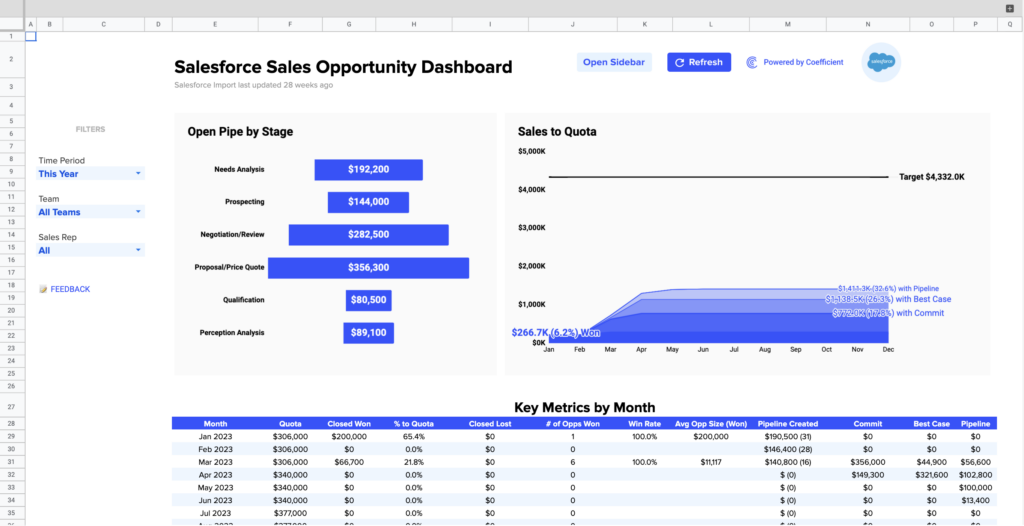
Salesforce Sales Opportunity Template is powered by your real-time Salesforce CRM data. The template enables sales teams to track opportunities, from the first touch, to the final close, and combine the funnel with individual and team targets to merge opportunity monitoring with performance.
And the best part? We’ve already built the entire dashboard for you. Here’s how the Sales Opportunity Template makes your life easier:
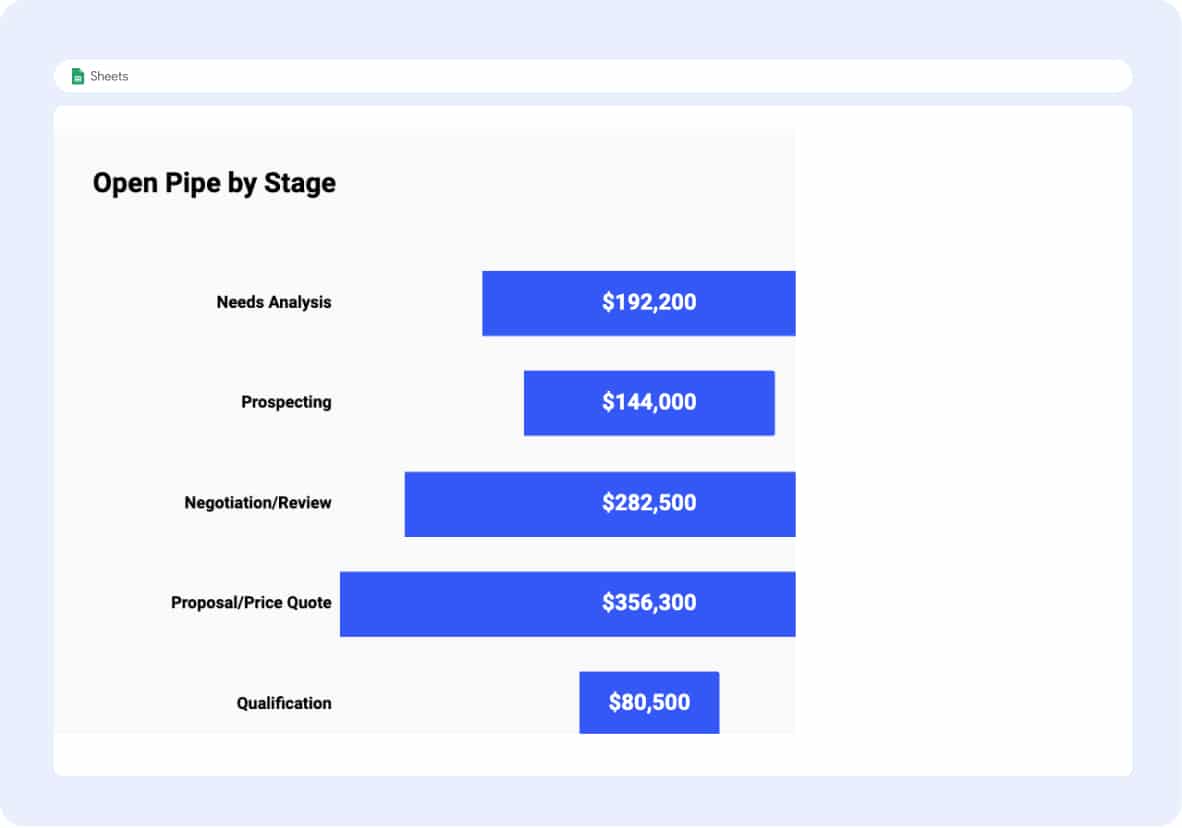
- Gain visibility into your opportunity pipeline by stage, for any month, quarter, or year — past, present, or future.
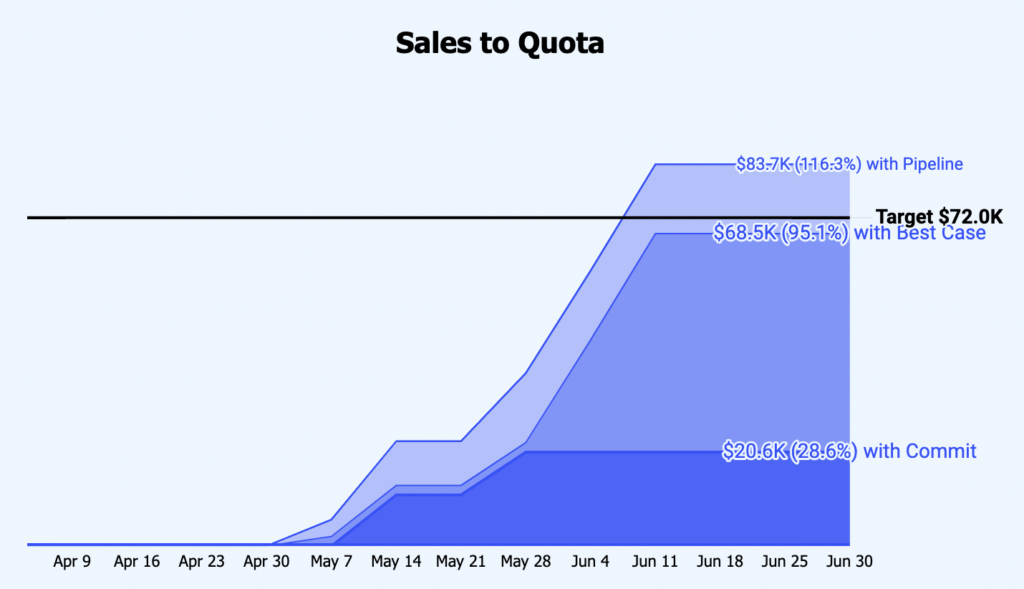
- Set individual and team quotas tied to pipeline volume and fluctuations
- Track monthly KPIs, such as win rate, average deal size, and value of each stage or forecast category
- Access a clean view of recent/upcoming opportunities, hyperlinked directly to their Salesforce pages
Download our free Salesforce Opportunity Template for Google Sheets right now!
[Download Salesforce Opportunity Dashboard for Google Sheets]
Forecast Categories: Accelerate Your Opportunities
Forecast categories in Salesforce allow you to rank your opportunities easily, so you can decide where to spend your sales efforts, and close deals faster.
But dashboards make the task even easier. With Coefficient’s Sales Opportunity Template for Google Sheets, you can track your Salesforce opportunity pipeline from start to finish without having to build a dashboard from scratch.
Download our free Sales Opportunity Template for Google Sheets below to try for yourself!
[Download Salesforce Opportunity Dashboard for Google Sheets]