


Table of Contents
![]()
- 1. Snowsight Dashboards Sunset June 22, 2026: A Migration Guide for Teams Without Engineers
- 2. Snowflake Data Integration Tools That Won’t Blow Your Budget
-
3. 7 Best Snowflake Data Visualization Tools in 2026 (With Pricing)
- What to Look for in a Snowflake Visualisation Tool
- Comparison: All 7 Snowflake Visualisation Tools
- 1. Coefficient â Best for Non-Technical and Business Teams
- 2. Tableau â Best for Enterprise Visual Analytics
- 3. Microsoft Power BI â Best for Microsoft-Stack Teams
- 4. Looker â Best for Governed Enterprise BI
- 5. Grafana â Best for Engineering and DevOps Teams
- 6. Metabase â Best Free Option for Internal Teams
- 7. Looker Studio â Best Free Option for Google-Ecosystem Teams
- Already Have the Data in Sheets? Publish It as a Live Dashboard
- Conclusion
- 4. Datameer Pricing 2026: What It Actually Costs (And What They Don’t Tell You)
- 5. Snowflake Intelligence Cost: What You Actually Pay in 2026
- 6. Bridging the Last Mile: How Coefficient Brings Live Snowflake Data to Your Spreadsheets
- 7. Top 5 Snowflake Reporting Tools for 2026
- 8. Snowflake Partners with Coefficient to Solve the Last Mile of the Modern Data Stack
- 9. 5 Best Snowflake ETL Tools for 2026 [w/ Feature Comparison Table]
- 10. How to Migrate Data from SQL Server to Snowflake
- 11. How to Connect Snowflake to Power BI
- 12. How to Connect BigQuery to Snowflake? Top 3 Methods
- 13. Connect Google Ads to Snowflake – Step-by-Step Guide
- 14. How to Connect Mailchimp to Snowflake? Top 3 Methods
- 15. How to Connect Freshdesk to Snowflake
- 16. How to Connect Klaviyo to Snowflake
- 17. How to Migrate from Redshift to Snowflake: A Comprehensive Guide
- 18. How to Connect Razorpay to Snowflake
- 19. How to Connect Chargebee to Snowflake?
- 20. How to Connect MongoDB to Snowflake? Top 3 Methods
- 21. How to Migrate from BigQuery to Snowflake
- 22. How to Connect Outreach to Snowflake
- 23. How to Connect Zoho CRM to Snowflake
- 24. How to integrate Shopify to Snowflake? 3 Simple ways explained

Snowflake stores and processes data brilliantly. Turning that data into dashboards is a different problem — and Snowflake’s native tooling does not fully solve it. Snowsight provides basic visualisations but its legacy dashboards are being deprecated on June 22 2026.
Every team needs an external visualisation layer. The obvious choices like Tableau, Power BI, Looker work well but carry enterprise price tags and implementation timelines. This guide covers 7 tools across the full range, with honest pricing and trade-offs for each.
What to Look for in a Snowflake Visualisation Tool
- Native Snowflake connector or OAuth support — not all connectors are maintained equally.
- Refresh rate and live query options — does it query Snowflake live or pull to an extract?
- Learning curve — is the tool built for data engineers writing SQL or for business users who need self-service?
- Cost at your team’s scale — per-user pricing compounds fast at 10, 20 or 50 users.
- Snowflake Semantic Views compatibility — can the tool surface governed metrics defined in Semantic Views without requiring raw SQL every time?
Comparison: All 7 Snowflake Visualisation Tools
| Tool | Best for | Snowflake connection | Starting price | Works in spreadsheets |
| Coefficient | Non-technical and business teams reporting & analytics | Native connector + Semantic Views picker | Free / $49/month | Yes — Google Sheets and Excel |
| Tableau | Enterprise visual analytics | Native connector + OAuth | $75/user/month | No |
| Power BI | Microsoft-stack organisations | Native + Enterprise ID SSO | Free (Desktop) / $10/user/month | No |
| Looker | Governed enterprise BI | Snowflake as query engine | ~$60,000/year | Via Coefficient connector |
| Grafana | Engineering and DevOps monitoring | Snowflake Enterprise plugin | Free tier / $299/month | No |
| Metabase | Budget-conscious internal teams | Native connector | Free (self-hosted) / $500/month | No |
| Looker Studio | Google Workspace teams | Via partner connector or Coefficient + Sheets | Free (connector costs extra) | Via Coefficient |
1. Coefficient — Best for Non-Technical and Business Teams
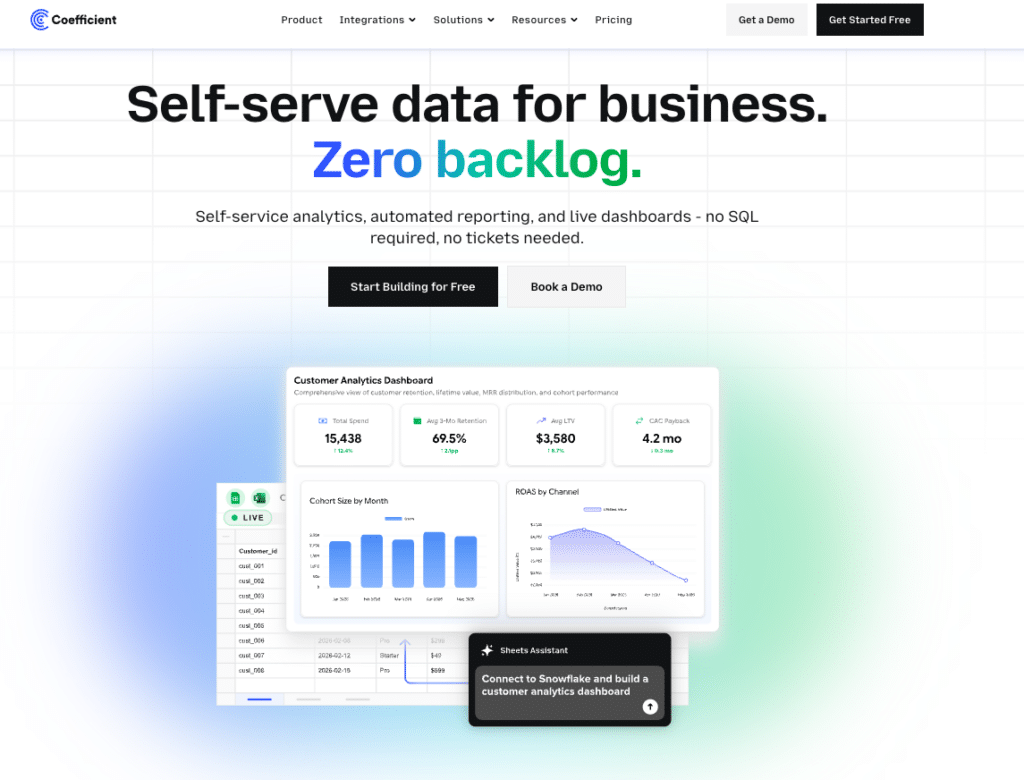
Why we picked it
Most Snowflake visualisation tools are built for analysts and data engineers. Coefficient is built for the finance managers, RevOps leads, sales ops teams and FP&A analysts who need Snowflake data but do not write SQL. It connects Snowflake directly to Google Sheets and Excel — the tools these teams already live in — and handles the data layer automatically.
Key features
Coefficient’s Snowflake connector surfaces Semantic Views through a visual Metrics and Dimensions picker. Business users select the metrics and dimensions they need and Coefficient pulls the data automatically. No SQL knowledge required. Works in both Google Sheets and Excel.
Auto-refresh keeps the data current on a schedule — hourly, daily or weekly. Two-way sync means teams can push updates back to Snowflake from the spreadsheet without a developer in the loop.
The AI layer is where Coefficient separates itself for business users. The AI Sheets Assistant generates formulas, builds pivot tables and creates charts from plain-English descriptions — no formula knowledge needed. AI Web Dashboards goes a step further: describe the dashboard you want in plain English and Coefficient publishes a live, shareable web dashboard directly from your Snowflake data in the spreadsheet. No BI tool licence. No connector fee. The dashboard updates automatically and shares via link.
For teams that need to upload data back to Snowflake from their spreadsheet, Coefficient handles that too — keeping the full data loop inside the tools the team already uses. See the full Coefficient product overview.
Pricing
Free plan available. Paid plans start from $49/month.
Pros
- No SQL needed — Semantic Views picker and GPT SQL Builder handle query generation.
- Works in both Google Sheets and Excel — no new tool to learn.
- AI dashboarding built using natural language input publishes live web dashboards from spreadsheet data.
- Two-way sync — pull from Snowflake and push back without leaving the spreadsheet.
- Free plan available — lowest barrier to entry of any tool in this list.
Cons
- AI Sheets Assistant is Google Sheets only — Excel users get the connector and GPT SQL Builder but not the full AI analysis layer.
- Not ideal for very large datasets at high refresh frequency via Sheets.
| Coefficient connects Snowflake to Google Sheets and Excel in minutes. Finance, RevOps and ops teams get live Snowflake data with no SQL — and AI dashboarding that publishes live web reports straight from the spreadsheet. Get started free. |
2. Tableau — Best for Enterprise Visual Analytics
Why we picked it
Tableau is the most recognised name in data visualisation and earns it. Its native Snowflake connector includes OAuth support and Quick Start auto-connection. For organisations with dedicated analysts who need complex, custom visualisations at scale, Tableau is the benchmark.
Key features
Live query and extract modes for Snowflake. Snowflake-optimised SQL pushdown keeps computation in the warehouse. Broad chart library, advanced calculated fields, and enterprise sharing via Tableau Server or Tableau Cloud.
Pricing
Tableau Creator starts at $75/user/month (annual). A 10-person team runs $9,000/year before any add-ons. The Data Management add-on (Tableau Prep and Catalog) adds cost on top. The Salesforce acquisition has affected Tableau’s independent roadmap — worth factoring into long-term planning.
Pros
- Industry-leading visualisation depth and chart customisation.
- Strong Snowflake native connector with OAuth and SSO support.
- Large ecosystem of community resources and certified implementation partners.
Cons
- $75/user/month makes it expensive for teams beyond a core analyst group.
- Steep learning curve — business users typically cannot self-serve without training.
- Salesforce acquisition has slowed some product development areas.
3. Microsoft Power BI — Best for Microsoft-Stack Teams
Why we picked it
Power BI is the natural fit for organisations already on Microsoft 365 and Azure. Its Snowflake connector supports Microsoft Enterprise ID SSO — making authentication notably smoother than most alternatives. If your organisation already pays for Microsoft Fabric, Power BI is included.
Key features
Native Snowflake connector with Enterprise ID SSO. DirectQuery mode for live Snowflake data. Power BI Desktop for local report building, Power BI Service for cloud sharing. Microsoft Fabric now bundles Power BI as the reporting layer within the broader data platform.
Pricing
Power BI Desktop is free but Windows only — a hard blocker for Mac-heavy teams. Power BI Pro is $10/user/month. Power BI Premium is $20/user/month. Microsoft Fabric SKUs bundle Power BI at the platform level for organisations running the full Microsoft data stack.
Pros
- Strong Snowflake authentication via Microsoft Enterprise ID SSO — cleaner than most connectors.
- Most affordable per-user pricing of the major BI tools at $10/user/month.
- Free desktop version works well for individual analysts on Windows.
Cons
- Power BI Desktop is Windows only — excludes Mac users from the free tier entirely.
- Weaker than Tableau on advanced visualisation and chart customisation.
- Power BI Service (cloud sharing) requires Pro or Premium — the free tier is local only.
4. Looker — Best for Governed Enterprise BI
Why we picked it
Looker is the right tool when data governance is the primary concern. LookML models define business metrics — Revenue, Churn, Pipeline — once in the semantic layer. Every team that queries Snowflake through Looker sees the same number, calculated the same way. No metric inconsistency across departments.
Key features
Looker uses Snowflake as the query engine — all computation stays in the warehouse, no data extracts. LookML semantic layer governs how metrics are defined and aggregated. Business teams explore data through a point-and-click interface without writing SQL. Coefficient’s Looker connector lets teams pull governed Looker Explores directly into Google Sheets or Excel — giving RevOps and finance teams spreadsheet access to LookML-governed Snowflake metrics without SQL.
Pricing
Looker starts at approximately $60,000/year. Custom pricing based on users and data volume. Not suitable for SMB or mid-market teams without dedicated data engineering resources.
Pros
- Strongest data governance in this list via the LookML semantic layer.
- All computation stays in Snowflake — no data movement or extract costs.
- Strong enterprise security and access controls.
Cons
- ~$60K/year starting price puts it out of reach for most SMB and mid-market teams.
- LookML requires data engineering expertise to set up and maintain.
- Business users still need an interface layer (or Coefficient) to access data in spreadsheets.
5. Grafana — Best for Engineering and DevOps Teams
Why we picked it
Grafana covers a use case none of the other tools in this list addresses: monitoring and observability. If your team needs to track Snowflake warehouse performance, credit consumption, query latency and data pipeline health — not business KPI reporting — Grafana is the right fit.
Key features
The Snowflake Enterprise data source plugin for Grafana includes pre-built dashboards for Snowflake Data Ownership and Snowflake Overview — warehouse usage, credit consumption and query performance out of the box. Supports time series and table formats, Grafana variables for dynamic queries, and multiple authentication methods including OAuth and key pair authentication. Open-source self-hosted option available.
Pricing
Grafana Cloud has a free forever tier covering 3 users. Grafana Cloud Pro starts at $299/month. The Snowflake plugin requires a Grafana Enterprise licence for self-managed instances — custom pricing, typically $20,000+/year based on usage.
Pros
- Purpose-built for monitoring and observability — pre-built Snowflake dashboards included.
- Open-source self-hosted option with free community plugin available.
- Free Cloud tier covers small engineering teams with up to 3 users.
Cons
- Not a business reporting tool — not suitable for finance, sales or marketing dashboards.
- Snowflake Enterprise plugin requires Grafana Enterprise for self-managed instances.
- Steep learning curve for non-technical users — built for engineers.
6. Metabase — Best Free Option for Internal Teams
Why we picked it
Metabase is the most accessible path to Snowflake dashboards for teams without budget for enterprise BI. Non-technical users can ask questions and build charts through a simple point-and-click interface without writing SQL. The self-hosted version is completely free.
Key features
Native Snowflake connector. Question-and-answer interface for non-SQL users. SQL editor for analysts who need it. Dashboard builder with sharing and embedding. Automated reports via email or Slack. Open-source under AGPL licence for self-hosted deployments.
Pricing
Self-hosted is free — your team manages hosting, updates and maintenance. Metabase Cloud starts at $500/month for 5 users. Pro tier adds SSO, audit logs and advanced permissions.
Pros
- Self-hosted version is completely free — lowest cost entry point in this list.
- Accessible to non-technical users without SQL training.
- Good gateway tool before committing to Tableau or Looker at enterprise scale.
Cons
- Self-hosted means your team owns updates, uptime and security patches.
- Not suitable for enterprise governance or compliance requirements.
- Cloud version at $500/month for 5 users is not as cheap as the self-hosted option implies.
7. Looker Studio — Best Free Option for Google-Ecosystem Teams

Why we picked it
Looker Studio is free and familiar for teams already in Google Workspace. The catch: there is no native Snowflake connector. You need either a paid partner connector or the Coefficient path — pulling Snowflake data into Google Sheets with Coefficient and connecting Sheets to Looker Studio via the free native Sheets connector. More on the total cost: is Looker Studio actually free?
Key features
Free drag-and-drop dashboard builder. Shareable via link — no Google account required for viewers. Native connectors for GA4, Google Ads, Search Console and Google Sheets. Partner connectors for everything else, including Snowflake via Supermetrics, Coupler.io and others starting at $49/month.
Pricing
Looker Studio is free. The Snowflake connection is not — partner connectors start at $49 to $119/month per source, or use Coefficient’s Snowflake connector to feed Sheets and connect Looker Studio for free. Looker Studio Pro is $9/user/month but does not add a Snowflake connector.
Pros
- Free dashboard builder with no seat licence cost.
- Shareable via link — no account needed for viewers.
- Familiar to anyone using Google Workspace.
Cons
- No native Snowflake connector — the connection always has a cost attached.
- Performance degrades noticeably with large datasets or complex multi-source blends.
- Limited visualisation depth compared to Tableau or Power BI.
Already Have the Data in Sheets? Publish It as a Live Dashboard

If your team is already pulling Snowflake data into Google Sheets with Coefficient, you can skip the BI tool layer entirely. Coefficient’s AI Dashboards lets you describe your dashboard in plain English — pipeline by stage, revenue by region, credit consumption by warehouse — and publishes a live shareable web dashboard directly from your Snowflake data in the spreadsheet.
No Tableau licence. No Looker Studio connector fee. No Power BI Windows requirement. The dashboard updates automatically on your Coefficient refresh schedule and shares via link with anyone inside or outside your organisation — including stakeholders who have never opened a spreadsheet in their lives.
| Pull live Snowflake data into Sheets with Coefficient, describe your dashboard in plain English and publish it as a live web report. Get started free. |
Conclusion
The right Snowflake visualisation tool depends on who is using it. Tableau and Looker serve large enterprises with dedicated analyst teams. Power BI is the natural fit for Microsoft-stack organisations. Grafana handles engineering and DevOps monitoring. Metabase is the free starting point for internal tools. And for the finance managers, RevOps leads and ops teams who need Snowflake data in the tools they already use — without SQL, without a BI tool licence and with AI dashboarding built in — Coefficient is the option most teams overlook until they try it. Get started free.
