


Table of Contents
![]()
-
1. Snowsight Dashboards Sunset June 22, 2026: A Migration Guide for Teams Without Engineers
- What you used Snowsight Dashboards for
- What's being deprecated, exactly
- The official paths compared
- Side-by-side comparison
- A five-week Snowsight Dashboards migration plan
- What you don't lose by leaving Snowsight Dashboards
- What if you don't migrate off of Snowsight Dashboards by June 22?
- Frequently asked questions
- Get started
- 2. Snowflake Data Integration Tools That Won’t Blow Your Budget
- 3. 7 Best Snowflake Data Visualization Tools in 2026 (With Pricing)
- 4. Datameer Pricing 2026: What It Actually Costs (And What They Don’t Tell You)
- 5. Snowflake Intelligence Cost: What You Actually Pay in 2026
- 6. Bridging the Last Mile: How Coefficient Brings Live Snowflake Data to Your Spreadsheets
- 7. Top 5 Snowflake Reporting Tools for 2026
- 8. Snowflake Partners with Coefficient to Solve the Last Mile of the Modern Data Stack
- 9. 5 Best Snowflake ETL Tools for 2026 [w/ Feature Comparison Table]
- 10. How to Migrate Data from SQL Server to Snowflake
- 11. How to Connect Snowflake to Power BI
- 12. How to Connect BigQuery to Snowflake? Top 3 Methods
- 13. Connect Google Ads to Snowflake – Step-by-Step Guide
- 14. How to Connect Mailchimp to Snowflake? Top 3 Methods
- 15. How to Connect Freshdesk to Snowflake
- 16. How to Connect Klaviyo to Snowflake
- 17. How to Migrate from Redshift to Snowflake: A Comprehensive Guide
- 18. How to Connect Razorpay to Snowflake
- 19. How to Connect Chargebee to Snowflake?
- 20. How to Connect MongoDB to Snowflake? Top 3 Methods
- 21. How to Migrate from BigQuery to Snowflake
- 22. How to Connect Outreach to Snowflake
- 23. How to Connect Zoho CRM to Snowflake
- 24. How to integrate Shopify to Snowflake? 3 Simple ways explained

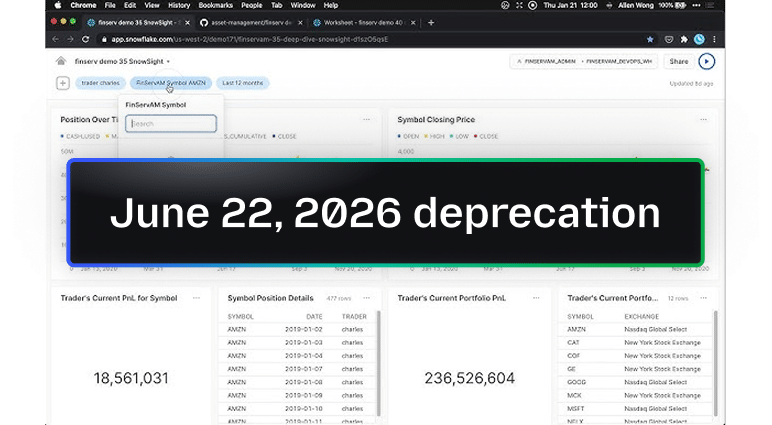
If you built a chart in a Snowsight dashboard that someone on your team checks every Monday, you have about five weeks before it stops working.
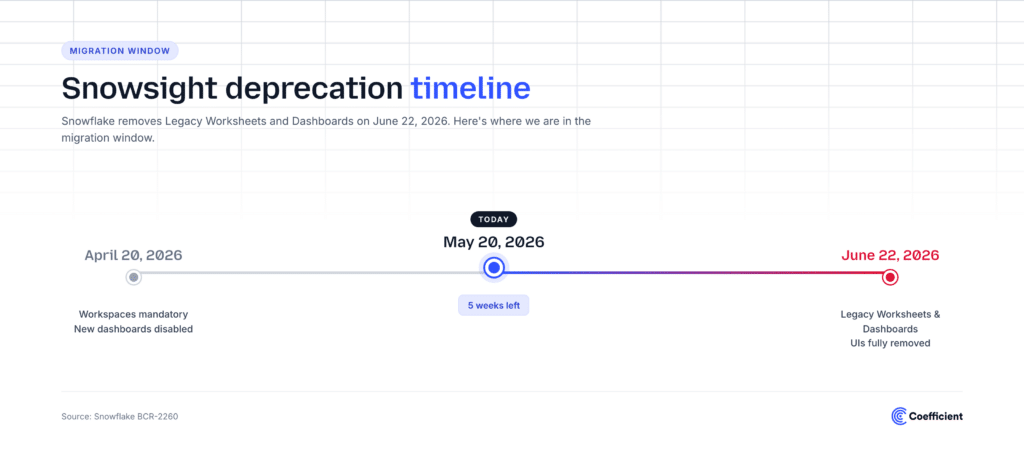
On June 22, 2026, Snowflake removes Legacy Worksheets and Legacy Dashboards from Snowsight. New dashboard creation was already disabled on April 20, 2026. The official replacement paths are Workspaces (a modernized SQL editor) for worksheets, and either Streamlit apps or a third-party BI tool for dashboards.
For most teams, the worksheet migration is a straight swap. The dashboard migration is not. The people who built dashboards in Snowsight were rarely Python developers, and Streamlit is a Python framework. So most teams are looking at a real migration question right now, with a five-week clock.
This is a practical guide to your options if you’re one of those teams.
What you used Snowsight Dashboards for
Almost every Snowsight Dashboard we see does one of these:
- A revenue, pipeline, or usage chart that runs off a single SQL query against the warehouse
- A small set of tiles that finance, ops, or RevOps glances at on a recurring basis
- A board shared with a few people who don’t have a BI tool license
- A scheduled refresh so the numbers are fresh when someone opens it
That’s it. Quiet, useful, didn’t need a BI team. That’s exactly the workflow that’s about to break.
What’s being deprecated, exactly
The BCR notice lays out two parallel changes.
Legacy Worksheets becomes Workspaces. Workspaces is the modernized SQL editor with file-and-folder organization, sharing, and Git integration. As of April 20, 2026, it became mandatory. Worksheets URLs still work as a migration bridge, and account admins can temporarily revert via the USE_WORKSPACES_FOR_SQL parameter, but on June 22 the legacy Worksheets UI is fully removed.
Legacy Dashboards has no native replacement. Snowflake offers two paths:
- “Generate Streamlit app.” A one-click conversion that creates a Streamlit (Python) application from your dashboard.
- Migrate to a third-party BI tool. Power BI, Tableau, Looker Studio, Sigma, and others.
After June 22, the Legacy Dashboards UI is removed from Snowsight entirely. The dashboards you don’t migrate become inaccessible.
The official paths compared
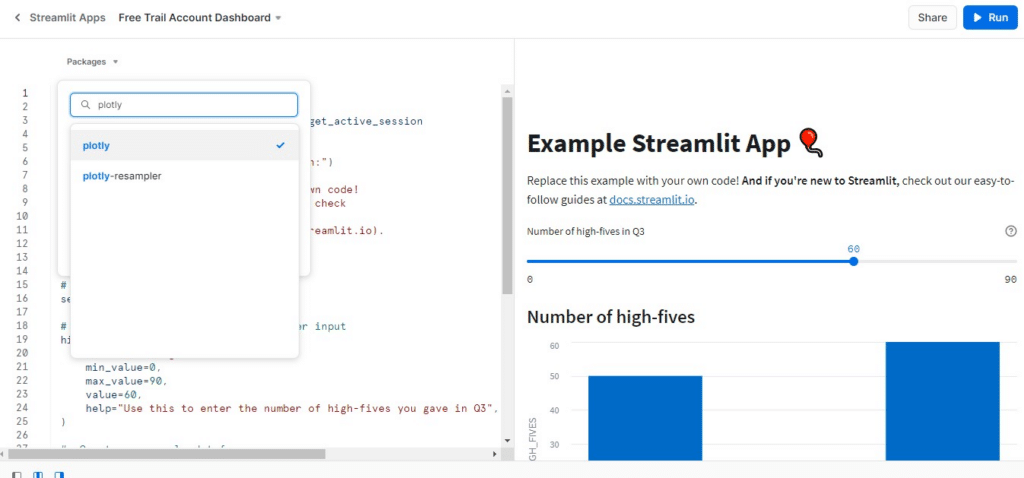
Path 1: Streamlit (Snowflake’s recommended migration)
The “Generate Streamlit app” button sounds like a one-click fix. The conversion itself is one click. What you get on the other side is a Streamlit application, a Python framework for building data apps.
If you have a developer on the team, this is a real option. The output is owned, customizable, and stays inside Snowflake.
If you don’t have a developer, the next change you need to make to the dashboard is the change that breaks the workflow. Streamlit isn’t a dashboard tool. It’s a way to build a small Python app that happens to display data. Edits require Python. Permissions require Snowflake roles. Sharing means sending people into Snowsight to launch the app.
Streamlit was designed for data engineers and ML practitioners. It’s a reasonable replacement for engineering-owned dashboards. It’s a structural mismatch for the FP&A analyst, RevOps lead, or marketer who used Snowsight Dashboards in the first place.
Path 2: Power BI, Tableau, Looker Studio
Traditional enterprise BI tools, traditional visualizations, traditional cost – aka expensive. Three things to know:
- You’re rebuilding from scratch. The logic from your Snowsight dashboard (the SQL, the filters, the chart configuration) does not translate. Each tool has its own modeling language: DAX in Power BI, LookML in Looker, Tableau’s calculated fields. What ran as a saved SQL query becomes a new data model.
- You need someone who knows the tool. None of these are self-serve for the typical business user. Power BI needs Power Query and DAX skills. Tableau needs a Tableau developer. Looker Studio is the friendliest of the three, but its modeling is shallow and the connector story for Snowflake is thin.
- Licensing costs are real. Power BI Pro is per-user. Tableau Creator is $75 per user per month. Looker Studio is free up to a point and then steps up to Looker.
If your team already runs one of these tools and has the people to maintain it, this is a fine path. If they didn’t have it before Snowsight Dashboards went away, buying a BI platform under a five-week deadline is not a migration. It’s a procurement project.
Path 3: Keep working from the spreadsheet (Coefficient)
The reason this path exists: the people who used Snowsight Dashboards were already doing spreadsheet-style work. They just happened to be doing it inside Snowflake’s UI.
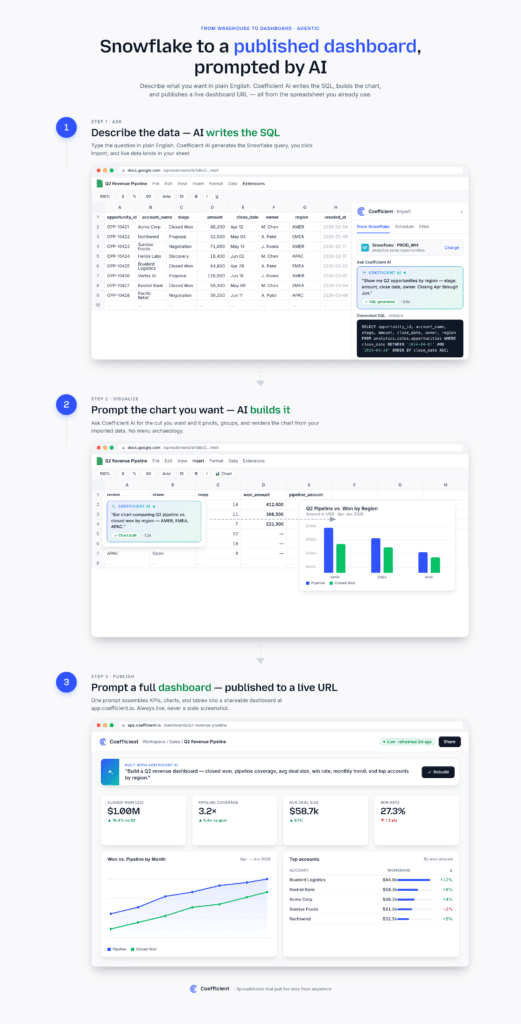
Coefficient connects Snowflake to Google Sheets and Excel, lets you query with SQL or a visual builder, and publishes the result as a live web dashboard. The logic lives in the spreadsheet (formulas, pivots, AI agents), and the dashboard is one click away.
What that looks like in practice:
- Pull live Snowflake data into Sheets or Excel with scheduled refresh.
- Build the model in the spreadsheet using formulas, pivots, and AI-assisted cleanup.
- Publish as a shareable web dashboard with one click. No Snowflake login required for viewers.
- Set Slack or email alerts on thresholds that matter.
The unlock isn’t a new tool to learn. It’s that the work happens in the tool the business user already uses, and the dashboard is the output, not the starting point.
Side-by-side comparison
| Dimension | Streamlit | Power BI / Tableau / Looker | Coefficient |
| Built for non-engineers | No | No | Yes |
| Skill required | Python | DAX / Tableau / LookML | Basic AI Prompting |
| Time to first dashboard | Days | Days to weeks | Minutes |
| Live Snowflake data | Yes | Yes | Yes |
| Scheduled refresh | Manual setup | Yes | Yes |
| Sharing | Snowflake login required | License per viewer | Public link, no login |
| Alerts | Custom code | Add-on or upgrade | Built in (Slack, email) |
| Migration effort | Convert app, then maintain code | Rebuild from scratch | Paste SQL, publish |
A five-week Snowsight Dashboards migration plan
As we write this, we’re already past April 20. You have until June 22. Here’s how to spend the time.
Week 1: Inventory. List every Snowsight Dashboard your team relies on. For each one, note who uses it, what question it answers, and how often it refreshes. This is the only step you can’t skip. Dashboards no one inventoried become silent breakages on June 23.
Week 2: Triage. For each dashboard, ask three questions:
- Does anyone on the team write Python? If no, Streamlit is off the table for this dashboard.
- Is the dashboard’s logic pure SQL, or does someone manually transform the output before sharing? If manual, it belongs in a spreadsheet.
- Who actually opens the dashboard? Optimize for their tool, not the data team’s.
Week 3: Migrate the spreadsheet-suitable ones. For each dashboard that fits the spreadsheet-native path:
- Install Coefficient in Google Sheets or Excel (under a minute).
- Connect Snowflake with your existing credentials.
- Paste the SQL from your Snowsight Dashboard into Coefficient → Custom SQL Query.
- Set the same refresh schedule.
- Build the chart in the spreadsheet, then click Publish to generate the live dashboard URL.
Week 4: Migrate the rest. For the dashboards that genuinely need Streamlit (engineering-owned, complex logic) or a BI tool (already in use, already licensed), do those migrations now while the conversion tools are still available.
Week 5: Verify and cut over. Run the new dashboards in parallel for a week. Check the numbers match. Update bookmarks. Send the new links. On June 22, the old URLs go dark.
What you don’t lose by leaving Snowsight Dashboards
- Live data. Coefficient refreshes from Snowflake on a schedule you set.
- Performance. Queries hit Snowflake directly. The spreadsheet stores the result, not the source.
- Governance. The SQL is visible. Permissions are managed in Snowflake. The logic is auditable in the spreadsheet.
- Sharing without licenses. Published dashboards are a public URL with optional access controls.
What if you don’t migrate off of Snowsight Dashboards by June 22?
On June 23, Legacy Dashboards stop being accessible. The links you’ve shared in Slack threads, email signatures, and Notion docs stop working. The scheduled refreshes don’t fire. The chart someone glanced at on Monday morning isn’t there on Monday.
That’s the quiet version. The louder version is that the team that built and depended on the dashboard now has to recreate it under pressure, while also doing their actual job.
The teams who are starting now are starting because they don’t want to find out in late June what broke.
Frequently asked questions
When exactly does Snowsight Dashboards go away? June 22, 2026. New dashboard creation was already disabled on April 20, 2026.
What’s the official Snowflake replacement for Legacy Dashboards? Streamlit apps (Python) for engineering-owned dashboards, or a third-party BI tool. There is no native non-code replacement.
Can I keep using Legacy Worksheets after April 20? Account admins can temporarily revert via the USE_WORKSPACES_FOR_SQL parameter until June 22, 2026, when the legacy UI is removed.
Is “Generate Streamlit app” a real one-click migration? The conversion is one click. The maintenance afterward requires Python. For non-developer dashboard owners, it shifts the maintenance burden to engineering.
Do I have to use a BI tool to replace a Snowsight Dashboard? No. If your dashboard was a SQL query plus a chart, it can live in a spreadsheet with a live Snowflake connection and a published dashboard URL. That’s what most non-engineering teams end up doing.
Can I keep using my Snowflake roles and permissions for dashboard access? Yes. The Snowflake permissions stay in Snowflake. Coefficient inherits them on the data side; dashboard sharing on the publish side can layer on link-based access controls.
Get started
Install Coefficient for Google Sheets or Excel. Paste your SQL, set a refresh, publish a dashboard.
If you want help walking through the migration, book a call and we’ll map your dashboards together and run the first migration on the spot.
Coefficient connects Snowflake to Google Sheets and Excel and publishes live web dashboards from your spreadsheet model. The skills required are SQL, spreadsheet, or just basic AI prompting to build SQL, spreadsheet formulas, and entire dashboards in spreadsheets or in your browser. No Python, no BI engineer.
