
Testimonial

"Coefficient's Google Sheets templates are the next step in spreadsheet evolution–connected spreadsheets. Connected sheets mean faster, better, and more accurate analysis by everyone–especially if you can't code!"
Evan Cover
Director, BI Engineering and Governance, Klaviyo
Table of Contents
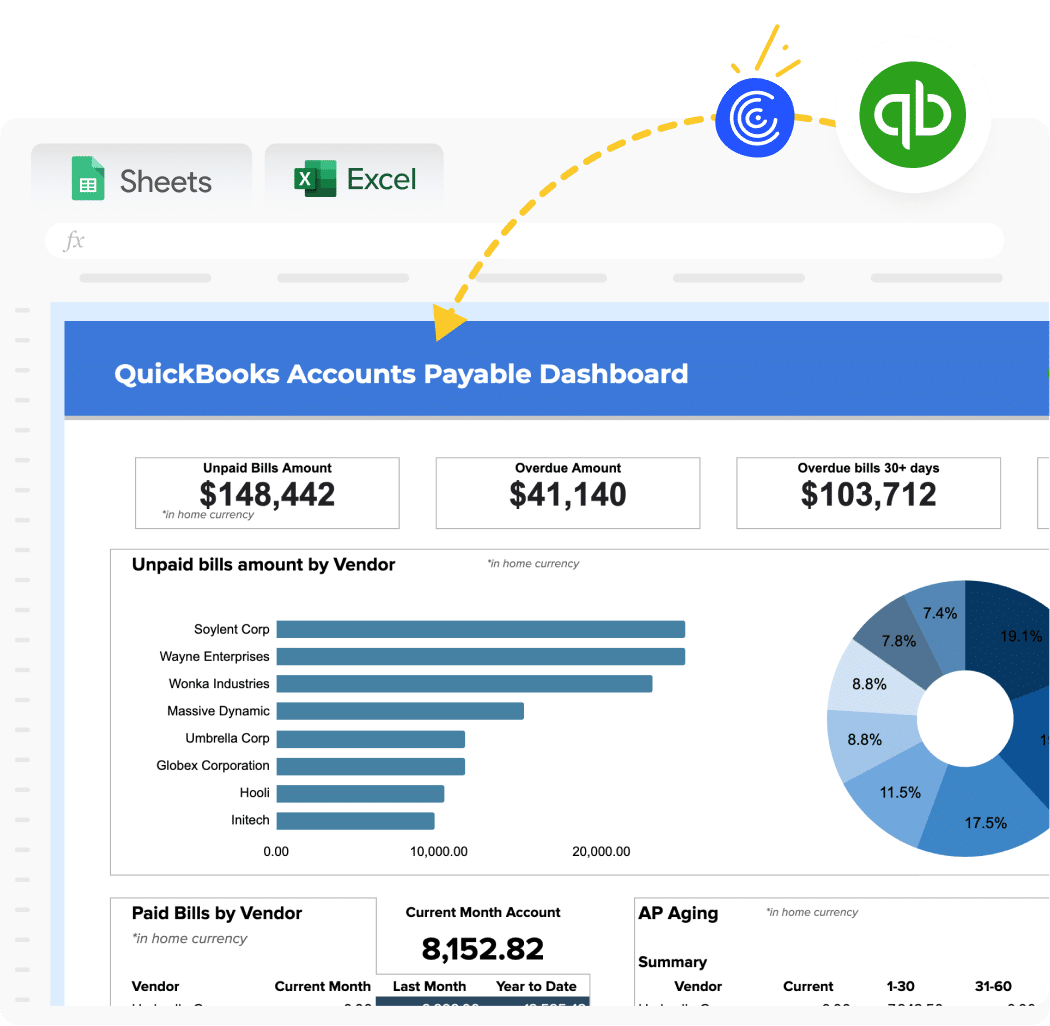
Free QuickBooks Online Template for Accounts Payable Dashboard
What is an Accounts Payable Dashboard Report?
An Accounts Payable (AP) Dashboard Report is a comprehensive visual representation of a company’s outstanding bills and payment obligations. It provides real-time insights into the financial health of a business by tracking various AP metrics. This dashboard helps finance teams and business owners monitor cash flow, manage vendor relationships, and make informed decisions about when and how to pay bills.
Benefits of using QuickBooks Online Accounts Payable Dashboard Template
- Real-time visibility: Access up-to-date AP data directly from QuickBooks Online, ensuring accurate financial insights.
- Improved cash flow management: Monitor outstanding bills and payment schedules to optimize cash flow and avoid late payments.
- Enhanced vendor relationships: Track vendor-specific data to maintain good relationships and negotiate better terms.
- Time-saving automation: Eliminate manual data entry and report creation, freeing up time for strategic financial analysis.
- Better decision-making: Gain instant insights into AP trends and anomalies to make informed financial decisions.
Metrics Tracked in the Report
- AP Aging Summary
- Current
- 1-30 days
- 31-60 days
- 61-90 days
- 91 days and over
- Total
- AP Aging Details
- Vendor
- Date
- Due Date
- Past due (days)
- Amount
- Open Balance
- Vendor Bills
- Domain
- AP Account
- ID
- Created at
- Updated at
- Currency
- Total amount
- Tax amount
- Home balance
- Key AP Indicators
- Unpaid bills amount
- Overdue amount
- Overdue bills 30+ days
- Overdue bills 90+ days
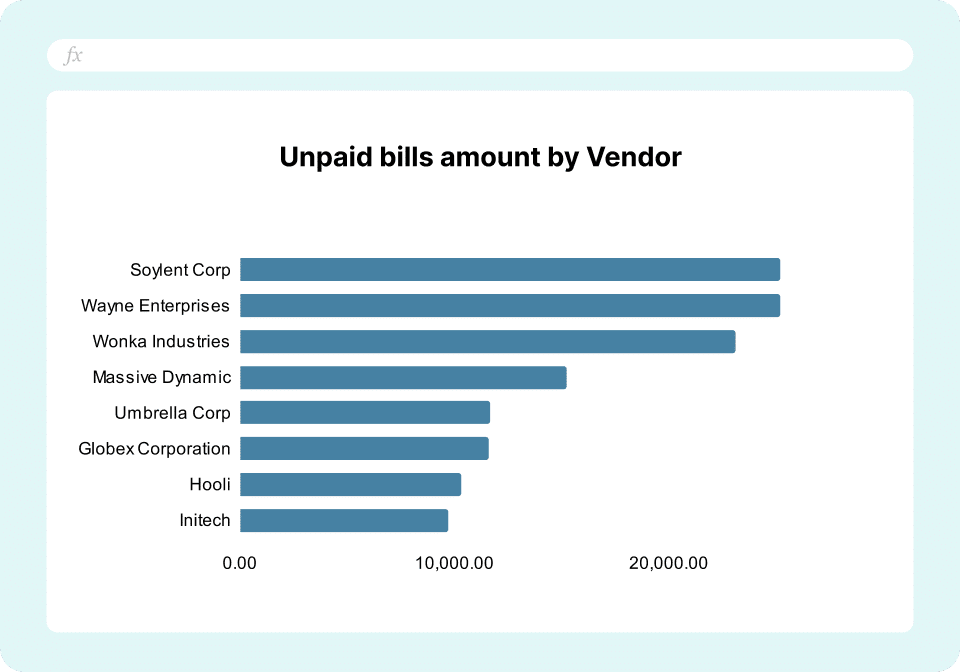
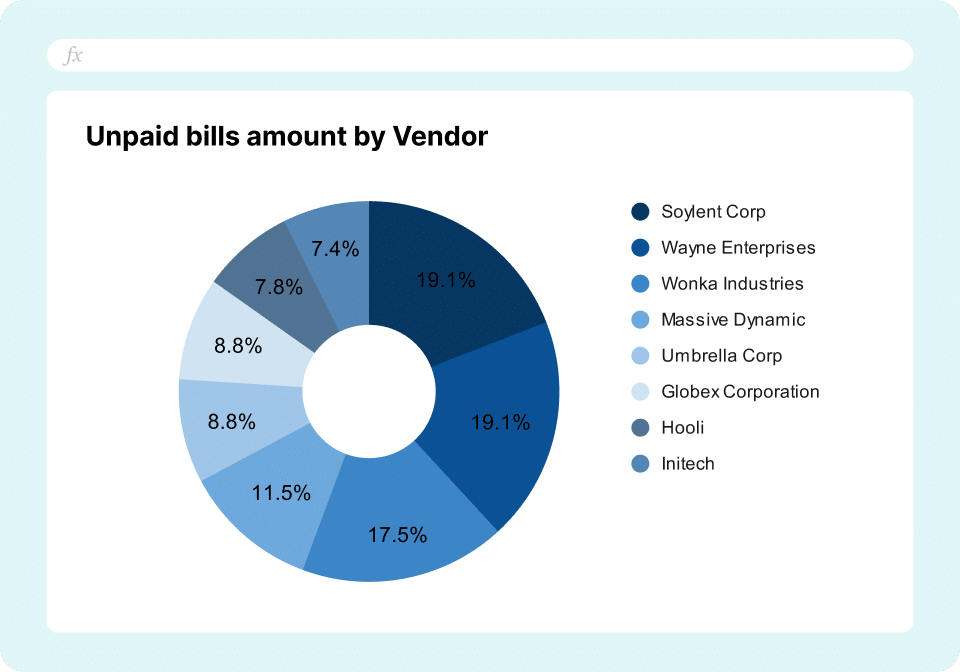
- Unpaid bills amount by vendor
- Paid bills by vendor
More Metrics to Track and Analyze on Google Sheets
With Coefficient’s QuickBooks integration, you can pull additional financial data into your Google Sheets, such as:
- Transaction lists by customer, vendor, or date
- Balance sheet details
- Cash flow statements
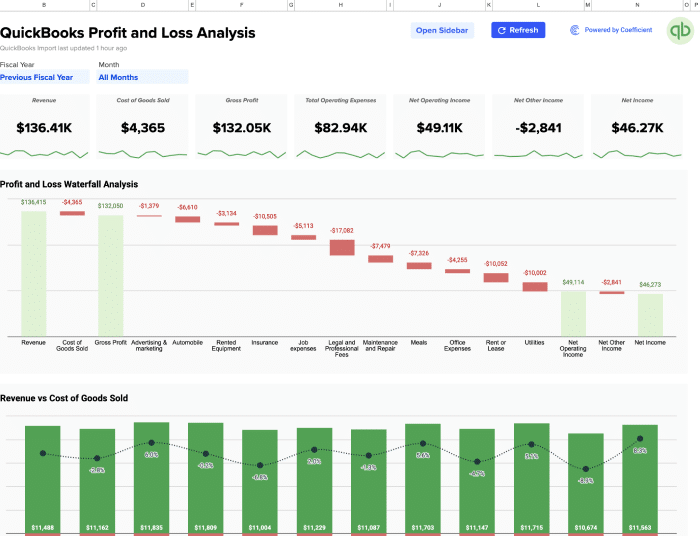
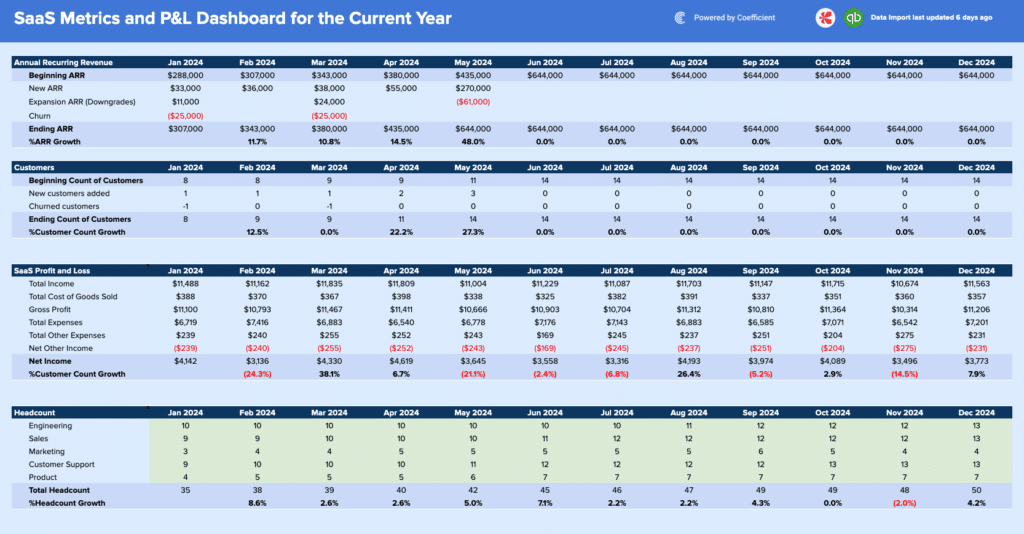
- Profit and loss reports
These metrics provide a comprehensive view of your financial performance, allowing for deeper analysis and more informed decision-making.