QuickBooks users need more than basic reporting features. Third-party reporting solutions add advanced capabilities, automation, and analytics that help businesses analyze their financial data and make faster decisions.
Let’s explore a few of the top QuickBooks reporting tools in more detail!
QuickBooks Reporting Tools Feature Comparison (2025)
| Feature | Coefficient | Domo | Tableau | Fathom | Spreadsheet Sync |
| Row Limits | 5,000 (Free)<br>Unlimited (Paid) | 10M+ | Unlimited | 100K-500K | 1,000 |
| Data Refresh | Real-time (Pro)<br>Hourly (Pro)<br>Daily (Starter) | 15 min | Daily | Daily | Hourly |
| Starting Cost | $0/mo (Free)<br>$49/mo (Paid) | ~$750/user/year | $15/user/mo | $50/mo | Included w/ QB Advanced ($235/mo) |
| Viewer License | Free | $750/year | $15/mo | N/A | N/A |
| Data Sources | 70+ | 1000+ | 200+ | QuickBooks only | QuickBooks only |
| AI Features | Yes (Advanced) | Yes | Limited | No | No |
| Alerts | Yes (Slack/Email) | Yes | Yes | Limited | Basic |
| Security | SOC 2 Type II | SOC 2, HIPAA* | SOC 2 | SOC 2 | Basic |
| MoM/YoY Comparison | Yes | Yes | Yes | Yes | No |
| Live Sync | Yes | Yes | No | No | No |
*HIPAA compliance available with Business Critical plan only
1. Coefficient – Real-time QuickBooks Reporting
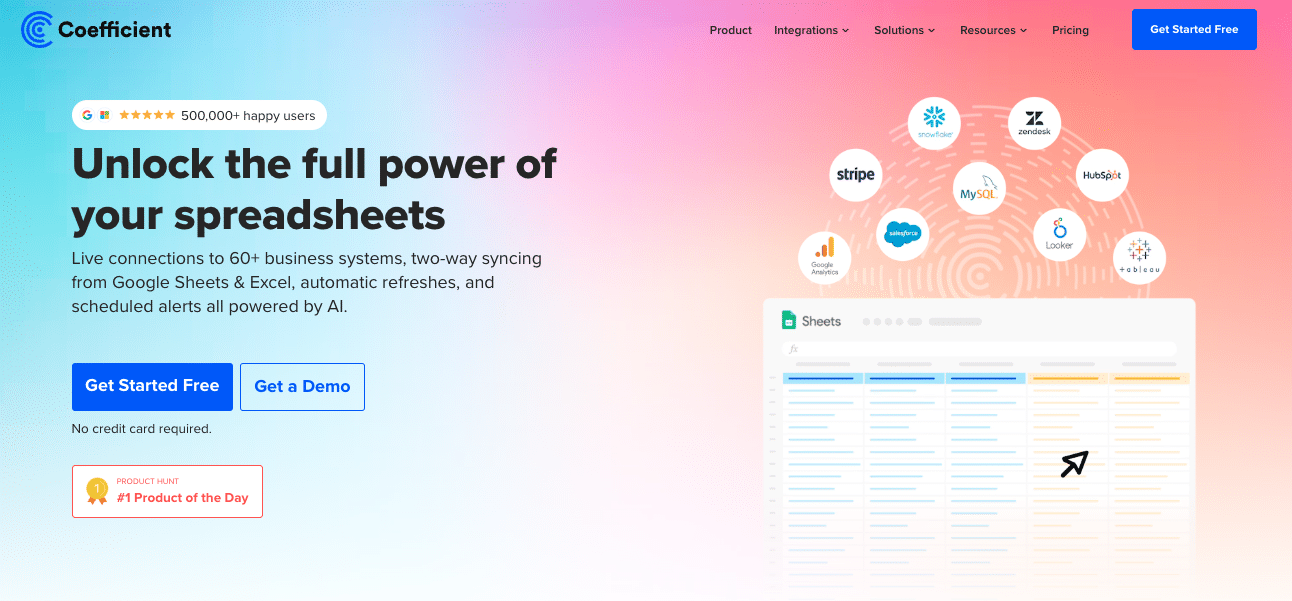
Forget learning another dashboard tool. Coefficient brings QuickBooks data directly into the spreadsheets you already use.
What’s New in 2025
Coefficient just launched major QuickBooks enhancements:
- More standard reports with advanced filters and sorting options
- Period comparisons built-in (MoM, YoY, QoQ) without formulas
- Streamlined UX – no more preview steps slowing you down
- Professional styling that persists through refreshes (finally!)
- Smart formatting that respects your custom edits
Key Features
- Two-way sync between QuickBooks and spreadsheets (yes, you can push data back)
- Live data updates that refresh automatically on schedule
- Multi-source blending – combine QuickBooks with Salesforce, HubSpot, SQL databases
- AI-powered analysis for instant insights and formula generation
The Reality Check
Pros:
- Zero learning curve if you know spreadsheets
- Your reports stay live—no more “as of” timestamps
- Free tier actually useful for small teams
- Connects 70+ other tools beyond QuickBooks
Cons:
- Requires Google Sheets or Excel (not standalone)
- Advanced AI features need higher tiers
- Limited visualization compared to dedicated BI tools
Pricing (As of October 2025)
- Base fee: ~$750/user/year minimum
- Credits: Pre-purchased for data operations
- Typical cost: $20,000-100,000+ annually
- No public pricing: Requires sales consultation
2. Domo – Enterprise Analytics Platform
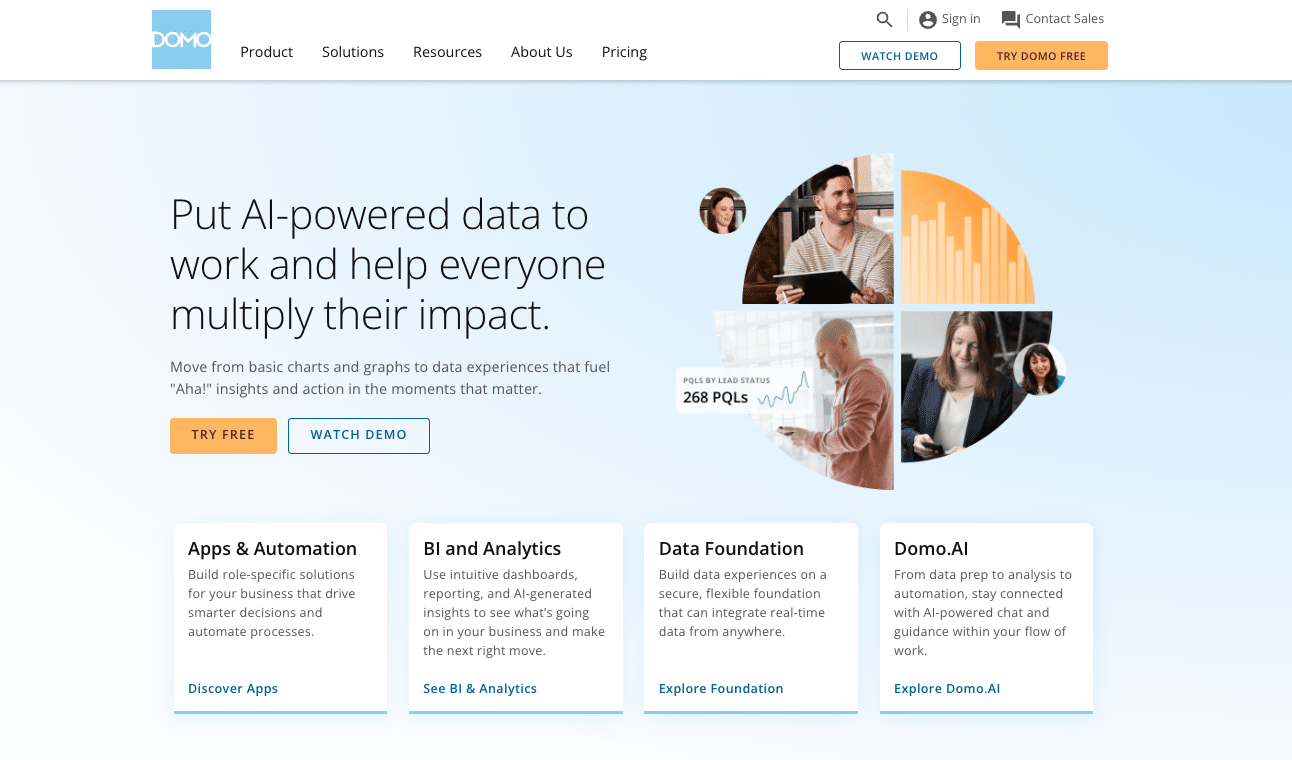
Domo combines business intelligence with collaboration features, making it suitable for large teams that need to share and analyze QuickBooks data across departments.
Key Features
- Advanced data visualization options
- Built-in AI analytics
- Mobile-first design
- Custom app development options
Pros
- Extensive data source connections
- Strong mobile experience
- Rich visualization library
- Enterprise-grade security
Cons
- Higher price point
- Complex setup process
- Requires technical expertise
- Minimum contract commitments
Pricing (As of October 2025)
- Standard: Starts at $83/user/month (5-user minimum)
- Enterprise: Custom pricing
- Business Critical: Custom pricing with advanced security
Support
- Standard: Customer portal and business hours support
- Premium: 24/7 support with dedicated team (Enterprise/Business Critical)
- Technical consultation available for complex implementations
3. Tableau – Advanced Data Visualization
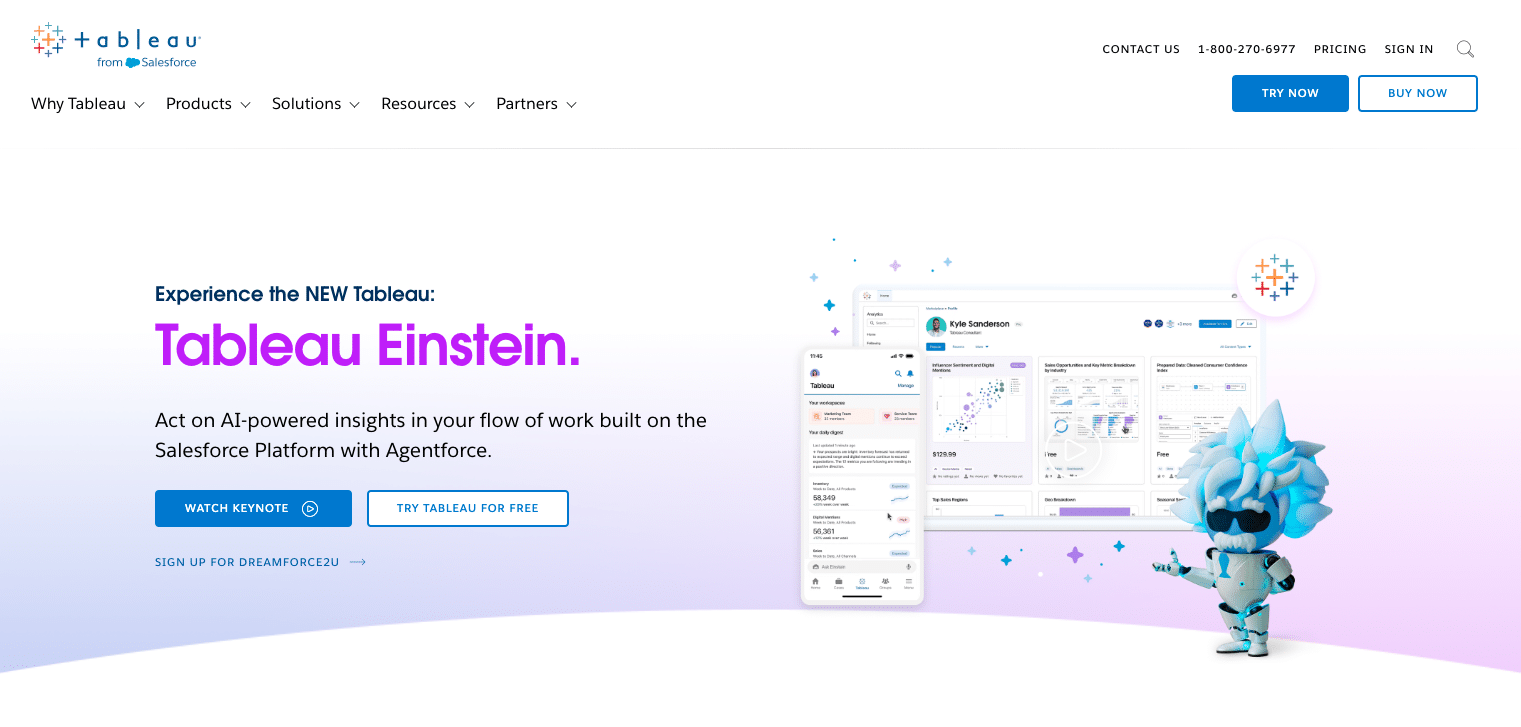
Tableau specializes in creating visual representations of data. It’s popular among data analysts and businesses that need to create detailed, interactive dashboards from their QuickBooks and other financial data.
Key Features
- Drag-and-drop interface
- Advanced calculations
- Interactive dashboards
- Statistical analysis tools
Pros
- Powerful visualization capabilities
- Extensive customization options
- Strong community support
- Regular feature updates
Cons
- Significant learning curve
- Higher cost structure
- Complex for basic users
- Resource-intensive
Pricing (As of October 2025)
- Creator: $75/user/month (full features)
- Explorer: $42/user/month (limited creation)
- Viewer: $15/user/month (view only)
- Enterprise: Custom pricing with advanced features
Support
- Standard: Online resources and email support
- Premium: 24/7 technical support (Enterprise plans)
- Advanced Management: Enhanced security and deployment options
4. Fathom – Financial Analysis Focus
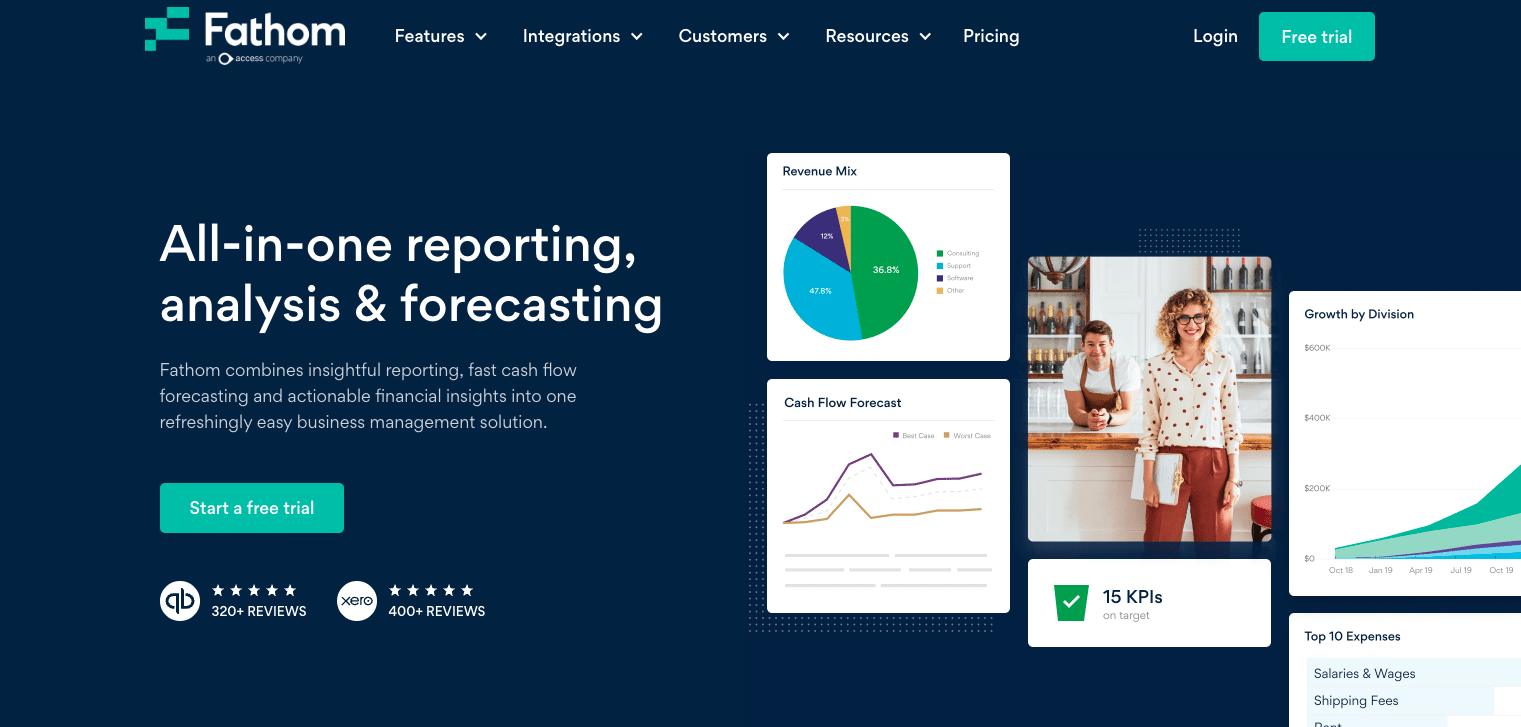
Fathom focuses specifically on financial analysis and reporting, making it a good fit for accountants and financial teams who need to create standardized reports from QuickBooks data.
Key Features
- Financial KPI tracking
- Automated reporting
- Benchmark comparisons
- Cash flow analysis
Pros
- QuickBooks-specific features
- Easy financial analysis
- Clear reporting templates
- Quick setup process
Cons
- Limited to QuickBooks data
- Basic visualization options
- Row limits on lower tiers
- Restricted customization
Pricing (As of October 2025)
- 1 Company: $50/month
- 10 Companies: $260/month
- 20 Companies: $380/month
- 50+ Companies: $680/month
Support
- All Plans: Email support and online resources
- Enterprise: Priority support with faster response times
- Custom onboarding available for larger clients
5. Spreadsheet Sync – Basic Integration
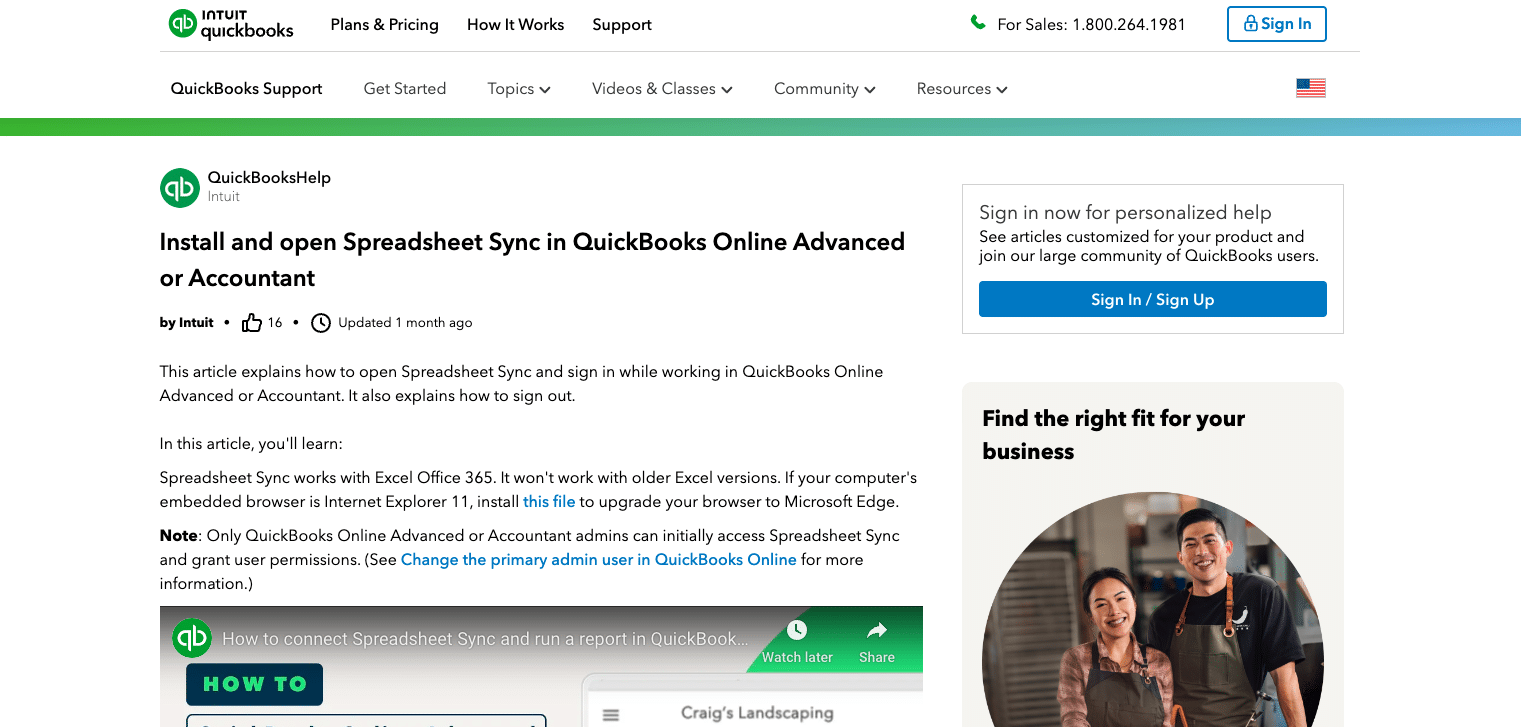
Spreadsheet Sync is QuickBooks’ native Excel integration tool, included with QuickBooks Online Advanced subscriptions. It’s best suited for basic data export needs.
Key Features
- Basic data sync
- Scheduled updates
- Template library
- Excel compatibility
Pros
- Low cost option
- Simple interface
- Quick setup
- Basic templates included
Cons
- Limited row capacity
- Basic security features
- Hourly refresh only
- No real-time updates
Pricing (As of October 2025)
- Included with QuickBooks Online Advanced: $235/month
- Currently 50% off first 3 months: $117.50/month
- No standalone pricing available
Support
- Dedicated support team available Monday-Friday, 6 AM-6 PM PT
- Access through QuickBooks Online help center
- Standard QuickBooks support channels
Make Better QuickBooks Reports Today
QuickBooks reporting tools enhance your financial analysis and decision-making. Each solution offers unique advantages, but Coefficient stands out for its real-time syncing and spreadsheet integration. Start building better reports today by trying Coefficient’s free plan. [Link to https://coefficient.io/get-started]
Further Reading
- Export QuickBooks Data to Google Sheets
- QuickBooks to Excel Integration
- QuickBooks Integrations for Google Sheets
- QuickBooks Integrations for Excel
Frequently Asked Questions
What reporting software works with QuickBooks?
While several tools work with QuickBooks, Coefficient offers direct integration with both Google Sheets and Excel, providing real-time data syncing and automated reporting capabilities.
Does QuickBooks have built-in reporting?
Yes, QuickBooks includes basic reporting features. However, tools like Coefficient extend these capabilities with real-time updates, custom visualizations, and automated distribution.
What is the most useful QuickBooks report?
The Profit & Loss statement is essential, but Coefficient allows you to customize and combine multiple reports for comprehensive business analysis.
What is QuickBooks Smart reporting?
QuickBooks Smart reporting provides basic analytics. Coefficient enhances these features with real-time data syncing and automated report distribution.


