Free QuickBooks Online Template for Revenue Dashboard
What is a Revenue Dashboard Report?
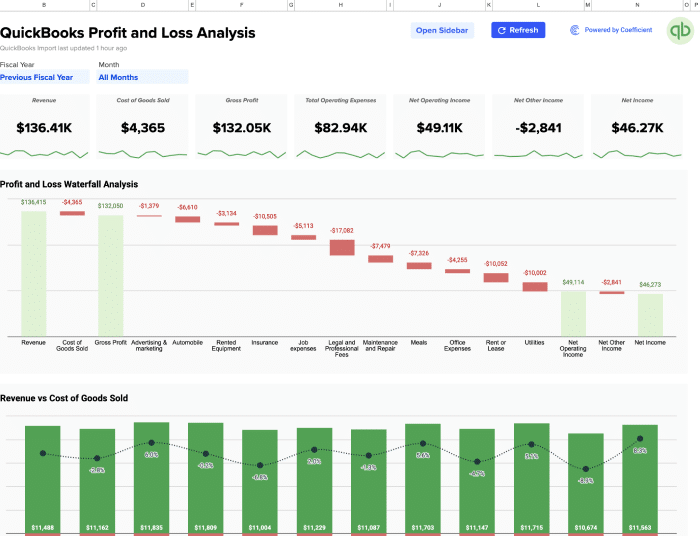
A revenue dashboard report is a powerful visual tool that provides a comprehensive overview of your company’s financial performance. It consolidates key revenue metrics and presents them in an easy-to-understand format, allowing business leaders to make data-driven decisions quickly. With Coefficient’s QuickBooks Online (QBO) Revenue Dashboard template, you can effortlessly track, analyze, and visualize your company’s financial health in real-time.
Benefits of using QuickBooks Online Revenue Dashboard Template
- Real-time data synchronization: Our template connects directly to your QuickBooks Online account, ensuring that your revenue dashboard always reflects the most up-to-date financial information.
- Comprehensive financial overview: Gain instant insights into your company’s financial health with a wide range of key performance indicators (KPIs) displayed in one centralized dashboard.
- Time-saving automation: Eliminate manual data entry and reduce the risk of errors by automating your revenue reporting process.
- Customizable visualizations: Tailor the dashboard to your specific needs with easy-to-use charts, graphs, and tables that make complex financial data easy to understand at a glance.
- Improved decision-making: With access to real-time revenue data, you can make informed business decisions faster and more confidently.
Metrics Tracked in the Report
Our QuickBooks Online Revenue Dashboard template tracks the following essential metrics:
- Annual Recurring Revenue (ARR)
- Annual Run Rate Revenue (ARRR)
- Average Revenue Per User (ARPU)
- Average Contract Value (ACV)
- Bookings
- Customer Acquisition Cost (CAC)
- Total Contract Value
- Churn
- Customer Lifetime Value (LTV, CLTV, or CLV)
- Customer Retention Rate
- Monthly Recurring Revenue (MRR)
- MRR Churn
- Customer Renewal Rate
- Revenue Backlog
- Revenue Churn
More Metrics to Track and Analyze on Google Sheets
With Coefficient’s QuickBooks integration, you can pull additional financial data into your Google Sheets, such as:
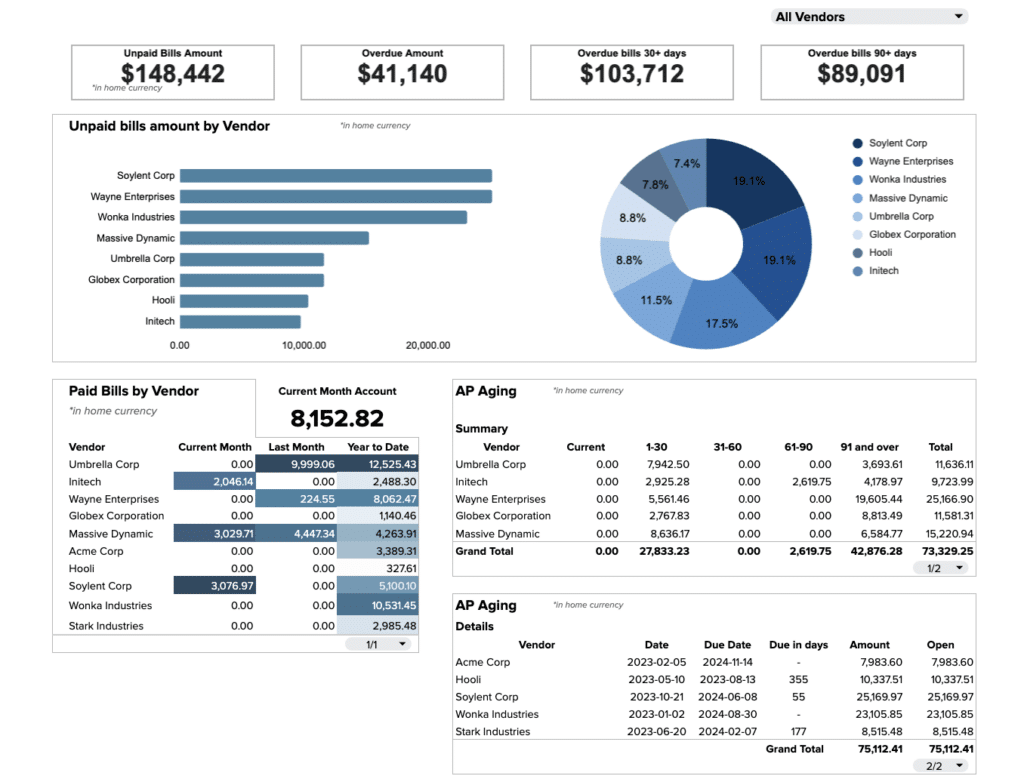
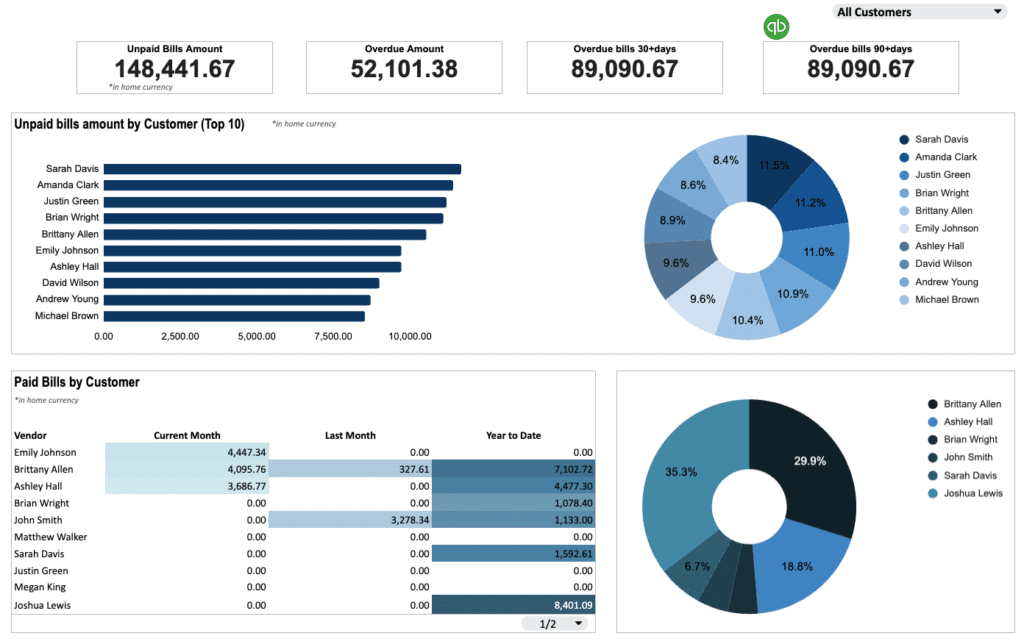
- Transaction lists by customer, vendor, or date
- Balance sheet details
- Cash flow statements
- Profit and loss reports
These metrics provide a comprehensive view of your financial performance, allowing for deeper analysis and more informed decision-making.
Try our free QuickBooks Online Revenue Dashboard template today and transform the way you monitor and analyze your company’s financial performance.