Looking for the most useful QuickBooks Online reports? This guide showcases seven essential dashboards that provide clear insights into your financial data, helping you make informed decisions and drive business growth in 2025.
#1 Cash Runway Template

Get the QuickBooks Cash Flow Projections Template
The Cash Runway Template helps you forecast how long your current cash reserves will sustain your business operations. This tool is crucial for startups and growing businesses to manage their burn rate and plan for future funding needs.
Use Case: Cash Flow Management and Forecasting
- Burn Rate Analysis: Calculate your monthly cash burn to understand your financial sustainability.
- Funding Planning: Determine when you’ll need to secure additional funding or reach profitability.
- Scenario Planning: Create multiple scenarios to prepare for different financial outcomes.
Metrics Tracked
- Gross profit (cash)
- Open invoices by customer
- Open invoices amount by customer
- Overdue invoices by customer
- Overdue invoices amount by customer
- Total expenses (cash) by category
- Paid invoices amount
- Paid invoices
- Income (cash) by category
#2 Quickbooks Profit and Loss Dashboard

Access the QuickBooks Profit and Loss Dashboard
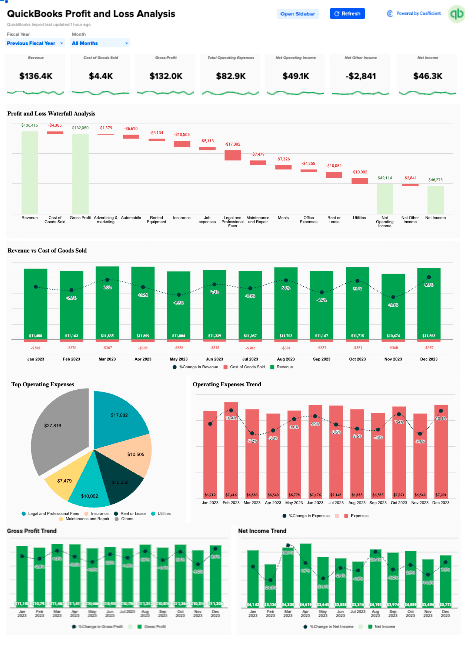
The QuickBooks Profit and Loss Template provides a comprehensive view of your company’s financial performance. It consolidates key financial data from your QuickBooks account into an easy-to-read format, allowing you to quickly assess your business’s profitability and identify areas for improvement.
Use Case: Financial Performance Analysis
- Revenue Tracking: Monitor your income streams and identify trends over time.
- Expense Management: Analyze your costs and pinpoint areas for potential savings.
- Profitability Assessment: Quickly determine your bottom line and track progress towards financial goals.
Metrics Tracked
- Total revenue
- Cost of goods sold (COGS)
- Gross profit
- Total operating expenses
- Net operating income
- Net other income
- Net income
#3 SaaS P&L Template

Get the SaaS P&L Template here
The SaaS P&L Template is specifically designed for Software as a Service businesses. It provides a detailed breakdown of revenue and expenses unique to the SaaS model, helping you understand your company’s financial health in the context of subscription-based services.
Use Case: SaaS Financial Analysis
- Subscription Revenue Tracking: Monitor MRR, ARR, and other SaaS-specific revenue metrics.
- Customer Acquisition Cost (CAC) Analysis: Understand the cost of acquiring new customers.
- Churn and Retention Insights: Track customer churn rates and their impact on revenue.
Metrics Tracked
- Monthly Recurring Revenue (MRR)
- Annual Recurring Revenue (ARR)
- Customer Acquisition Cost (CAC)
- Customer Lifetime Value (CLV)
- Churn Rate
- Net Revenue Retention
#4 QuickBooks Accounts Payable Template

Download the QuickBooks AP dashboard here
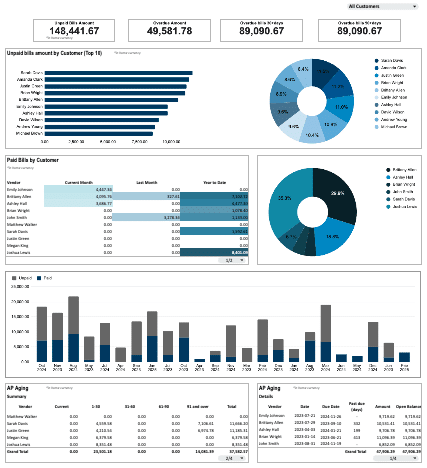
The QBO Accounts Payable Dashboard provides a comprehensive view of your outstanding bills and payment obligations. It helps you manage vendor relationships and optimize your cash flow by tracking when payments are due.
Use Case: Vendor Payment Management
- Payment Scheduling: Visualize upcoming payment due dates to plan cash outflows.
- Vendor Analysis: Identify top vendors by spend and negotiate better terms.
- Cash Flow Optimization: Manage payment timing to balance cash reserves and vendor relationships.
Metrics Tracked
- Total accounts payable
- Aging of payables
- Upcoming payment due dates
- Vendor-wise outstanding amounts
- Historical payment trends
#5 QuickBooks Accounts Receivable Dashboard

Get Started with the QuickBooks Accounts Receivable Dashboard
The QuickBooks Accounts Receivable Dashboard helps you track and manage customer payments. It provides a clear view of outstanding invoices, categorized by age, helping you identify late payments and take proactive measures to improve cash flow.
Use Case: Customer Payment Tracking
This dashboard helps you maintain healthy cash flow by monitoring customer payments:
- Track outstanding invoices and identify late-paying customers
- Anticipate incoming payments to better manage your business’s financial needs
- Identify patterns in customer payment behavior to inform credit decisions and collection strategies
Metrics Tracked
- Total accounts receivable
- Aging of receivables
- Customer-wise outstanding amounts
- Average days to pay
- Collection effectiveness ratio
#6 QuickBooks Inventory Management Dashboard

Optimize Your Inventory with the QuickBooks Inventory Management Dashboard
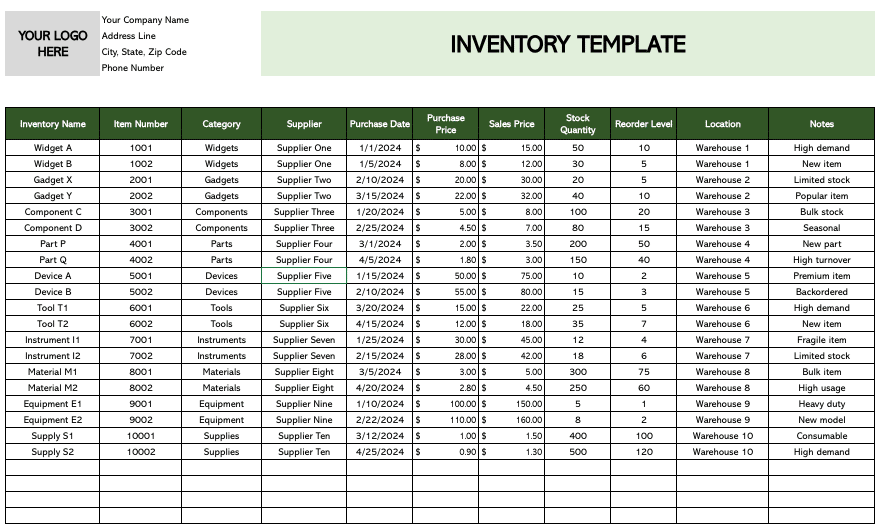
The QuickBooks Inventory Management Dashboard is essential for businesses that deal with physical products. It provides real-time insights into your inventory levels, helping you optimize stock levels, reduce carrying costs, and prevent stockouts.
Use Case: Inventory Optimization
This dashboard helps businesses track and optimize their stock levels:
- Keep track of current inventory levels across all products
- Set up notifications for when stock reaches reorder points
- Analyze sales patterns to inform purchasing decisions
Metrics Tracked
- Current stock levels
- Reorder points
- Stock turnover rate
- Days of inventory on hand
- Top selling products
#7 QuickBooks Online Revenue Dashboard

Track your revenue with this free template
The QBO Revenue Dashboard provides a comprehensive view of your company’s income streams. It helps you track and analyze various revenue sources, identifying trends and opportunities for growth.
Use Case: Revenue Analysis and Forecasting
- Revenue Stream Analysis: Break down revenue by product, service, or customer segment.
- Trend Identification: Spot seasonal patterns or growth trends in your revenue data.
- Performance Tracking: Compare current revenue against targets or previous periods.
Metrics Tracked
- Total revenue
- Revenue by product/service
- Revenue by customer segment
- Month-over-month and year-over-year growth rates
- Average transaction value
#8 – QuickBooks Cashflow Template

Get a copy of our cashflow template here.
The QuickBooks Cashflow Template tracks the movement of cash in and out of your business. It categorizes cash flows into operating, investing, and financing activities, providing a clear picture of your company’s liquidity and financial health.
Use Case: Cash Flow Management
- Liquidity Analysis: Understand your business’s ability to meet short-term obligations.
- Investment Decision Making: Evaluate the impact of potential investments on your cash position.
- Financial Planning: Use cash flow trends to inform budgeting and financial strategy.
Metrics Tracked
- Net cash flow from operating activities
- Net cash flow from investing activities
- Net cash flow from financing activities
- Free cash flow
- Cash conversion cycle
Free QuickBooks Online Reports
These seven QuickBooks Online reports offer valuable insights into various aspects of your business’s financial health, from cash flow projections to inventory management and financial ratio analysis. By using these dashboards, you’ll be better equipped to make data-driven decisions and keep your business on the path to financial success in 2025 and beyond. Start using these QuickBooks Online reports today to transform your financial reporting and decision-making processes.
Explore All QuickBooks Connector Dashboards


