Building Salesforce dashboards with Claude: where it breaks at scale
Claude with the Salesforce MCP feels like magic for a single query. It falls apart the moment you need cross-object reporting that refreshes.

The short version
Claude with the Salesforce MCP can answer a single-object question well. It breaks on real dashboards because Salesforce reporting needs cross-object joins, thousands of records, scheduled refresh, and sharing, none of which a context window does reliably. A direct Salesforce connector pulls the full data and the AI builds on top of it.
The demo that works
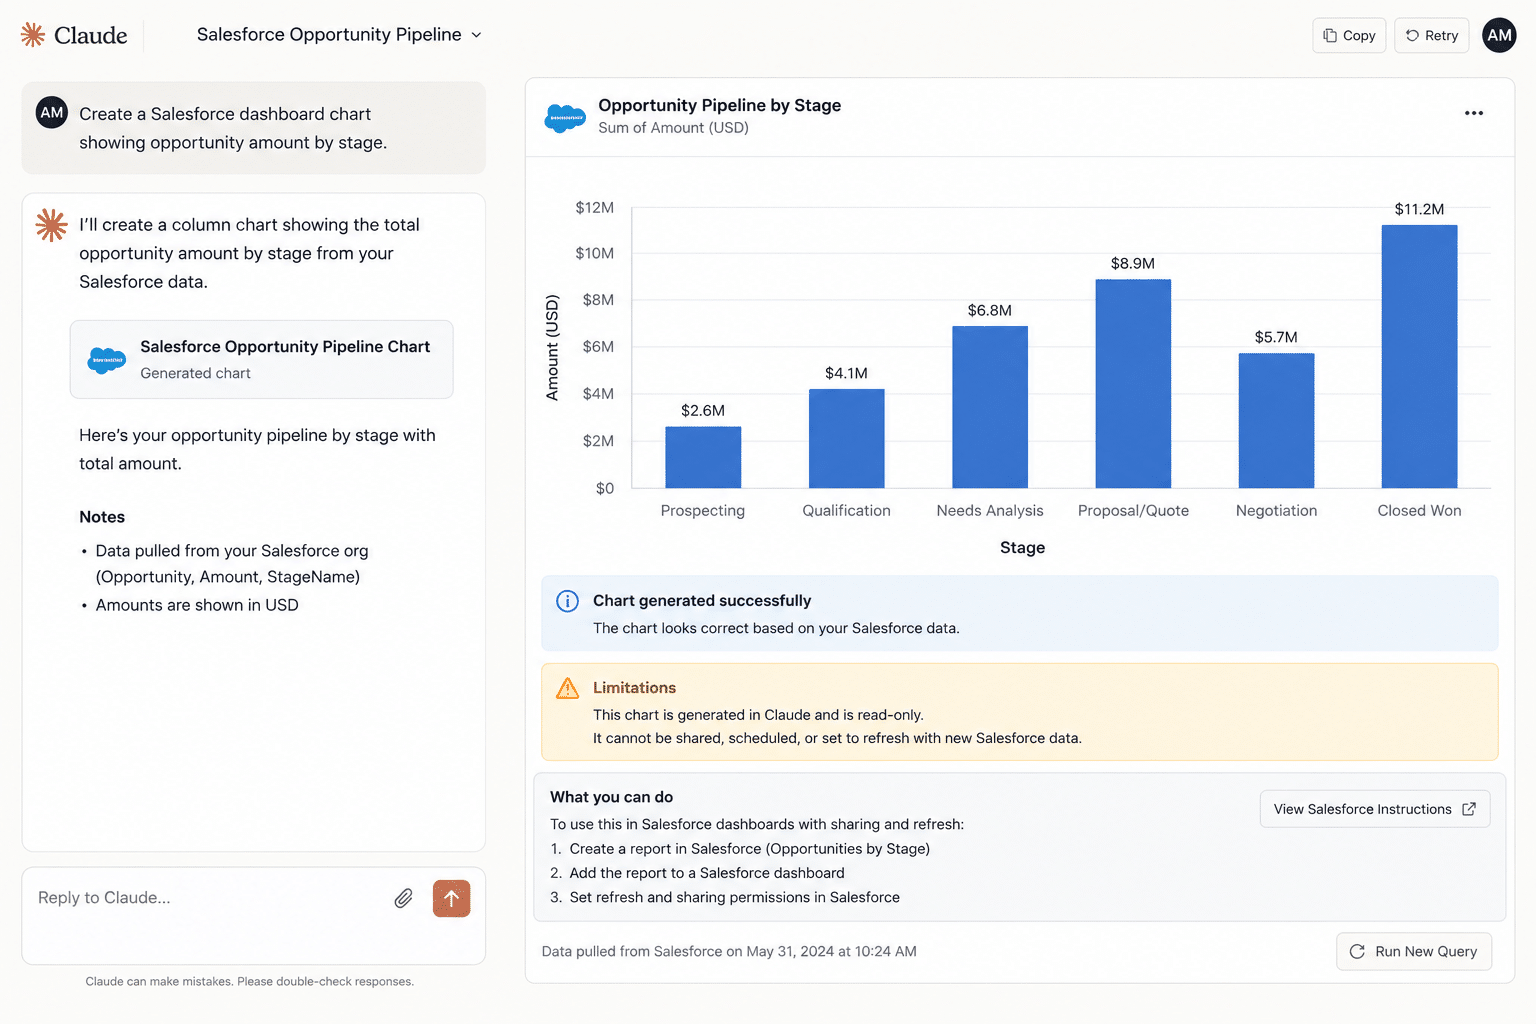
Ask Claude, connected through the Salesforce MCP, for a quick view of opportunities by stage, and it delivers. For a single object and a few hundred records, it is genuinely useful and very fast.
So you ask for the real dashboard. Pipeline by rep, by segment, by quarter, joined to accounts and activities, refreshed every morning. That is a different kind of request, and it is where the demo stops scaling.
The reports where it stops scaling
The single-object demo is easy. Real Salesforce reporting is not, because it spans objects, rows, and time. These are the views teams hit the wall on:
- Pipeline by rep and segment: opportunities joined to owners and accounts, grouped and summed.
- Weighted forecast by quarter: probability-adjusted value across the full pipeline, not a sample.
- Stage conversion and velocity: how deals move, which needs opportunity history over months.
- Activity to outcome: calls, emails, and meetings joined to the deals they influenced.
- Account health: open pipeline, closed revenue, and activity rolled up per account.
Where it breaks
A Salesforce dashboard is not one query. It is opportunities joined to accounts, owners, and activities, filtered and rolled up, then kept current. The MCP path struggles with every part of that at once.
- Record limits: pulling thousands of rows means paginating through many capped calls, where records get dropped or time out.
- Cross-object joins: real reporting spans objects, and stitching them together through a context window is fragile.
- Refresh and sharing: the result is a snapshot the model made once, with no schedule and no clean way to share it with people who lack a Salesforce seat.
- Maintenance: if it was vibe-coded into an app, a non-coder now owns a 2,000-line project with no tests or architecture.
What breaks, step by step: a worked example
Say Priya, a sales ops manager, asks Claude for a pipeline-by-rep dashboard joined to accounts and activity. Here is where it comes apart:
- The opportunity pull paginates. Thousands of open deals exceed the per-call cap, so Claude makes call after call, and one times out without flagging it.
- The join gets fragile. Stitching opportunities to accounts and activities inside the context window means rows that do not line up are dropped or mismatched.
- The totals come back off. A few reps look light, but nothing shows the gap, and the number is plausible enough to ship.
- It will not refresh. What you have is a snapshot the model built once. Tomorrow it is stale, and the only refresh is to run the whole thing again.
- It will not share. Leadership without a Salesforce seat cannot open it, so it gets exported to a static file that is wrong by the next morning.
Any one of these is fixable. All five at once, through a context window, is the wall.
Does it get worse at scale?
It compounds. More reps, more objects, and more history multiply both the record count and the joins, so the failure points multiply with them. It is the same cycle the rest of the series traces from tool to tool: see the full Claude Boomerang pattern.
Each is solvable on its own. Together, in one context window, they are the wall.
| A live Salesforce pipeline dashboard | Claude + Salesforce MCP | Coefficient |
|---|---|---|
| Records | Capped per call, must paginate | Full objects via direct API |
| Cross-object joins | Fragile through context | Modeled once, repeatable |
| Refresh | Manual, snapshot only | Scheduled, hourly to monthly |
| Numbers | Can vary between runs | SOQL and SQL grounded, clickable to source |
How to build it anyway
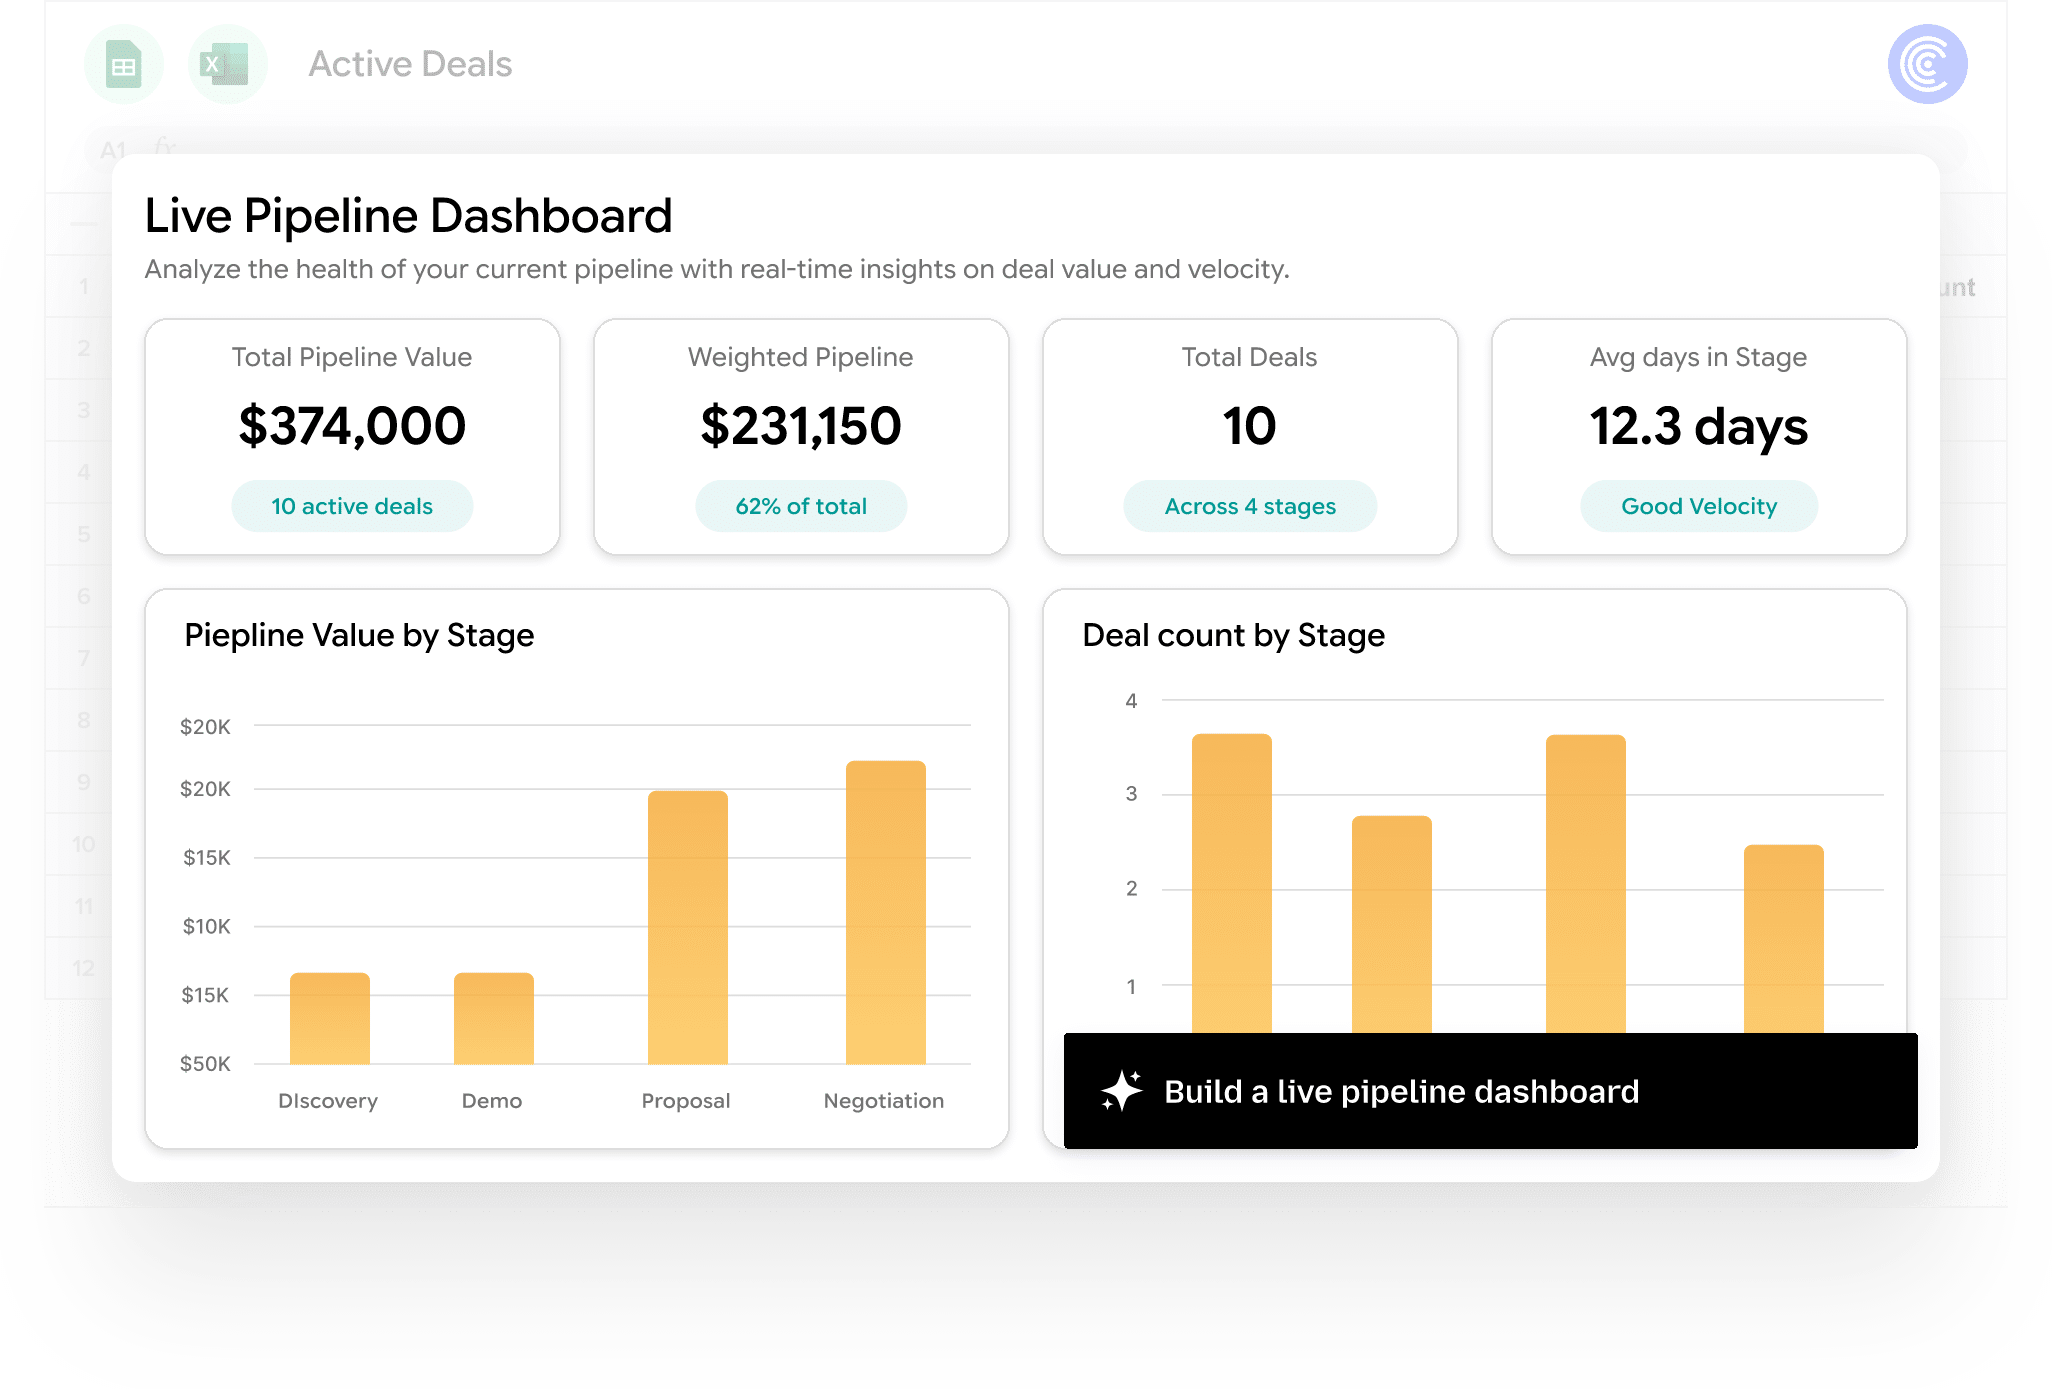
Pull Salesforce through a direct connector, not the model. The full objects land in your spreadsheet, joins are modeled once, and the data refreshes on a schedule. Coefficient AI Dashboards plan and build the view on top of complete, grounded data, and every metric clicks back to its source.
Same demo, except it holds the whole pipeline, refreshes itself, and is safe to share with leadership who will never log into Salesforce.
When the Salesforce MCP is still useful
For a quick lookup or a single-record update, the MCP is fine and fast. The break only happens when you need full, joined, refreshing reporting.
Related reading: the full Claude Boomerang pattern and the HubSpot MCP record wall.
Common questions about Salesforce dashboards in Claude
Can Claude build a Salesforce dashboard?
Why does my Claude Salesforce dashboard not refresh?
What are the limits of the Salesforce MCP for reporting?
How do I build a reliable Salesforce dashboard?
What is the Salesforce MCP?
Can Claude do cross-object Salesforce reporting?
How do I pull Salesforce data into Google Sheets?
Build a Salesforce dashboard you can trust
Pull the full pipeline through a direct connection, trust every number back to the source, and share a live dashboard with leadership, no Salesforce seat required.
Start Building for Free