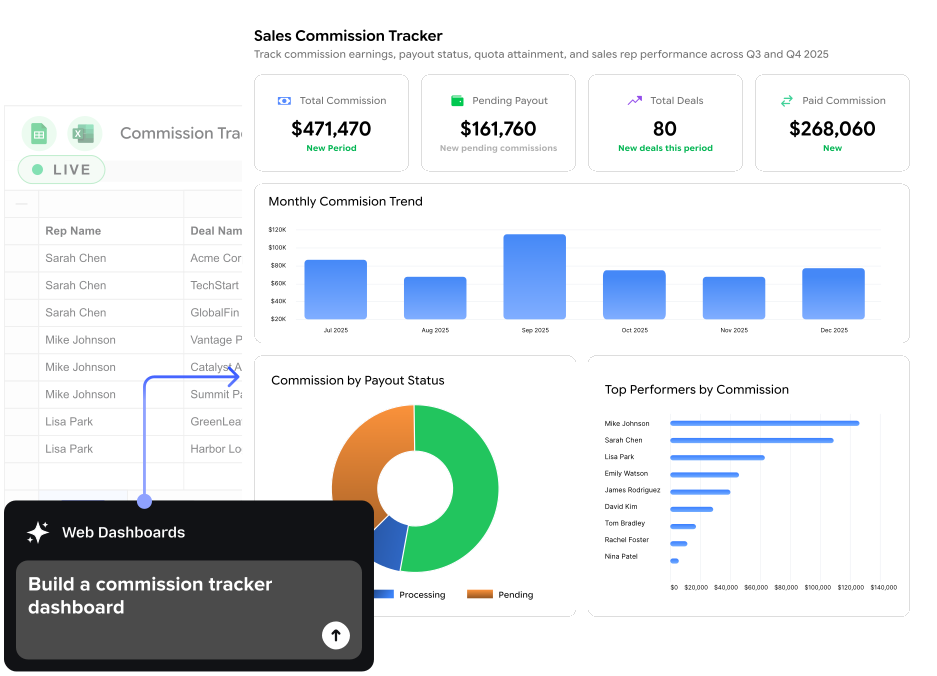
BI Quality Dashboard Software without Legacy BI Complexity
Connect 150+ systems to Sheets or Excel. Publish live dashboards. No data model.
Join 700,000 builders

How Coefficient differs from legacy BI tools & native reporting tools
Three things block a dashboard. BI tools want a data model. Native reporting shows one system. An LLM draws the chart and forgets it. Most teams do not need a semantic layer. They need live numbers everyone can see.
| Coefficient | Legacy BI tools | Native reporting tools | LLMs (Claude, ChatGPT) | |
|---|---|---|---|---|
| What you need to start | A spreadsheet | A modelled dataset | A saved report | A file or pasted data |
| Who builds it | Whoever owns the numbers | A data analyst | Whoever owns the numbers | Whoever owns the numbers |
| Data across systems | 150+ sources in one view | Yes, after modelling | One system only | Only what you upload |
| Where the logic lives | Google Sheets or Excel | A semantic layer you maintain | The source system | Not retained |
| Refresh | Automatic, on your schedule | Scheduled | Manual re-run | Re-prompt every time |
| Viewer cost | Free | Per user, per month | A paid seat in the source system | Not shareable as a live dashboard |
One view
1. Connect every system you report on
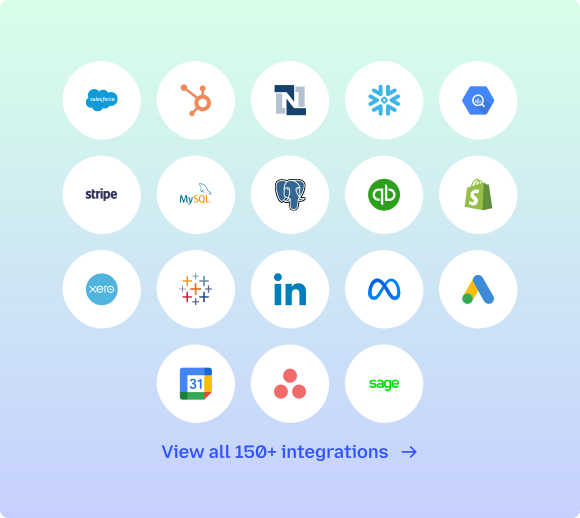
- 150+ data sources. Salesforce, HubSpot, NetSuite, Snowflake, Google Analytics, Google Ads
- Blend CRM pipeline with finance actuals in one sheet
- No connector yet? Build one with AI on any REST API
"We have been able to build two critical sets of dashboards pulling in data from both HubSpot and QBO, and we are constantly so thrilled and impressed by how easily Coefficient just works."
No analyst required
2. Build it yourself, in plain English
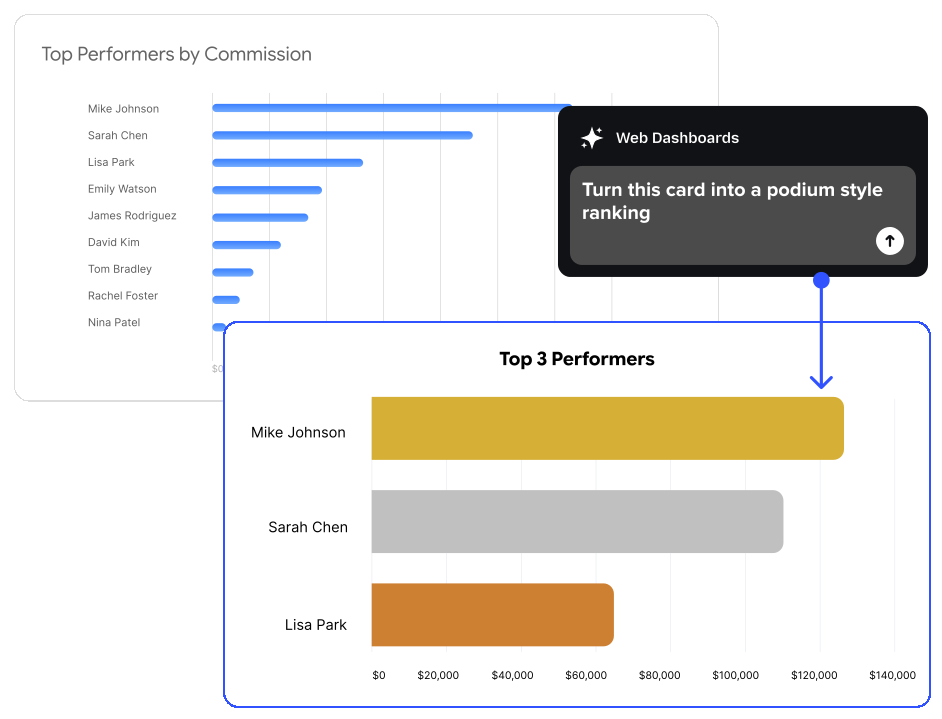
- Describe it. Coefficient AI Dashboards builds the charts and the layout
- Edit by typing, not by configuring panels
- Formulas stay formulas. Your model keeps working
"Eliminates repeat work for tech folks and ensures non-tech folks can use data."
Everyone sees it
3. Share a URL, not a licence

- Viewers open it in a browser. No account, no seat to buy
- Alerts to Slack, Teams or email when numbers move
- Scope each dashboard to the rows people should see
"Coefficient gives me peace of mind. It allows us to confidently report across the org from BizOps to Finance, Revenue, and our C-Suite."
What your data team will ask
One connection, not fifty.
Connect NetSuite or your data warehouse once, then share it. No credentials passed around.
Row-level access.
Scope each dashboard so viewers see only their records.
SOC 2 and SSO.
Encrypted in transit and at rest. Sign in with Google or Microsoft.
Full audit trail.
Every import, export and refresh is logged.
Common questions about dashboard software
Dashboard software turns data from your business systems into charts and metrics on one screen that updates on its own. Unlike a static report, a dashboard stays current. Most tools connect to data sources such as a CRM, an ad platform or a database, then handle the data visualization for whichever metrics you choose to track.

Build your first dashboard in 5 minutes.
No credit card required.