Top 8 QuickBooks Online Reports in 2025

Looking for the most useful QuickBooks Online reports? This guide showcases seven essential dashboards that provide clear insights into your financial data, helping you make informed decisions and drive business growth in 2025.

#1 Cash Runway Template

Cash Runway Template

Get the QuickBooks Cash Flow Projections Template

The Cash Runway Template helps you forecast how long your current cash reserves will sustain your business operations. This tool is crucial for startups and growing businesses to manage their burn rate and plan for future funding needs.

Use Case: Cash Flow Management and Forecasting

  • Burn Rate Analysis: Calculate your monthly cash burn to understand your financial sustainability.
  • Funding Planning: Determine when you’ll need to secure additional funding or reach profitability.
  • Scenario Planning: Create multiple scenarios to prepare for different financial outcomes.

Metrics Tracked

  • Gross profit (cash)
  • Open invoices by customer
  • Open invoices amount by customer
  • Overdue invoices by customer
  • Overdue invoices amount by customer
  • Total expenses (cash) by category
  • Paid invoices amount
  • Paid invoices
  • Income (cash) by category

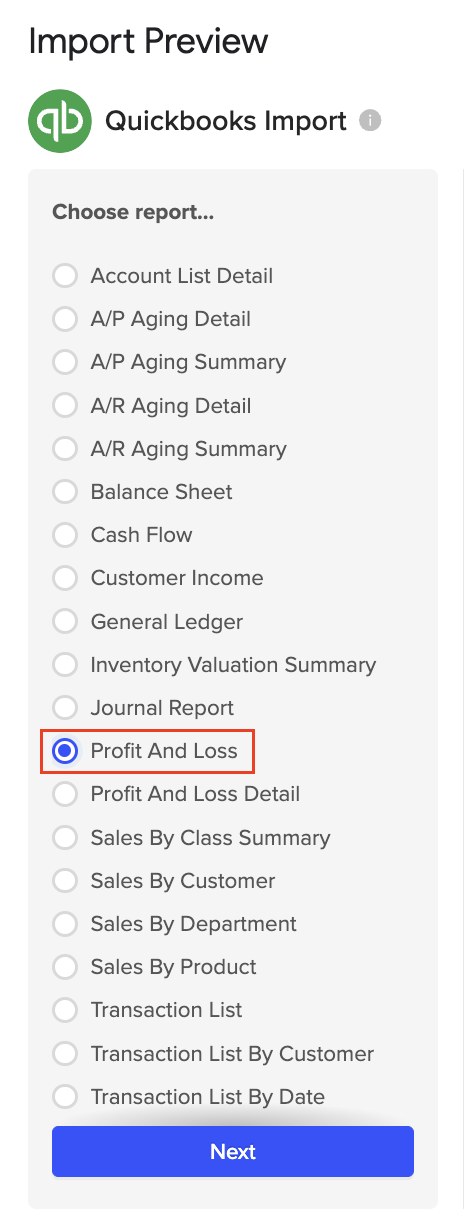
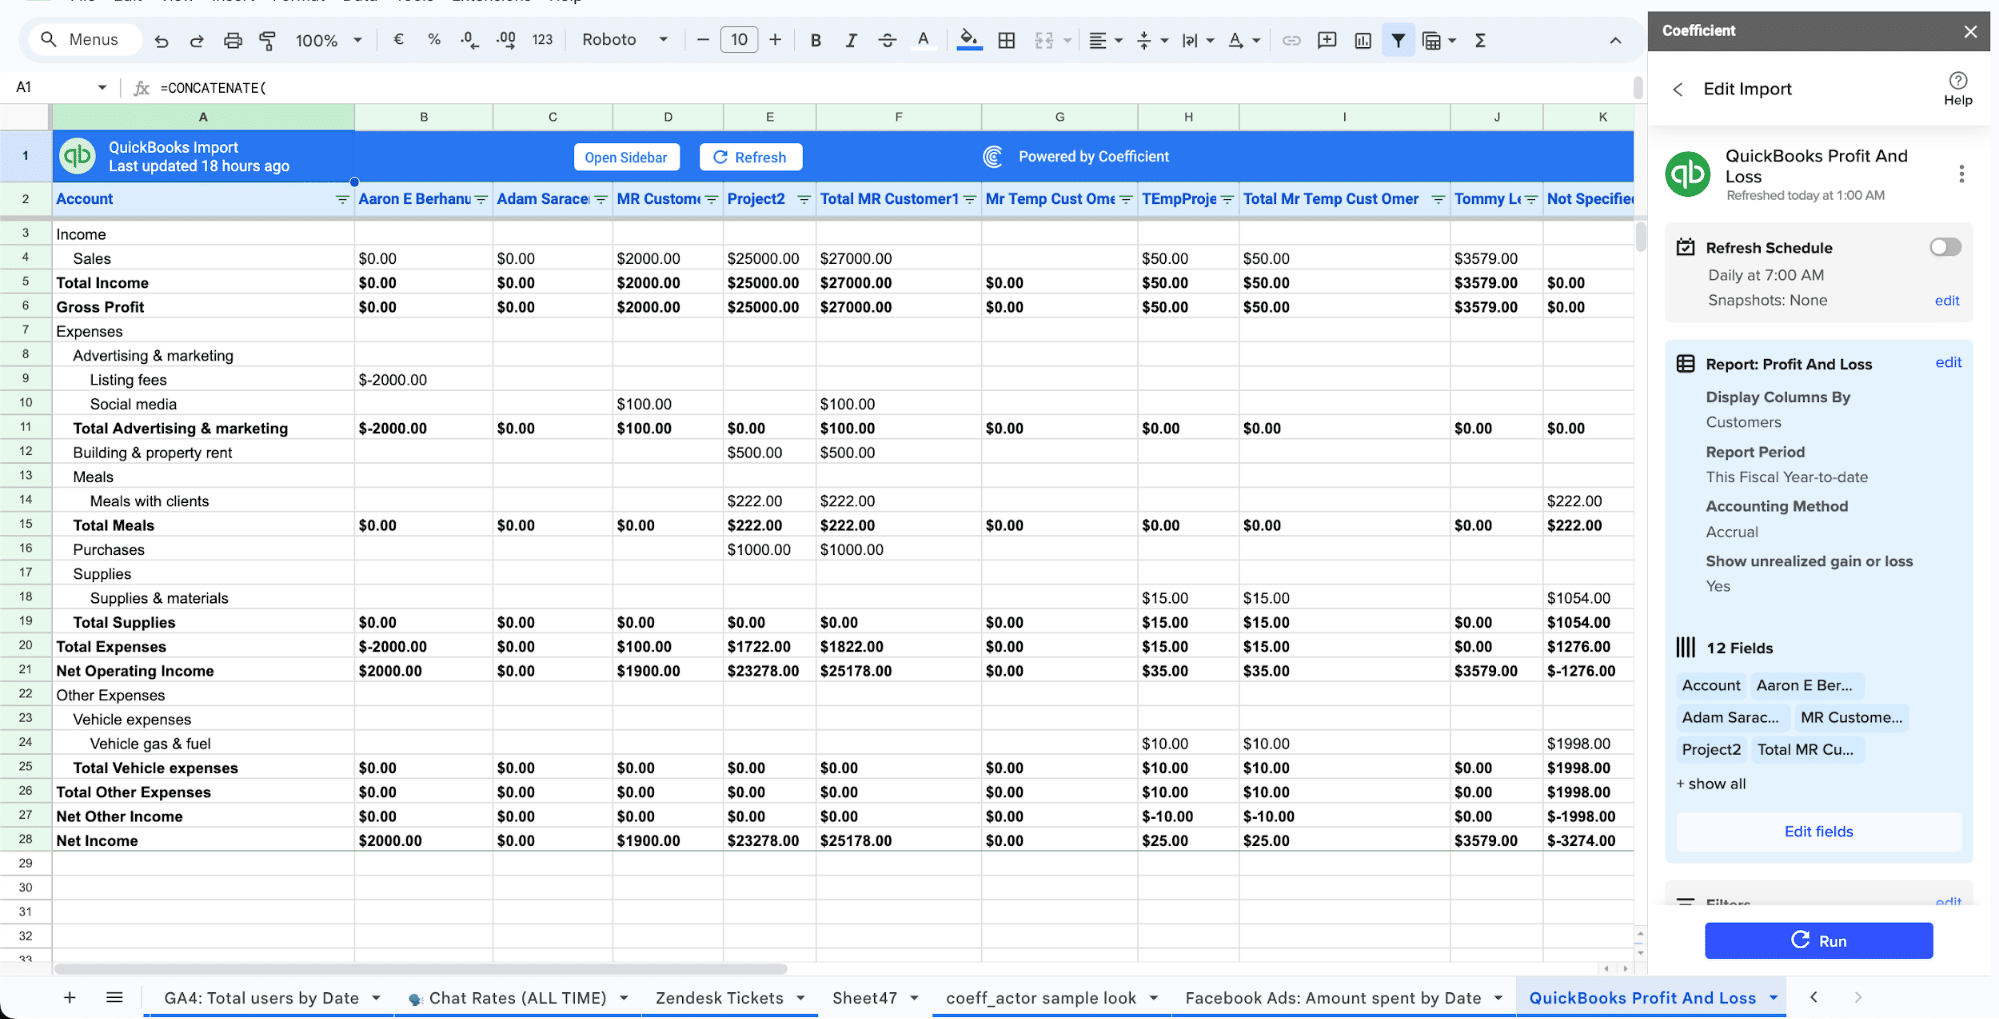
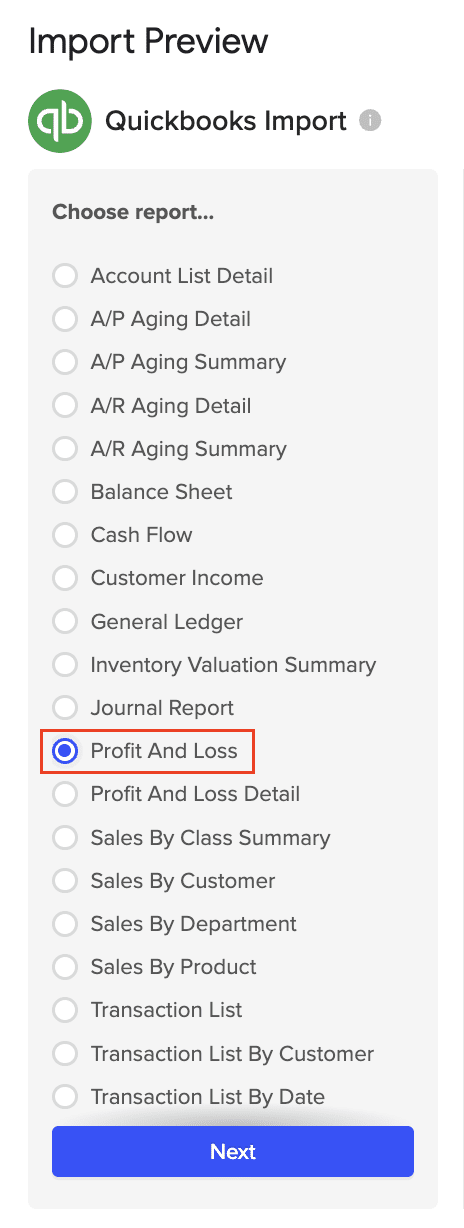
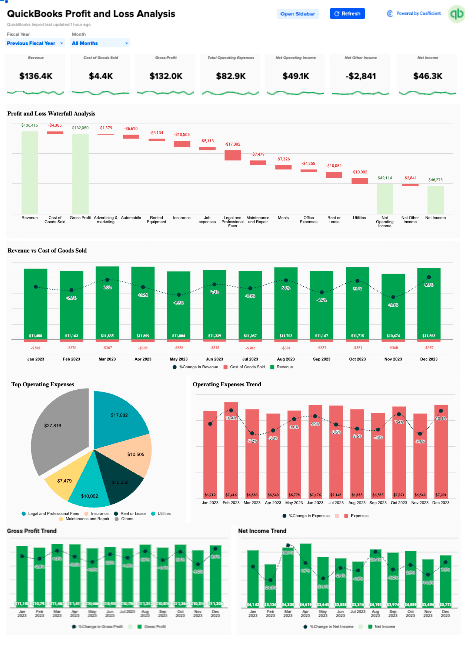
#2 Quickbooks Profit and Loss Dashboard

Quickbooks Profit and Loss Dashboard

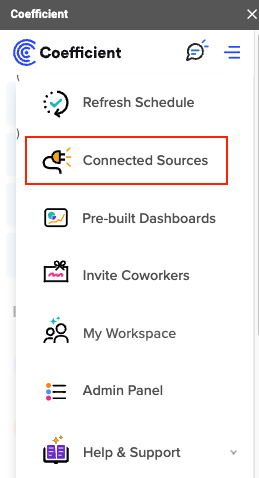
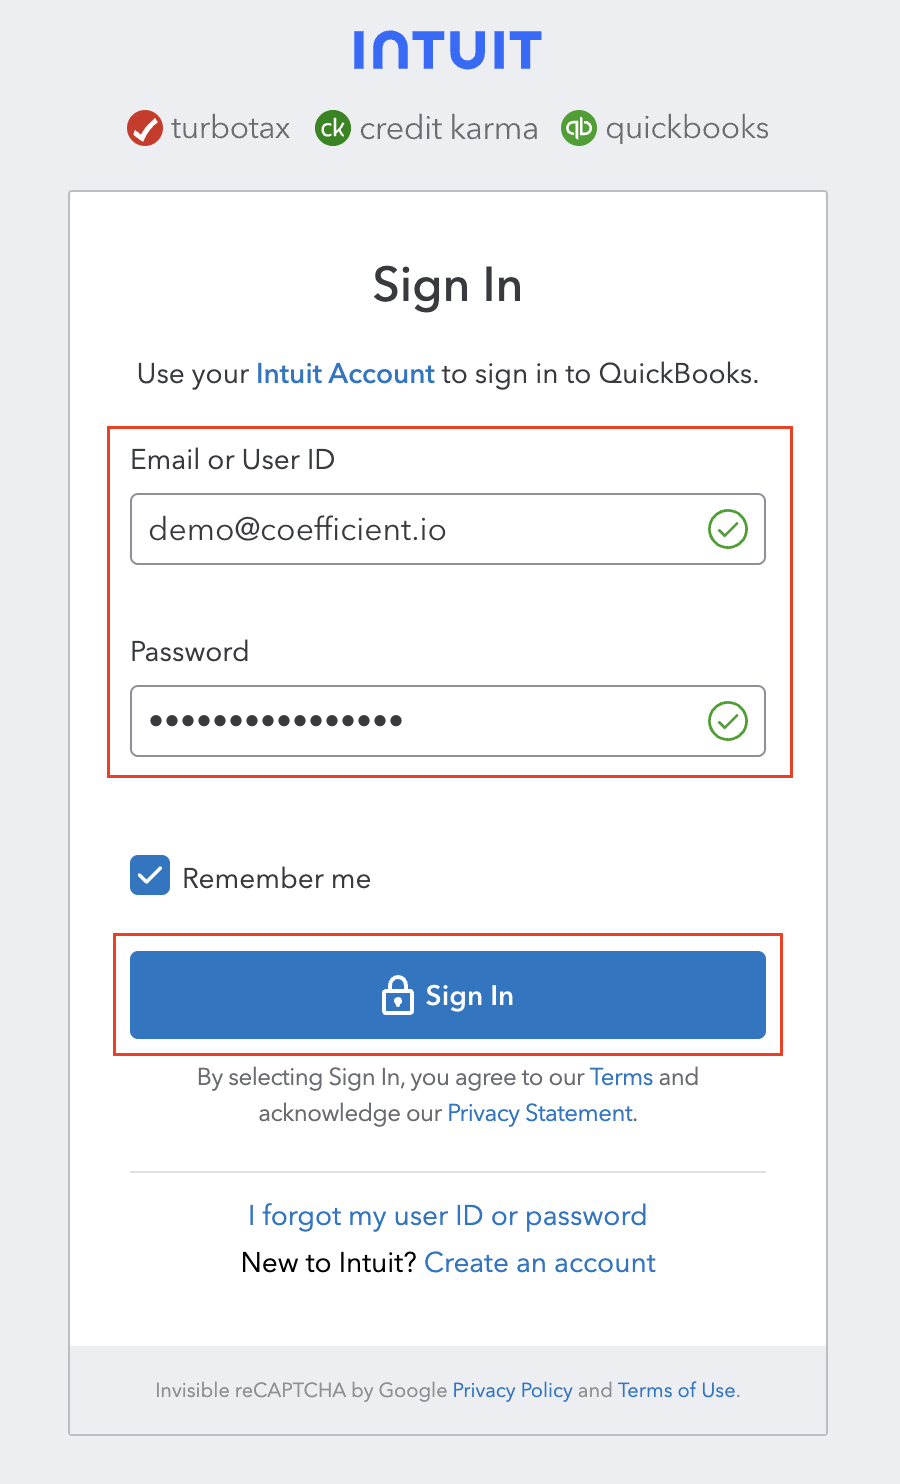
Access the QuickBooks Profit and Loss Dashboard

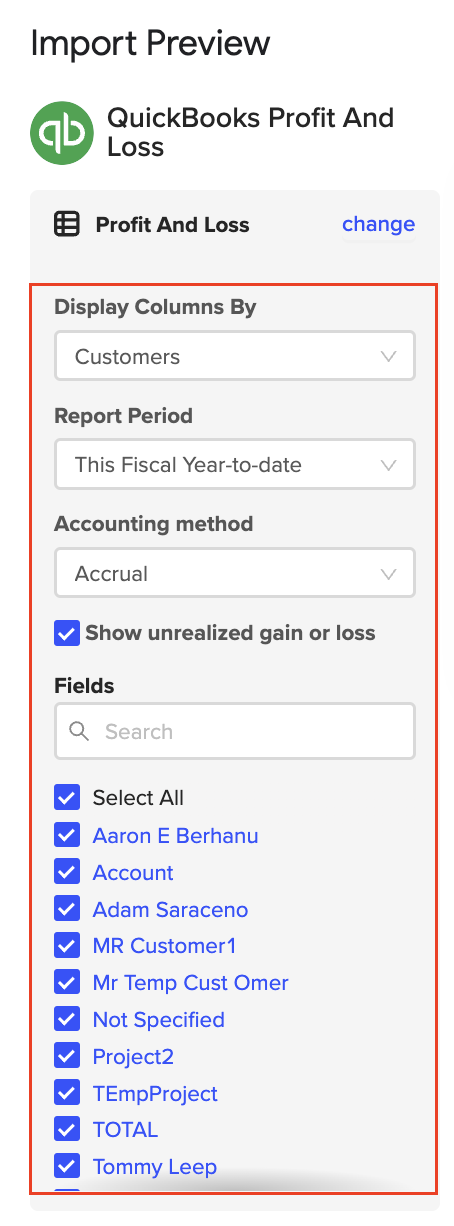
The QuickBooks Profit and Loss Template provides a comprehensive view of your company’s financial performance. It consolidates key financial data from your QuickBooks account into an easy-to-read format, allowing you to quickly assess your business’s profitability and identify areas for improvement.

Use Case: Financial Performance Analysis

  • Revenue Tracking: Monitor your income streams and identify trends over time.
  • Expense Management: Analyze your costs and pinpoint areas for potential savings.
  • Profitability Assessment: Quickly determine your bottom line and track progress towards financial goals.

Metrics Tracked

  • Total revenue
  • Cost of goods sold (COGS)
  • Gross profit
  • Total operating expenses
  • Net operating income
  • Net other income
  • Net income

#3 SaaS P&L Template

SaaS P&L Template

Get the SaaS P&L Template here

The SaaS P&L Template is specifically designed for Software as a Service businesses. It provides a detailed breakdown of revenue and expenses unique to the SaaS model, helping you understand your company’s financial health in the context of subscription-based services.

Use Case: SaaS Financial Analysis

  • Subscription Revenue Tracking: Monitor MRR, ARR, and other SaaS-specific revenue metrics.
  • Customer Acquisition Cost (CAC) Analysis: Understand the cost of acquiring new customers.
  • Churn and Retention Insights: Track customer churn rates and their impact on revenue.

Metrics Tracked

  • Monthly Recurring Revenue (MRR)
  • Annual Recurring Revenue (ARR)
  • Customer Acquisition Cost (CAC)
  • Customer Lifetime Value (CLV)
  • Churn Rate
  • Net Revenue Retention

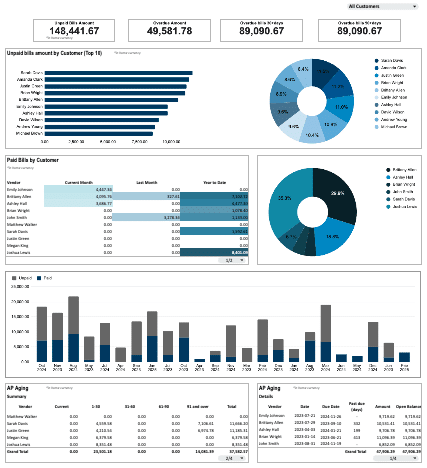
#4 QuickBooks Accounts Payable Template

QuickBooks Accounts Payable Template

Download the QuickBooks AP dashboard here

The QBO Accounts Payable Dashboard provides a comprehensive view of your outstanding bills and payment obligations. It helps you manage vendor relationships and optimize your cash flow by tracking when payments are due.

Use Case: Vendor Payment Management

  • Payment Scheduling: Visualize upcoming payment due dates to plan cash outflows.
  • Vendor Analysis: Identify top vendors by spend and negotiate better terms.
  • Cash Flow Optimization: Manage payment timing to balance cash reserves and vendor relationships.

Metrics Tracked

  • Total accounts payable
  • Aging of payables
  • Upcoming payment due dates
  • Vendor-wise outstanding amounts
  • Historical payment trends

#5 QuickBooks Accounts Receivable Dashboard

QuickBooks Accounts Receivable Dashboard

Get Started with the QuickBooks Accounts Receivable Dashboard

The QuickBooks Accounts Receivable Dashboard helps you track and manage customer payments. It provides a clear view of outstanding invoices, categorized by age, helping you identify late payments and take proactive measures to improve cash flow.

Use Case: Customer Payment Tracking

This dashboard helps you maintain healthy cash flow by monitoring customer payments:

  • Track outstanding invoices and identify late-paying customers
  • Anticipate incoming payments to better manage your business’s financial needs
  • Identify patterns in customer payment behavior to inform credit decisions and collection strategies

Metrics Tracked

  • Total accounts receivable
  • Aging of receivables
  • Customer-wise outstanding amounts
  • Average days to pay
  • Collection effectiveness ratio

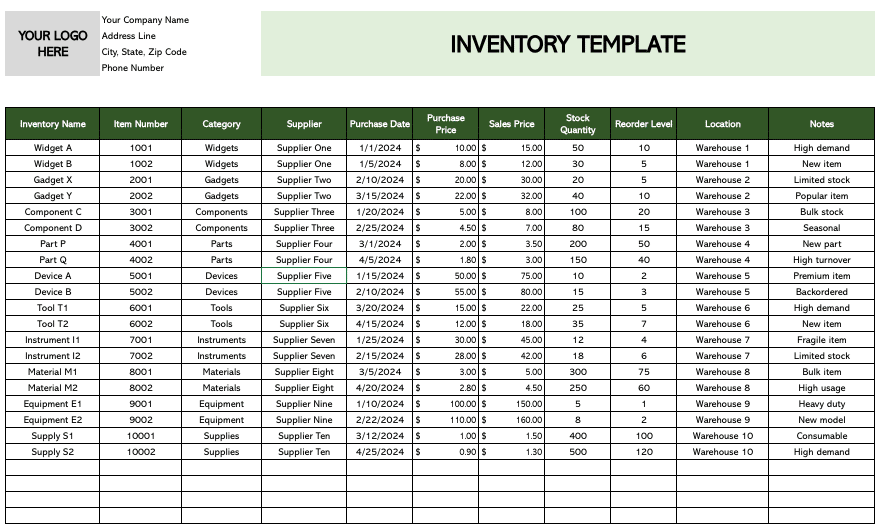
#6 QuickBooks Inventory Management Dashboard

QuickBooks Inventory Management Dashboard

Optimize Your Inventory with the QuickBooks Inventory Management Dashboard

The QuickBooks Inventory Management Dashboard is essential for businesses that deal with physical products. It provides real-time insights into your inventory levels, helping you optimize stock levels, reduce carrying costs, and prevent stockouts.

Use Case: Inventory Optimization

This dashboard helps businesses track and optimize their stock levels:

  • Keep track of current inventory levels across all products
  • Set up notifications for when stock reaches reorder points
  • Analyze sales patterns to inform purchasing decisions

Metrics Tracked

  • Current stock levels
  • Reorder points
  • Stock turnover rate
  • Days of inventory on hand
  • Top selling products

#7 QuickBooks Online Revenue Dashboard

QuickBooks Online Revenue Dashboard

Track your revenue with this free template

The QBO Revenue Dashboard provides a comprehensive view of your company’s income streams. It helps you track and analyze various revenue sources, identifying trends and opportunities for growth.

Use Case: Revenue Analysis and Forecasting

  • Revenue Stream Analysis: Break down revenue by product, service, or customer segment.
  • Trend Identification: Spot seasonal patterns or growth trends in your revenue data.
  • Performance Tracking: Compare current revenue against targets or previous periods.

Metrics Tracked

  • Total revenue
  • Revenue by product/service
  • Revenue by customer segment
  • Month-over-month and year-over-year growth rates
  • Average transaction value

#8 – QuickBooks Cashflow Template

QuickBooks Cashflow Template

Get a copy of our cashflow template here.

The QuickBooks Cashflow Template tracks the movement of cash in and out of your business. It categorizes cash flows into operating, investing, and financing activities, providing a clear picture of your company’s liquidity and financial health.

Use Case: Cash Flow Management

  • Liquidity Analysis: Understand your business’s ability to meet short-term obligations.
  • Investment Decision Making: Evaluate the impact of potential investments on your cash position.
  • Financial Planning: Use cash flow trends to inform budgeting and financial strategy.

Metrics Tracked

  • Net cash flow from operating activities
  • Net cash flow from investing activities
  • Net cash flow from financing activities
  • Free cash flow
  • Cash conversion cycle

Free QuickBooks Online Reports

These seven QuickBooks Online reports offer valuable insights into various aspects of your business’s financial health, from cash flow projections to inventory management and financial ratio analysis. By using these dashboards, you’ll be better equipped to make data-driven decisions and keep your business on the path to financial success in 2025 and beyond. Start using these QuickBooks Online reports today to transform your financial reporting and decision-making processes.

Explore All QuickBooks Connector Dashboards

Additional Resources:

How to Connect Quickbooks to Salesforce?

Integrating your accounting and customer relationship management systems is crucial in this era of efficiency and growth. 

This is why we’re going to discuss how to integrate QuickBooks and Salesforce, two powerhouse platforms.

In this guide, we’ll explore the integration between Quickbooks and Salesforce, focusing on Quickbooks’ functionality and how it can enhance your Salesforce experience. 

Let’s start!

Benefits of Connecting Quickbooks to Salesforce

  1. Unified Financial and Sales Data: By integrating these platforms, finance and sales teams can access a unified view of financial data, customer interactions, invoices, and sales transactions across both systems. This unified approach streamlines workflows, eliminates duplicate data entry, and ensures financial and sales management consistency.
  2. Automated Data Synchronization: By automating data synchronization between QuickBooks and Salesforce, businesses can eliminate manual data entry errors and ensure that critical financial information, such as invoices, payments, and sales transactions, remains up-to-date on both platforms.
  3. Comprehensive Reporting and Analysis: By combining data from both platforms, businesses can generate comprehensive reports, analyze financial trends, and identify areas for improvement. This data-driven approach enables finance and sales teams to make informed decisions, optimize financial strategies, and drive revenue growth.

Use Cases of Connecting Quickbooks to Salesforce 

Connecting Quickbooks and Salesforce is crucial for businesses looking to streamline financial data management and ensure accurate reporting. There are several solutions available, each catering to different needs and use cases, from no-code automation to native integrations.

SolutionIdeal Application
CoefficientFinance teams that need to sync financial data from Quickbooks to Salesforce for comprehensive analysis and reporting, allowing users to import Quickbooks data into Google Sheets, combine it with Salesforce data, and push updates back to Salesforce without coding.
ZapierBusinesses that want to automate financial workflows between Quickbooks and Salesforce, such as automatically creating new records in Salesforce when a payment is received in Quickbooks, streamlining the financial data management process.
Quickbooks Native IntegrationCompanies seeking a direct, native integration between Quickbooks and Salesforce for simple accounting tasks

3 Methods to Connect Quickbooks to Salesforce  

Here’s a more comprehensive breakdown of how each method works so you can make an informed decision:

1. Coefficient 

Coefficient facilitates data transfer, formatting, storage, and analysis using a no-code approach and spreadsheets as the bridge between two platforms. It’s the perfect solution for businesses of all sizes looking to streamline their financial and sales operations. 

With Coefficient, you can effortlessly synchronize financial data between QuickBooks and Salesforce, ensuring data accuracy and consistency and full control over managing, reviewing, editing, and transforming the data between these two software to make the best possible use before importing/ exporting.

Pros:

  • No-code setup
  • No learning curve compared to complex software
  • Real-time data sync
  • Full control over data management 
  • Automatic data updates
  • Team collaboration features
  • Free plugin installation and affordable plans

Cons:

  • Some features require an additional payment
  • It uses a medium and does not directly integrate both platforms 

Here’s how you connect Quickbooks to Salesforce using Coefficient:

  1. For the first phase of integration, you need to install Coefficient. 

Open Google Sheets and navigate to the toolbar and Extensions > Add-on > Get Add-ons

You will be redirected to Google Workspace Marketplace. Search Coefficient in the search and Install by following the prompts and signing up for the account for free with your Google or work email.

  1. To Launch the extension, go back to the Extensions menu on the toolbar and you’ll find Coefficient in Add-ons menu. Coefficient will launch as an extension on the sidebar.
  1. Now, start importing data from Pipedrive to Google Sheets. If you’re connecting for the first time, authorize access to Pipedrive. 

Open Coefficient Sidebar and Click on the Menu icon

In the menu, Select “Import From…” and Select “Connected Sources.”

Select “Add Connection” at the bottom of the “Connected Sources” list and select QuickBooks.

  1. Click on Connect. In the next window, you will be asked to authorize QuickBooks by providing your log in details and allowing data exchange to connect the Coefficient with the platform.
  1. Open the Coefficient Sidebar and click the “Import from…” button to start the import. Choose “QuickBooks” from the provided list, and select  “From QuickBooks Report“.
  1. Pick the specific QuickBooks report you wish to import from your account (e.g., Profit and Loss).
  1. Personalize your import settings by selecting options for “Display Columns By, “”Report Period,” “Accounting Method,” and the necessary fields for this import.

Note: When adjusting your import settings, click “Refresh Preview” to see the updated sample data. The data will be sorted automatically based on the columns shown. For instance, “Customers” will appear alphabetically.

Click on Import in the top right corner, and you will have a spreadsheet synced with your QuickBooks!

You can preview and further change your Quickbooks dataset in Google Sheets or any other spreadsheet platform you use to manage your data. 

Then, you can set up a regular update that fetches data from Quickbooks and sends it to your Google Sheets spreadsheet.

  1. To begin the next phase, export data from your Pipedrive Google Sheet to Salesforce. Follow the same steps outlined above to authorize Salesforce with Coefficient.

Start by accessing the Coefficient Menu and selecting Salesforce. Then, navigate to “Export From…” and choose Salesforce from the provided options.

  1. Ensure you select the appropriate tab and header row in your spreadsheet. Always begin with Row 2, as Row 1 is reserved for Coefficient headers in imported spreadsheets.

For Destination Settings, specify the Salesforce Object where you want to place the data (e.g., Opportunities, Leads) and select an Action from the dropdown menu.

  1. You will proceed to the next step, where you will map fields, configure additional settings, and establish an automated export schedule for this spreadsheet. Click “Export” to proceed.

You can export all data or specify a particular set of cells to Salesforce. Once you’ve saved your field maps, you can configure an auto-update feature to refresh Salesforce data whenever edits are made in the Google Sheet, creating a seamless automated data exchange between Pipedrive and Salesforce.

Ensure a thorough review of all data before proceeding with the export, as this action cannot be undone. Any unnecessary information exported to Salesforce will need to be manually deleted.

  1. After reviewing, click “Next” to finalize and initiate the export process, and you’re done!

This way, you’ll have a complete loop of automated Data exchange between Quickbooks and Salesforce.

2. Zapier

Zapier connects QuickBooks to Salesforce and hundreds of other apps, allowing you to automate financial tasks and streamline processes. You can create customized workflows and rules to automate financial data management and notifications in Salesforce.

These ‘zaps’ created using Zapier as a bridge between the two software can be specific and manually set up or adjusted for any action/ trigger. This makes it the best option for teams that want only certain features connected in both platforms and not all the data.

Pros:

  • Wide range of integrations
  • Customizable workflows and rules
  • User-friendly interface
  • Specific setup and connections between platforms

Cons: 

  • Limited support for complex workflows
  • No automation for all data to be consolidated into Salesforce 
  • Expensive tool with overhead costs  

Here’s how creating integration zaps with Zapier works:

  1. Sign up for a Zapier account and choose QuickBooks as the trigger app and Salesforce as the action app.
  2. Configure the trigger event, such as “New Bill in QuickBooks,” and the corresponding action in Salesforce to “Create Record.” 
  1. Map the data fields between QuickBooks and Salesforce to ensure accurate data transfer.
  2. Test the Zap and activate it to start automating financial tasks and syncing data between the two platforms.

3. Quickbooks Online 

QuickBooks Online offers native integration with Salesforce, providing businesses seamless connectivity between financial and sales processes. 

With QuickBooks Online, businesses can access financial data directly within Salesforce, enabling finance and sales teams to make informed decisions and streamline financial operations.

Pros:

  • Native integration with Salesforce
  • Direct connectivity between QuickBooks and Salesforce
  • Simple setup and functionality
  • Free to use

Cons:

  • Limited customization options compared to third-party integrations
  • No advanced functionality
  • It doesn’t support real-time sync between two platforms
  • No auto-updates
  • Bidirectional data sharing only

Here’s how you can integrate QuickBooks and Salesforce using this plug-in:

  1. Navigate to the App Exchange and locate QuickBooks Online integration by DBSync.
  2. Log in with your Trailblazer.me account.
  3. Click “Get it Now” and launch this plugin in your Salesforce system.
  4. Choose the QuickBooks Online version you wish to integrate with Salesforce.
  5. Navigate back to Salesforce and select ‘Setup’ in the navigation bar. 
  1. Follow the prompts to authorize access and set up workflows. Then click “Save,” and you can run the integration.

Conclusion

Integrating Quickbooks with Salesforce is a game-changer for businesses as it promotes accurate financial insights, happier customers, and automated revenue tracking.

With options like Coefficient, Zapier, and QuickBooks Online, syncing client data between Quickbooks and Salesforce is quick and easy, bringing more possibilities to your business.

Want the most advanced, automated, and affordable way to get started and keep your data in check? 

Install Coefficient for free to export your customer data into spreadsheets and connect them to Salesforce with a few clicks and no extra costs!

How to Export Chart of Accounts from QuickBooks?

Looking to learn how to export your Chart of Accounts from QuickBooks?  This guide details two effective methods to accomplish this task.

Let’s dive in!

Method 1. Coefficient: Seamlessly Sync QuickBooks Data to Google Sheets or Excel

Coefficient is a powerful spreadsheet add-on that connects various business systems to Google Sheets and Excel. It allows users to import live QuickBooks data, including the chart of accounts, directly into their spreadsheets. This method is ideal for those seeking real-time data syncing and automated reporting.

Benefits of using Coefficient:

  1. Real-time data synchronization ensures up-to-date financial information.
  2. Automated report generation and distribution saves time and reduces manual errors.
  3. Direct integration with Google Sheets and Excel simplifies data analysis.
  4. Customizable data imports allow for tailored financial reporting.
  5. Scheduled data refreshes keep your spreadsheets current without manual intervention.

Step-by-step walkthrough:

Step 1. Install Coefficient

For Google Sheets

  • Open a new or existing Google Sheet, navigate to the Extensions tab, and select Add-ons > Get add-ons.
  • In the Google Workspace Marketplace, search for “Coefficient.”
  • Follow the prompts to grant necessary permissions.
  • Launch Coefficient from Extensions > Coefficient > Launch.
  • Coefficient will open on the right-hand side of your spreadsheet.
A screenshot of Coefficient open in the right-side panel of Google Sheets.

For Microsoft Excel

  • Open Excel from your desktop or in Office Online. Click ‘File’ > ‘Get Add-ins’ > ‘More Add-Ins.’
  • Type “Coefficient” in the search bar and click ‘Add.’
  • Follow the prompts in the pop-up to complete the installation.
  • Once finished, you will see a “Coefficient” tab in the top navigation bar. Click ‘Open Sidebar’ to launch Coefficient.
A screenshot of Coefficient open in the right-side panel of Excel

Step 2. Connect your QuickBooks account to Coefficient.

  • Launch the Coefficient add-on within your spreadsheet.
  • Click on the “Import from…” button in the Coefficient sidebar.
  • Select QuickBooks from the list of available integrations.
A screenshot of adding QuickBooks as a connection.
  • Log in to your QuickBooks account and authorize Coefficient to access your data.
Logging into your QuickBooks account to authorize Coefficient.

Step 3. Select the chart of accounts data you want to import.

  • After connecting, return to QuickBooks and select “From QuickBooks Report”
Selecting from QuickBooks report.
  • Select “Accounts” from the Import Preview Menu
The import preview menu in Coefficient.
  • Use the interface to select “Account Name,” “Balance in Sub-Accounts,” “Classification,” “Current Balance,” “Fully Qualified Name,” and “Type of Account.”  
Selecting account name, balance, and subaccounts, classification, current balance, fully qualified name, and type of account.
  • Click “Import” when you’re finished

Step 4. Set up automatic refresh schedules (optional).

  • Click on the “Schedule” option in the Coefficient sidebar.
  • Choose how often you want the data to refresh (e.g., daily, weekly, monthly).
  • Set the specific time and day for the refresh to occur.
Setting up auto-refresh and coefficient

Learn more about connecting QuickBooks to Google Sheets or Microsoft Excel.

Method 2. CSV Export from QuickBooks Online

A screenshot of the QuickBooks support page.

Exporting your chart of accounts to a CSV (Comma-Separated Values) file is a versatile option offered by QuickBooks Online. This method creates a file format that can be easily imported into various spreadsheet applications and accounting software. It’s useful for one-time exports or when working with multiple platforms.

Step-by-step walkthrough:

Step 1. Log in to your QuickBooks Online account.

  • Open your preferred web browser and go to the QuickBooks Online login page.
  • Enter your username and password, then click “Sign In.”

Step 2. Go to the Accounting menu and select “Chart of Accounts”

  • Once logged in, find the left-side navigation menu.
  • Click on “Transactions” to reveal the submenu options.
  • Choose “Chart of Accounts” from the list.
Selecting transaction and chart of accounts from the left-hand side of QuickBooks.

Step 3. Click on “Run Report” in the top right corner.

  • On the Chart of Accounts page, locate the “Run Report” button in the upper right area.
  • Click this button to generate a report of your chart of accounts.

Step 4. In the report view, click the “Export” icon and select “Export to CSV”.

  • After the report loads, find the “Export” icon (usually represented by a download arrow).
  • Click on this icon to see the available export formats.
  • Select “Export to CSV” from the options provided.

Step 5. Choose a location to save the file and click “Save”.

  • A file save dialog will appear, asking where you want to save the CSV file.
  • Navigate to your preferred folder on your computer.
  • Name the file if desired, and click “Save” to complete the export process.

Export Chart of Accounts and Keep it Live with Coefficient

While QuickBooks Online offers native export options for both Excel and CSV formats, Coefficient provides a more robust solution for real-time data syncing and automated reporting.  

Ready to streamline your QuickBooks data exports and take control of your financial reporting? Get started with Coefficient today and experience the power of automated, real-time data syncing.

Further Reading: How to Export QuickBooks Data to Google Sheets

Frequently Asked Questions

How do I find my Chart of Accounts in QuickBooks?

To find your Chart of Accounts in QuickBooks Online, click the gear icon in the upper right corner and select “Chart of Accounts” under “Your Company.” Alternatively, click “Accounting” in the left-side menu, then select “Chart of Accounts.”

For real-time access to your Chart of Accounts data, consider using Coefficient to sync QuickBooks with your spreadsheets.

Can I customize my QuickBooks Chart of Accounts export?

Yes, you can customize your QuickBooks Chart of Accounts export by selecting specific columns and data points before exporting.

For more advanced customization options and real-time data syncing, Coefficient offers flexible import settings and automated report generation.

How often should I export my Chart of Accounts from QuickBooks?

The frequency of exporting your Chart of Accounts depends on your business needs. For the most up-to-date financial data, consider using Coefficient to maintain a live connection between

QuickBooks and your spreadsheets, eliminating the need for manual exports.

How to Sync Stripe with QuickBooks?

Want to sync Stripe with QuickBooks? This guide will show you how to connect these platforms, streamline your financial reporting, and simplify reconciliation. You’ll learn three effective methods to link Stripe and QuickBooks, with step-by-step instructions for each approach.

Advantages of Connecting Stripe to QuickBooks

Connecting Stripe to QuickBooks offers several benefits for businesses:

Analyzing Stripe and QuickBooks data together offers several benefits for businesses:

  1. Comprehensive financial analysis: By combining Stripe transaction data with QuickBooks records, you can perform more in-depth financial analysis. This approach provides a fuller picture of your business’s financial health.
  2. Improved data-driven decisions: Comparing Stripe payments with QuickBooks entries allows for better insights into revenue patterns and financial trends. This information helps in making more informed business decisions.
  3. Detailed revenue tracking: Gain a more nuanced view of your income by analyzing Stripe revenue data alongside QuickBooks financial records. This combined perspective enables better financial planning and forecasting.

Top 3 Methods to Connect Stripe to QuickBooks

Here’s a comparison of the three main methods to connect Stripe to QuickBooks:

SolutionBest For
CoefficientUsers who want to analyze Stripe and QuickBooks data using Google Sheets or Excel, allowing for custom data transformation and in-depth analysis
Commerce SyncSmall to medium-sized businesses seeking automated data syncing between Stripe and QuickBooks for easier comparison and analysis
ZapierUsers who need a flexible, no-code solution to create custom workflows for transferring and comparing data between Stripe and QuickBooks

Let’s explore each method in detail:

Method 1: Coefficient

A screenshot of Coefficient's homepage.

Coefficient is a spreadsheet add-on that allows you to sync data from various sources, including Stripe and QuickBooks, into Google Sheets or Excel. This method is particularly useful for users who want to analyze or transform their data before syncing it to QuickBooks.

Step 1. Install Coefficient

For Google Sheets

  • Open a new or existing Google Sheet, navigate to the Extensions tab, and select Add-ons > Get add-ons.
  • In the Google Workspace Marketplace, search for “Coefficient.”
  • Follow the prompts to grant necessary permissions.
  • Launch Coefficient from Extensions > Coefficient > Launch.
  • Coefficient will open on the right-hand side of your spreadsheet.
A screenshot of Coefficient open on the right-side panel.

For Microsoft Excel

  • Open Excel from your desktop or in Office Online. Click ‘File’ > ‘Get Add-ins’ > ‘More Add-Ins.’
  • Type “Coefficient” in the search bar and click ‘Add.’
  • Follow the prompts in the pop-up to complete the installation.
  • Once finished, you will see a “Coefficient” tab in the top navigation bar. Click ‘Open Sidebar’ to launch Coefficient.
A screenshot of Coefficient open in Excel.

Step 2: Connect and Import Data from Stripe

  • Open Coefficient Sidebar: In Google Sheets, go to Extensions > Coefficient > Launch.
  • Connect Stripe: Click Import Data from the Coefficient sidebar, then select Stripe.
  • Authenticate: Select the Stripe account you want to connect and click Connect.
  • Select Data: Choose the object fields you want to import by clicking Select Fields. Configure any necessary filters and click Import.
Authorizing Coefficient to connect Stripe
A screenshot of the import preview menu

Step 3. Export Data to QuickBooks

Pros:

  • The user-friendly interface makes it easy for non-technical users to set up and manage the integration.
  • Flexible data transformation options allow for customized reporting and analysis.
  • Coefficient works with both Google Sheets and Excel, providing flexibility in your choice of spreadsheet software.

Cons:

  • This method requires a spreadsheet as an intermediary, which may not be ideal for all users.
  • There may be limitations for very large data sets, depending on the spreadsheet’s capacity.

Learn more about connecting QuickBooks to Google Sheets

Method 2: Commerce Sync

A screenshot of Commercesync homepage

Commerce Sync is a popular app that automates the transfer of Stripe sales activity into QuickBooks. This method provides a direct integration between the two platforms.

Step 1: Install Commerce Sync from the QuickBooks App Store.

  • Log in to your QuickBooks Online account.
  • Navigate to the App Store and search for “Commerce Sync.”
  • Click “Get App Now” and follow the installation prompts.

Step 2: Connect your Stripe account.

  • In the Commerce Sync setup wizard, select Stripe as your payment processor.
  • Follow the authentication process to link your Stripe account.

Step 3: Configure sync settings.

  • Choose which Stripe data you want to sync (e.g., sales, fees, refunds).
  • Map Stripe data fields to the corresponding QuickBooks categories.

Step 4: Set up automatic daily syncs.

  • In the Commerce Sync settings, enable automatic daily syncs.
  • Choose a preferred time for the sync to occur each day.

Step 5: Review and reconcile transactions in QuickBooks.

  • After the first sync, check your QuickBooks account to ensure the Stripe data has been imported correctly.
  • Reconcile the transactions as needed.

Pros:

  • Direct integration with QuickBooks eliminates the need for intermediary software.
  • Automated daily syncs keep your financial data up-to-date with minimal effort.
  • Commerce Sync handles complex transaction types, including refunds and fees.

Cons:

  • Limited customization options compared to more flexible solutions like Coefficient or Zapier.
  • May require a paid subscription for advanced features or higher transaction volumes.

Method 3: Zapier

A screenshot of Zapier's homepage.

Zapier is a no-code automation platform that allows you to create custom integrations between Stripe and QuickBooks. This method offers the most flexibility in terms of customizing your integration.

Step 1: Sign up for a Zapier account.

  • Visit the Zapier website and create a new account.
  • Choose a plan that suits your integration needs.

Step 2: Create a new Zap.

  • In your Zapier dashboard, click “+ Create.”
A screenshot of selecting + Create Zap.
  • This will start the process of setting up your custom integration.

Step 3: Choose Stripe as the trigger app.

  • Search for Stripe in the trigger app selection.
  • Select the specific Stripe event that will trigger the integration (e.g., “New Charge” or “New Invoice”).
A screenshot of selecting a trigger in Zapier.

Step 4: Select QuickBooks as the action app.

  • Search for QuickBooks in the action app selection.
  • Choose the action you want to occur in QuickBooks (e.g., “Create Invoice” or “Create Journal Entry”).
A screenshot of selecting an action in Zapier.

Step 5: Configure the data mapping.

  • Map the Stripe data fields to the corresponding QuickBooks fields.
  • Use Zapier’s built-in functions to transform data if needed (e.g., formatting dates or calculating totals).

Step 6: Test and activate your Zap.

  • Run a test to ensure the integration works as expected.
  • If successful, turn on your Zap to start the automated integration.

Pros:

  • Highly customizable workflows allow for complex integrations tailored to your specific needs.
  • Supports multiple trigger events, enabling various automation scenarios.
  • Can integrate with other apps beyond Stripe and QuickBooks for more comprehensive automation.

Cons:

  • May require some technical knowledge for setting up complex integrations.
  • Can become costly for high-volume integrations, as Zapier pricing is based on the number of tasks performed.

Streamline Your Stripe and QuickBooks Integration Today

Connecting Stripe to QuickBooks is crucial for maintaining accurate financial records and simplifying your accounting processes. While there are several methods available, Coefficient offers a unique approach that leverages the power of spreadsheets for data transformation and analysis. By using Coefficient, you can ensure that your Stripe data is accurately synced with QuickBooks while gaining valuable insights along the way.

Ready to simplify your Stripe and QuickBooks integration? Get started with Coefficient today and experience the benefits of seamless data synchronization.

For more information on optimizing your QuickBooks workflow, check out our guide on Top QuickBooks Connector Apps.

Frequently Asked Questions

How do I match Stripe payments in QuickBooks?

To match Stripe payments in QuickBooks:

  1. Sign in to your QuickBooks Online account
  2. Go to Banking/Transactions from the left menu
  3. Select the Stripe account and go to the “For review” tab
  4. Choose each transaction and select categorize, match, or record as a transfer

Coefficient can automate this process by syncing Stripe data directly to QuickBooks, reducing manual matching efforts.

How do I sync payments in QuickBooks?

To sync payments in QuickBooks:

  1. Hover your mouse over the invoice or payment
  2. Click “Sync to QB”
  3. If already synced, click the QB icon to open the item directly in QuickBooks Online

With Coefficient, you can set up automatic syncs between Stripe and QuickBooks, ensuring all payments are up-to-date without manual intervention.

How do I add Stripe fees to QuickBooks?

To add Stripe fees to QuickBooks:

  1. Go to Accounting > Chart of Accounts > New on your QuickBooks dashboard
  2. Set Account Type to “Expenses”
  3. Choose Detail Type as “Other Business Expenses” or “Bank Charges”
  4. Name the account “Stripe Merchant Fees” or similar
  5. Click Save and Close

Coefficient can automatically import and categorize Stripe fees in QuickBooks, saving you time and ensuring accuracy.

Further Reading

Import Journal Entries from Google Sheets to QBO

Keeping your financial records accurate and up-to-date is crucial for any business. But let’s face it: manual data entry is tedious and prone to errors. That’s where importing journal entries from Google Sheets to QuickBooks Online (QBO) comes in handy.

This guide will walk you through three methods to make this process smoother and more reliable.

TLDR

  • Step 1:

    Get Started by installing Coefficient from the Google Marketplace

  • Step 2:

    Launch Coefficient from the Extensions dropdown.

  • Step 3:

    Click Import Data from the Coefficient sidebar, then select Quickbooks.

  • Step 4:

    Authorize and click Connect on the Quickbooks popup window.

  • Step 5:

    Choose the QuickBooks reports and fields you want to pull data from. In this case, select Journal Entries.

  • Step 6:

    Click import. QuickBooks data will auto-populate in Google Sheets within seconds. You can even set your data import on a refresh schedule.

Why Import Journal Entries?

Picture this: You’re hunched over your keyboard, squinting at spreadsheets, and manually entering data into QuickBooks Online. Sound familiar? It’s not just time-consuming—it’s a recipe for mistakes.

Accurate financial data is the backbone of sound business decisions. When your numbers are off, even by a little, it can lead to:

  • Misguided budget allocations
  • Inaccurate tax filings
  • Skewed performance metrics

By automating the import process, you’re not just saving time. You’re:

  • Minimizing human error
  • Ensuring data consistency
  • Freeing up resources for more strategic tasks

Now, let’s dive into the methods you can use to import those journal entries and reclaim your time.

Method 1: Using Coefficient to Sync Google Sheets with QuickBooks Online

coefficient for quickbooks homepage

Coefficient syncs live data from various business systems, like QuickBooks, directly into Excel and Google Sheets.

For QuickBooks users, this means you can build real-time financial reports, automate data updates, and streamline your accounting workflows without leaving your familiar spreadsheet environment.

Key Features

Step-by-Step Guide

Step 1. Install Coefficient

  • Open a new or existing Google Sheet, navigate to the Extensions tab, and select Add-ons > Get add-ons.
  • In the Google Workspace Marketplace, search for “Coefficient.”
  • Follow the prompts to grant necessary permissions.
  • Launch Coefficient from Extensions > Coefficient > Launch.
  • Coefficient will open on the right-hand side of your spreadsheet.
open coefficient to import quickbooks journal entries

Step 2. Connect to QuickBooks

Click “Import from…” on the sidebar. Select QuickBooks from the list of data sources.

select quickbooks to import journal entries with coefficient

Follow the prompts to authorize Coefficient to your Intuit QuickBooks account.

connect quickbooks to spreadsheets with coefficient

Step 3. Import and Consolidate Your Data

After connecting, return to QuickBooks from the menu and browse the available reports:

  • Transaction list by customer
  • Transaction list by vendor
  • Transaction list by date
  • Balance sheet
  • Cash Flow
  • Profit and Loss.
import journal entries from quickbooks into google sheets

Adjust your filters as needed. Choose your date range. Decide which companies to include.

filter quickbooks import into google sheets

Choose the fields you want to include (or exclude), name your import, and click the button to push your data to your spreadsheet.

select quickbooks fields to import

Pros and Cons

Pros:

  • No coding needed, so anyone on the team can use it.
  • Simple and easy-to-use interface with plug-and-play connectors.
  • Quick installation; you can start using it in less than a minute.
  • Automatic data updates keep your spreadsheet data up-to-date in real-time.
  • Automates tasks like importing accounting data and invoice reconciliation.

Cons:

  • Some features require an upgrade

Method 2: Importing Journal Entries Manually with CSV

manually import quickbooks journal entries into google sheets

This method uses QuickBooks Online’s native import function to bring in journal entries from a CSV file exported from Google Sheets. It’s a quick, straightforward method but prone to error.

Key Features

  • Direct use of QuickBooks Online tools
  • Complete control over data formatting
  • No additional software required

Step-by-Step Guide

  1. Prepare Your Journal Entries in Google Sheets
    • Set up columns: Date, Account, Debit, Credit, Description
    • Ensure debits and credits balance for each entry
    • Verify account names match your QuickBooks chart of accounts exactly
  1. Export to CSV
    • In Google Sheets: File > Download > CSV
    • Save with a clear name (e.g., “JE_Import_[Date].csv”)
  1. Import to QuickBooks Online
    • Go to: Gear icon > Tools > Import Data > Journal Entries
    • Upload your CSV
    • Map your columns to QuickBooks fields
    • Review the preview carefully
    • Complete the import
  1. Verify the Import
    • Check Accounting > Journal Entries
    • Run a Trial Balance to ensure everything balances
    • Review any unmatched accounts or import errors

Pros and Cons

Pros:

  1. Control: Full visibility and control over each entry before it hits the books.
  2. No Extra Cost: Uses existing QuickBooks tools without additional expenses.
  3. Familiarity: No learning curve; uses processes most accountants already know.

Cons:

  1. Time Drain: Can be painfully slow for high volume of entries.
  2. Error Risk: More chance of typos or missed entries due to manual handling.
  3. Repetitive Work: Becomes a chore for recurring journal entries.

Method 3: Using G-Accon

g-accon for quickbooks

G-Accon is a third-party add-on that creates a direct link between Google Sheets and QuickBooks Online. It automates the journal entry import process, reducing manual work and potential for errors.

Step-by-Step Guide

  • Automated syncing between Google Sheets and QuickBooks Online
  • Supports complex journal entries (e.g., classes, locations)
  • Built-in error checking and validation

Tutorial

  1. Set Up G-Accon
    • Install G-Accon add-on in Google Sheets
    • Connect it to your QuickBooks Online account
  1. Prepare Your Journal Entries
    • Format your sheet similarly to the CSV method
    • G-Accon allows for additional fields like Class or Location
  1. Configure and Run the Import
    • Open G-Accon sidebar: Upload Data > Journal Entries
    • Select your data range
    • Map columns to QuickBooks fields
    • Set any default values or import rules
    • Run the import
  1. Verify in QuickBooks
    • Check Accounting > Journal Entries
    • Run a Trial Balance and General Ledger report
    • Address any errors flagged by G-Accon

Pros:

  1. Time Saver: Dramatically cuts down on data entry time, especially for recurring entries.
  2. Accuracy Boost: Reduces human error in the transfer process.
  3. Handles Complexity: Better for complicated entries like multi-currency or inter-company transactions. If you’re evaluating tools, see how this compares in our Coefficient vs. G-Accon comparison.

Cons:

  1. Extra Expense: Subscription cost adds to the accounting budget.
  2. Setup Time: Initial configuration and learning curve to get it right.

Best Practices for Importing Journal Entries

Regardless of your chosen method, these best practices will serve you well:

  1. Ensuring data accuracy and consistency:
    • Double-check account names and numbers. A minor typo can cause major headaches.
    • Verify that debits and credits balance. This is Accounting 101, but it’s easy to overlook.
    • Use consistent date formats. YYYY-MM-DD is your safest bet.
  1. Proper formatting of journal entries in Google Sheets:
    • Use clear, consistent headers that match QBO fields.
    • Avoid merged cells or complex formatting. Keep it simple.
    • Include all required fields for journal entries. Don’t leave QBO guessing.
  1. Regular reconciliation and error checking:
    • Compare imported data with source documents. Trust, but verify.
    • Run QBO reports to confirm successful imports.
    • Address discrepancies immediately. Small errors can snowball quickly.

Troubleshooting Common Import Issues

Even with the best tools, issues can arise. Here’s how to tackle common problems:

  1. Addressing formatting errors:
    • Check date formats. QBO can be picky about this.
    • Look for hidden characters or extra spaces. They’re invisible troublemakers.
    • Ensure numerical values are formatted correctly. No commas in thousands, please.
  1. Resolving account mapping problems:
    • Verify account names in your sheet exactly match QBO. Case sensitivity matters.
    • When in doubt, use account numbers. They’re unique identifiers.
  1. Handling duplicate entries:
    • Use unique identifiers for each journal entry. A combination of date and entry number works well.
    • With Coefficient, set up filters to exclude previously imported data. It’s smart like that.

Choose Your Import Method Wisely

Importing journal entries from Google Sheets to QuickBooks Online doesn’t have to be a chore. While QBO’s native import and G-Accon offer basic functionality, Coefficient stands head and shoulders above the rest for finance professionals who demand the best.

With Coefficient, you’re not just importing data—you’re transforming your entire financial workflow. Real-time syncing, powerful automation, and flexible data manipulation put you in control.

The choice is clear. Streamline your processes. Enhance your data accuracy. Free up time for strategic financial analysis. Don’t let inefficient data management hold you back.

Ready to revolutionize your journal entry process? Get started with Coefficient today. Your future self will thank you.

How to Connect QuickBooks to Google Sheets? Top 3 Methods

If you want to connect QuickBooks to Google Sheets, this blog is for you. And we understand why you want to: one of the best ways to manage and analyze your QuickBooks data is to link it to Google Sheets.

Here’s a step-by-step guide on how to connect QuickBooks to Google Sheets, highlighting some of the most popular methods. 

TLDR

  • Step 1:

    Get Started by installing Coefficient Add-on for Google Sheets.

  • Step 2:

    Launch Coefficient from Google Sheets Extensions Menu.

  • Step 3:

    Click Import Data from the Coefficient sidebar, then select Quickbooks.

  • Step 4:

    Authorize and click Connect on the Quickbooks popup window.

  • Step 5:

    Choose the QuickBooks reports and fields you want to pull data from.

  • Step 6:

    Click import. QuickBooks data will auto-populate in Google Sheets within seconds.

Video Walkthrough: How to Connect Quickbooks to Google Sheets


Coefficient is the fastest and safest way to connect QuickBooks to Google Sheets

Coefficient integrates QuickBooks to Google Sheets in a single click, with no coding required. In fact, Coefficient can connect Google Sheets to any business system, enabling you to blend and analyze your QuickBooks data with a variety of other data sources (Salesforce, HubSpot, MySQL, Looker, and so on).  

Coefficient’s automatic data updates allow you to build live accounting reports and dashboards in Google Sheets with your QuickBooks data. You can pull reports with added filters and sorts, compare performance across periods (e.g., MoM, YoY), and pull raw data from Objects, Classes, Vendors, and more.

To make reporting even more effective, Coefficient provides professional on-sheet styling with report headers, cell highlighting, and formatting that persists and respects your edits. And with Slack/email alerts, you can update stakeholders in real-time when key accounting reports and KPIs change. It’s the easiest way to connect QuickBooks to Google Sheets, pull in accounting data, develop real-time dashboards, and share them with your team.

QuickBooks Google Sheets Integration: Best Tools and Methods

While there are many ways and tools to connect QuickBooks to Google Sheets, we’ll focus on the best methods in this guide.  

Method 1: Coefficient (no-code)

Coefficient’s no-code solution is the fastest and easiest option to connect, import, and sync your QuickBooks data on Google Sheets. 

Step 1: Install Coefficient to Google Sheets by navigating to Extensions>Add-ons>Get Add-ons.

get coefficient for quickbooks in google sheets

Type in Coefficient on the Google Workspace Marketplace’s search bar. Click the Coefficient app in the results. 

search for coefficient for quickbooks on the google marketplace

Select your Google Account and click Allow to authorize access.

authenticate coefficient for quickbooks on google

After installing, launch the Coefficient app by going back to the Google Sheet top menu and click Extensions>Coefficient Salesforce, HubSpot Data Connector>Launch

open coefficient for quickbooks in google sheets

You’ll see the Coefficient app as a sidebar within the Google Sheet interface. 

Step 2: Click Import from… on the sidebar. 

import from any data source in google sheets with coefficinet

Select QuickBooks from the list of data sources. 

connect quickbooks to google sheets with coefficient

Click Authorize to let Coefficient connect to your Intuit QuickBooks account. 

connect quickbooks to google sheets with coefficient

Click Connect on the separate popup window. 

authorize coefficient to connect quickbooks with google sheets

Step 3: Once you’re connected successfully, choose the QuickBooks reports you want to pull data from. Let’s choose the Transaction List By Customer report for this example. 

import quickbooks report into google sheets

Choose any Filters you want to use, including the Report Period, Due Date, and Transaction Type. 

filter quickbooks report for google sheets import

Step 4: Choose the fields you want to include (or exclude) and name your import. 

select quickbooks fields to import into google sheets

Click Import. Your data from QuickBooks will auto-populate Google Sheets within seconds. 

Step 5: Automate data updates by setting an auto-refresh schedule. You can schedule hourly, daily, or weekly automatic data updates. 

schedule automatic refreshes from quickbooks into google sheets

Automatic data updates sync live data into Google Sheets continuously, so you always have up-to-date reporting and analytics. You can also schedule Snapshots to make a copy of your data before updates.  

refresh schedule for quickbooks to google sheets

Pros

Cons

  • Upgrade required for full feature set. 

Method 2: Zapier (maintenance required)

Zapier offers a QuickBooks web connector for Google Sheets. Follow the steps below to configure and use the web connector. 

Step 1: After logging into Zapier, connect your QuickBooks Online account to the Zapier platform. 

quickbooks google sheets zapier

Follow the prompts to allow Zapier to connect to your QuickBooks Online account.

Click Next to connect your Google Sheets account to Zapier and follow the prompts to authorize the connection. 

Step 2: Create your Zaps (custom automated workflows). Set up your Trigger by choosing Google Sheets as your app. 

set google sheets trigger in zapier

Next, select your Trigger event (New Spreadsheet for this example) and click Continue.  

refine google sheets trigger in zapier

Choose your connected Google Sheets account and the Google Drive where your spreadsheet is stored. 

select google sheets drive for zapier

Click Continue

You can test your trigger to confirm you connected the right account and whether you configured your trigger correctly. 

Step 3: Configure your Action by selecting QuickBooks Online as your app.

Choose your action event, such as a new row, new payment, new bill, purchase order, and more. 

We’ll use Create Invoice for this example. 

Click Continue

action event for quickbooks in zapier

Select your connected QuickBooks Online account.

Step 4: Set up the action of the Zap by filling out the required fields, including the customer value, tracking number, billing address, and so on. 

quickbooks action in zapier

Click Continue when you’re done.

Step 5: Test your action to see if it works. 

You’ll see the data input summary for your action. You can either click Test & Review or click Test and Continue to run the action.

The Zap sends live data to your action app when testing your action step, which means a real invoice template gets automatically created in your QuickBooks account when you make an invoice in your Google spreadsheet. 

After a successful test, you can retest the action or turn on the Zap to activate your automated data flow between QuickBooks and Google Sheets.

turn on google sheets quickbooks zap

Add other actions to your Zap if necessary, or finish setting up by clicking Close

Pros

  • Imports QuickBooks data in Sheets with no-code interface
  • Automates basic spreadsheet tasks

Cons

  • You must define the specific data you want to pull, creating a significant manual workload for all of your imports.
  • Actions and automations are not customizable or fully controllable. 
  • Zaps can only leverage limited, pre-defined integrations.    

Method 3: Google Apps Script (code required)

Google Apps Script is an option for tech-savvy teams. You can combine QuickBooks Open Database Connectivity (ODBC) Driver from CData and SQL Gateway to access your QuickBooks Online data from Google Apps Script. 

The SQL Gateway allows your local ODBC data sources to look and act like a standard MySQL database. 

Start by creating a new MySQL remoting service within the SQL Gateway for the QuickBooks Online ODBC Driver. 

You’ll also need to ensure the SQL Gateway is installed and can connect to a hosted Secure Shell (SSH) server or a web-facing machine.   

Before configuring your connection, provide the necessary connection properties values in the Data Source Name (DSN). Then, configure the DSN using the (built-in) Microsoft ODBC Data Source Administrator. 

QuickBooks Online utilizes the OAuth authentication standard, which means the authenticating user needs to log in via the browser. 

Use the embedded OAuthClientSecret, OAuthClientId, and CallbackURL to authenticate with OAuth. You can also register an app with Intuit to get your own CallBackURL. 

Once you’re done with the pre-configurations, follow the steps below to use Google Apps Script to access the MySQL remoting service and import your QuickBooks Online data within Google Sheets. 

Step 1: Go to your spreadsheet’s top menu and click Extensions Apps Script

app script open

Step 2: Create several class variables for functions created within the script.

call quickbooks with appscript

Step 3: Include a function that adds a Menu option to your Sheet. That way, the UI can call the function.

quickbooks appscript

Step 4: Create a Helper function used to find the first empty row in your spreadsheet.

quickbooks actions with appscript google sheets

Step 5: Use the function below to write your QuickBooks Online data to your spreadsheet. 

full quickbooks appscript call

The function uses Google Apps Script Java Database Connectivity (JDBC) to link to the MySQL remoting service, select QuickBooks data, and populate your Sheet with the data. 

Step 6: Run the entire script.

In the first input box, enter the Sheet’s name to hold your data. 

post quickbooks data to google sheets with appscript

Next, enter the name of the QuickBooks Online table for the function to read. 

pull data from quickbooks into google sheets with appscript

Note: The function is intended as a menu option, but you can extend its use as a spreadsheet formula 

Pros

  • Using the Google Script editor means you won’t need to add new app integrations for comprehensive workflow customization based on your unique needs.

Cons

  • The Script Editor is geared towards users with technical and coding skills (JavaScript).
  • Tons of potential errors, even for experienced programmers. 
  • Your QuickBooks credentials, such as your username and password, can be seen in the script source, which doesn’t make the Script editor the most secure option. 
  • Encryption/decryption requires significant coding and technical knowledge

Connecting QuickBooks to Google Sheets streamlines accounting, financial, and expense reporting workflows. Your accounting team saves time while reducing potential errors, improving data analysis and financial modeling. Choose Coefficient – the easiest and most seamless method — to connect QuickBooks with Google Sheets. 

Sign up for a free Coefficient account today!

How to Connect QuickBooks to HubSpot? Top Methods and Tutorials

Are you looking to connect QuickBooks to HubSpot? You’re in the right place.

In this guide, we’ll explore three methods – each suits different skill levels and needs.  By the end, you’ll know which is best for you and how to set it up.

Let’s dive in!

Advantages of Connecting QuickBooks to HubSpot

Integrating QuickBooks with HubSpot offers several key benefits that can transform your business operations:

  1. Eliminate sales commission calculation errors: Connect QuickBooks financial data with HubSpot deal information. Automatically calculate commissions based on actual revenue, reducing overpayments and disputes with sales reps.
  2. Cut billing cycle time: Link HubSpot deals to QuickBooks invoices. Generate invoices automatically when deals close in HubSpot, reducing the lag between service delivery and payment collection.
  3. Decrease overdue payments: Combine QuickBooks payment data with HubSpot communication tools. Send targeted, automatic payment reminders based on invoice status, improving your accounts receivable turnover.

Top 3 Methods to Connect QuickBooks to HubSpot

SolutionBest For
CoefficientOrganizations needing advanced reporting and data analysis. Suitable for finance teams that want to combine HubSpot and QuickBooks data in spreadsheets for custom financial reporting.
HubSpot-QuickBooks native integrationSmall businesses needing basic data sync between HubSpot and QuickBooks. Ideal for those wanting a simple setup without customization.
ZapierCompanies requiring custom workflows between HubSpot and QuickBooks. Best for teams that need to automate specific processes like creating QuickBooks customers from HubSpot contacts.

#1 Coefficient: No-code, Automated

a screenshot of coefficient's homepage

Coefficient syncs live data from various business systems, like QuickBooks, directly into Excel and Google Sheets.

For QuickBooks users, this means you can build real-time financial reports, automate data updates, and streamline your accounting workflows without leaving your familiar spreadsheet environment.

Pros:

Cons:

  • Some advanced features, such as scheduled automations, are only available on paid plans. However, Coefficient’s pricing is still very competitive compared to other solutions.

Step-by-step walkthrough:

Step 1. Install Coefficient for your spreadsheet of choice

For Google Sheets

  • Open a new or existing Google Sheet, navigate to the Extensions tab, and select Add-ons > Get add-ons.
  • In the Google Workspace Marketplace, search for “Coefficient.”
  • Follow the prompts to grant necessary permissions.
  • Launch Coefficient from Extensions > Coefficient > Launch.
  • Coefficient will open on the right-hand side of your spreadsheet.
Opening Coefficient sidebar google sheets

For Microsoft Excel

  • Open Excel from your desktop or in Office Online. Click ‘File’ > ‘Get Add-ins’ > ‘More Add-Ins.’
  • Type “Coefficient” in the search bar and click ‘Add.’
  • Follow the prompts in the pop-up to complete the installation.
  • Once finished, you will see a “Coefficient” tab in the top navigation bar. Click ‘Open Sidebar’ to launch Coefficient.
Opening Coefficient sidebar excel

Step 2. Import QuickBooks Data into Your Spreadsheet

Open Coefficient Sidebar and Click on the Menu icon.

searching for quickbooks

In the menu, Select “Import From…” and Select “Connected Sources.”

selecting connected sources

Select “Add Connection” at the bottom of the “Connected Sources” list and select QuickBooks.

Adding QuickBooks connection

Click on Connect. In the next window, you will be asked to authorize QuickBooks by providing your log in details and allowing data exchange to connect the Coefficient with the platform.

Providing QuickBooks login details

Open the Coefficient Sidebar and click the “Import from…” button to start the import. Choose “QuickBooks” from the provided list, and select  “From QuickBooks Report“.

Selecting QuickBooks report
 Picking specific QuickBooks report

Pick the specific QuickBooks report you wish to import from your account (e.g., Profit and Loss).

Personalizing import settings

Personalize your import settings by selecting options for “Display Columns By, “”Report Period,” “Accounting Method,” and the necessary fields for this import.

 Importing data to spreadsheet

Note: When adjusting your import settings, click “Refresh Preview” to see the updated sample data. The data will be sorted automatically based on the columns shown. For instance, “Customers” will appear alphabetically.

Click on Import in the top right corner, and you will have a spreadsheet synced with your QuickBooks!

confirming import in coefficent

Step 3. Export Data from Your Spreadsheet to HubSpot

Before starting, make sure you’ve connected to HubSpot.

Then, navigate to Coefficient’s menu >Click “Export to…”

Exporting to HubSpot

Select HubSpot.

Selecting workbook tab

Select the tab and header row in your spreadsheet. The header row should contain the HubSpot field headers.

Specifying database table

Choose the HubSpot property you are exporting the data to.

Completing field mappings

Then, select the action you want to perform (Update, Insert, or Delete).

Highlighting rows for export

Map the fields in your spreadsheet to the corresponding HubSpot fields. If your data came from a HubSpot import using Coefficient, the fields will be automatically mapped. Otherwise, you will need to map them manually.

mapping fields

Configure any advanced settings such as the column for results. Coefficient will write back information to your spreadsheet related to the update, including the HubSpot record ID, status of the export, and timestamp.

select advanced seetings

Review your settings and click “Export”.

Review your settings and click "Export".

Select the rows in your sheet that you want to export to HubSpot. You can update a single row or all rows in your sheet.

Select the rows in your sheet that you want to export to HubSpot

Coefficient will confirm the rows that have been updated in your HubSpot instance. The records will have the record ID, result status, and timestamp of the update.

confirming export suuccessful

#2 Native HubSpot-QuickBooks Integration

Native HubSpot-QuickBooks Integration homepage

 HubSpot’s built-in integration offers basic syncing between QuickBooks and HubSpot. It’s a good starting point for businesses with straightforward needs, but it may lack the depth and flexibility of other options.

Pros:

  • No additional cost for HubSpot and QuickBooks users
  • Easy to set up with minimal technical knowledge
  • Designed specifically for the two systems, ensuring compatibility
  • Usually well-documented and supported by the parent companies

Cons:

  • Limited flexibility and customization options
  • May not cover all possible use cases or data fields
  • Can be affected by changes in either platform’s API
  • Often lack advanced features like data transformation or complex workflow automation

Step-by-step walkthrough:

  1. In HubSpot, go to the Marketplace and search for “QuickBooks Online”
  2. Click “Connect app” and follow the prompts to authorize the connection
  3. Choose the data you want to sync (contacts, companies, deals, etc.)
  4. Configure your sync settings
  5. Start the initial sync

#3 Zapier for QuickBooks-HubSpot Connection

zapier homescreen screenshot

Zapier automates tasks between your web apps, including QuickBooks and HubSpot. By creating custom “Zaps,” you can trigger specific actions in one app based on events in the other, ensuring data stays up-to-date without manual intervention.

Pros:

  • User-friendly interface with pre-built templates
  • Wide range of app integrations beyond just QuickBooks and databases
  • No coding required for basic automations
  • Regular updates and good customer support

Cons:

  • Limited customization for complex data transformations
  • Can become expensive for high-volume data transfers or multiple zaps
  • Not suitable for real-time data syncing (runs on schedules)
  • May have troubles with large datasets due to API limits

Step-by-step walkthrough:

  1. Sign up for a Zapier account
  2. Create a new Zap
  3. Choose QuickBooks as the trigger app and select an event (e.g., “New Bill”)
QuickBooks event in Zapier
  1. Connect your QuickBooks account to Zapier
  2. Choose HubSpot as the action app and select an action (e.g., “Create or Update Contact”)
Connecting HubSpot in Zapier
  1. Connect your HubSpot account to Zapier
  2. Map the fields between QuickBooks and HubSpot
  3. Test and activate your Zap

QuickBooks to HubSpot? Do it in Seconds with Coefficient

Connecting QuickBooks to HubSpot can significantly improve your business operations by automating financial processes, enhancing customer management, and providing a unified view of your data. While there are several methods to achieve this integration, Coefficient stands out as the most powerful and flexible solution, especially for businesses with advanced needs.

Ready to take your QuickBooks-HubSpot integration to the next level? Try Coefficient today and experience the power of seamless data synchronization and advanced reporting.

QuickBooks Consolidated Financial Statements: A Comprehensive Guide

Looking for a way to consolidate financial statements in QuickBooks?

Unfortunately, QuickBooks doesn’t offer a native solution. But that doesn’t mean you’re out of options.

Many businesses face this challenge, and several effective workarounds and third-party solutions bridge this gap. Let’s explore each in detail.

TLDR TLDR triangle accent
Step 1

Set up separate QuickBooks company files for each entity and ensure consistent chart of accounts across all entities

Step 2

Run standard financial reports (Balance Sheet, P&L) for each company and export to Excel or Google Sheets

Step 3

Manually combine reports by mapping accounts and eliminating intercompany transactions

Step 4

Use Coefficient to automate the entire process—pull live data from multiple QuickBooks companies into one spreadsheet that updates automatically

Step 5

Build consolidated dashboards with real-time data, automated intercompany elimination, and instant refresh capabilities

Multi-Entity Financial Reporting: Challenges and Workarounds

Consolidated financial statements combine data from multiple related companies into one comprehensive report, treating a parent company and its subsidiaries as a single economic entity.

However, since QuickBooks lacks this capability, it recommends workarounds that introduce several challenges:

  • Time-consuming manual data aggregation
  • Increased risk of errors in consolidation
  • Difficulty eliminating inter-company transactions
  • Complications with multi-currency conversions

Using Coefficient for QuickBooks Consolidated Financial Statements

a screenshot of coefficient's homescreen menu

Coefficient syncs live data from various business systems, like QuickBooks, directly into Excel and Google Sheets.

For QuickBooks users, this means you can build real-time financial reports, automate data updates, and streamline your accounting workflows without leaving your familiar spreadsheet environment.

Pros and Cons of Coefficeint

  • Cons:
    • Some advanced features, such as scheduled automations, are only available on paid plans. However, Coefficient’s pricing is still very competitive compared to other solutions.

Creating Consolidated Reports with Coefficient: A Step-by-Step Guide

Step 1. Install Coefficient

For Google Sheets

  • Open a new or existing Google Sheet, navigate to the Extensions tab, and select Add-ons > Get add-ons.
  • In the Google Workspace Marketplace, search for “Coefficient.”
  • Follow the prompts to grant necessary permissions.
  • Launch Coefficient from Extensions > Coefficient > Launch.
  • Coefficient will open on the right-hand side of your spreadsheet.
Opening coefficient from the side menu google sheets

For Microsoft Excel

  • Open Excel from your desktop or in Office Online. Click ‘File’ > ‘Get Add-ins’ > ‘More Add-Ins.’
  • Type “Coefficient” in the search bar and click ‘Add.’
  • Follow the prompts in the pop-up to complete the installation.
  • Once finished, you will see a “Coefficient” tab in the top navigation bar. Click ‘Open Sidebar’ to launch Coefficient.
Opening coefficient from the side menu excel

Step 2. Connect to QuickBooks

Click “Import from…” on the sidebar. Select QuickBooks from the list of data sources.

Selecting QuickBooks import

Follow the prompts to authorize Coefficient to your Intuit QuickBooks account.

Authorizing Coefficient to QuickBooks

Step 3. Import and Consolidate Your Data

After connecting, return to QuickBooks from the menu. Select your report from the available options:

  • Transaction list by customer
  • Transaction list by vendor
  • Transaction list by date
  • Balance sheet
  • Cash Flow
  • Profit and Loss.
choosing from available reports

Adjust your filters as needed. Choose your date range. Decide which companies to include.

Adjusting filters for import

Choose the fields you want to include (or exclude), name your import, and click the button to push your data to your spreadsheet.

Choosing fields for import

Continue this process for every report you want to consolidate. Never worry about copy-paste errors again!

Using Third Party Integrations

While QuickBooks doesn’t offer native multi-entity reporting capabilities, there are several integrations available in its marketplace to help facilitate consolidation.

We’ll examine two popular options shortly, but first, here’s how you can access them (or others).

  1. Go to the Apps menu and then click Find Apps.
  2. In the Search field, you can type consolidate or other keywords.
  3. Select the app you want to integrate
    accessing quickbooks app store
  4. Click Get App Now and complete the on-screen instruction

JustConsolidate

JustConsolidate homepage

JustConsolidate is a financial data consolidation solution tailored for businesses utilizing multiple QuickBooks files. It offers features including automated data synchronization, configurable consolidation parameters, and comprehensive financial reporting capabilities.

Key Features:

  1. QuickBooks Integration: Seamless data import from multiple QuickBooks files
  2. Customizable Consolidation: Adjustable settings for currency conversion and intercompany eliminations
  3. User-Friendly Interface: Intuitive design for efficient navigation and operation

Limitations:

  1. Limited Analytics: Lacks advanced financial analysis tools
  2. Basic Reporting: Offers standard financial reports with limited customization
  3. Scalability Constraints: May encounter performance issues with large-scale consolidations or complex corporate structures

Consolidation Process with JustConsolidate

Step 1. Account Setup and QuickBooks Connection

  • Register on the JustConsolidate platform
  • Access the main dashboard
  • Link QuickBooks files via the ‘Add New File’ function

Step 2. Consolidation Parameter Configuration

  • Navigate to ‘Consolidation Settings’
  • Select target QuickBooks files for consolidation
  • Set consolidation parameters (e.g., FX rates, intercompany transaction handling)

Step 3. Financial Statement Generation

  • Access the ‘Reports’ module
  • Choose ‘Consolidated Financial Statements’
  • Specify reporting period and relevant filters
  • Execute report generation

Step 4. Report Review and Export

  • Scrutinize the consolidated statements for accuracy
  • Export in desired format (e.g., PDF, Excel) for stakeholder distribution or further analysis

Qvinci

Qvinci homepage

Qvinci is a comprehensive financial reporting platform that integrates with QuickBooks to deliver real-time consolidated financial statements. It specializes in multi-entity reporting, automated data updates, and customizable financial dashboards.

Key Features:

  1. Advanced Financial Analytics: In-depth financial analysis tools and customizable KPI dashboards
  2. Real-Time Data Synchronization: Ensures up-to-date financial reporting across multiple entities
  3. Comprehensive Reporting Suite: Extensive range of customizable financial reports

Limitations:

  1. Complex User Interface: Steeper learning curve due to advanced features
  2. Higher Price Point: Premium pricing reflecting the extensive feature set
  3. Time-Intensive Setup: Initial configuration process can be complex and time-consuming

Consolidation Process with Qvinci:

Step 1. Account Setup and QuickBooks Integration

  • Create a Qvinci account
  • Access the main dashboard
  • Connect QuickBooks files through the ‘Add New File’ function

Step 2. Entity Structure Configuration

  • Access ‘Entity Management’
  • Create logical groupings for consolidation entities
  • Assign QuickBooks files to appropriate entity groups

Step 3. Consolidation Rule Definition

  • Navigate to ‘Consolidation Settings’
  • Establish rules for intercompany transactions and currency adjustments
  • Configure additional consolidation parameters as needed

Step 4. Report Generation and Customization

  • Access the ‘Reports’ module
  • Select ‘Consolidated Financial Statements’
  • Define reporting period, entity selection, and other relevant parameters
  • Execute report generation

Step 5. Report Validation and Export

  • Conduct a thorough review of the consolidated statements
  • Export in preferred format (e.g., PDF, Excel) for distribution or further analysis

Choosing the Right Consolidation Solution for Your Business

Consolidated financial statements in QuickBooks don’t have to be a headache. Yes, native QuickBooks tools have limitations. Third-party apps offer some relief. But for a comprehensive solution? Coefficient takes the cake.

It integrates seamlessly with QuickBooks. It automates data refresh. It offers powerful customization options. In short, it addresses the unique challenges of financial consolidation head-on.

With Coefficient, you’re not just saving time. You’re enhancing decision-making. You’re getting a clear, real-time view of your organization’s financial health. It’s like having a financial crystal ball.

Ready to revolutionize your QuickBooks consolidated financial statements? It’s time to take action. Get started with Coefficient today. Experience the power of automated, accurate financial consolidation. Your future self will thank you.

How to Connect Quickbooks to Snowflake? A Step-by-Step Guide

Integrating QuickBooks with Snowflake can revolutionize the management of your financial data. This guide covers the advantages of this connection and provides detailed, step-by-step instructions for three methods: Coefficient, Hevo, and Stitch.

Advantages of Connecting QuickBooks to Snowflake

  • Centralize financial data: Combine QuickBooks financial data with other business data in Snowflake for a comprehensive view of your company’s performance.
  • Enhance financial analytics: Leverage Snowflake’s powerful analytics features to gain deeper insights into your financial data.
  • Streamline data management: Automate the transfer of data from QuickBooks to Snowflake, reducing manual effort and ensuring data consistency.

Connecting QuickBooks and Snowflake: 3 Methods

Connecting QuickBooks and Snowflake is crucial for businesses looking to leverage their financial data for comprehensive reporting and analysis. With a range of solutions catering to different needs, organizations can choose the tool that best aligns with their requirements and technical capabilities.

Solution

Best For

Coefficient

Finance teams who want to analyze disparate data in spreadsheets with no-code. Example: Combining QuickBooks data alongside other business data in Snowflake.

Fivetran

Companies that require continuous replication of large volumes of QuickBooks data to Snowflake for near real-time analytics.

Stitch

Organizations seeking an easy-to-use, affordable solution for moving QuickBooks data to Snowfla

How to Connect QuickBooks to Snowflake

Method 1: Coefficient – No-Code, User-Friendly

Coefficient connects your spreadsheet to all your business data without a single line of code. It allows users to perform quick, ad hoc analyses for a variety of use cases.

Pros:

Cons:

  • Scheduled automations are not free forever, though plans are affordable

Detailed step-by-step walkthrough:

Step 1. Install Coefficient

For Google Sheets

Open a new or existing Google Sheet, navigate to the Extensions tab, and select Add-ons > Get add-ons.

Select Get Add-ons option in Google Sheets Menu Bar

In the Google Workspace Marketplace, search for “Coefficient.”

Search and Choose Coefficient from Google Workspace

Follow the prompts to grant necessary permissions.

Image1

Launch Coefficient from Extensions > Coefficient > Launch.

Launch Coefficient Data Connector in Google Sheets

Coefficient will open on the right-hand side of your spreadsheet.

Coefficient Sidebar in Google Sheets

For Microsoft Excel

Open Excel from your desktop or in Office Online. Click ‘File’ > ‘Get Add-ins’ > ‘More Add-Ins.’

Find Coefficient Add-in from Microsoft Office Store

Type “Coefficient” in the search bar and click ‘Add.’

Add Coefficient Add-in to Excel from Microsoft Office Store

Follow the prompts in the pop-up to complete the installation.

Once finished, you will see a “Coefficient” tab in the top navigation bar. Click ‘Open Sidebar’ to launch Coefficient.

Coefficient Sidebar in Microsoft Excel

Step 2. Import QuickBooks Data into Your Spreadsheet

Click ‘Import from…’ and scroll down until you find QuickBooks. 

Click ‘Connect’ to continue.

Choose Quickbooks as your data source in Coefficient sidebar

A couple notes:

  • You need Admin access in QuickBooks to establish a connection with Coefficient.
  • QuickBooks API permits only one admin to connect through Coefficient simultaneously.
  • You can connect multiple QuickBooks accounts to Excel with Coefficient.

Follow the prompts to connect Coefficient to your QuickBooks account.

Authorize  Quickbooks connection through Coefficient

Step 3: Define QuickBooks Data to Export to Excel

Next, specify the QuickBooks data you’re looking to bring into Excel.

Coefficient’s flexibility allows you to choose from over 17 standard QuickBooks reports, build one from scratch, or write a custom query.

Image18

Click ‘From QuickBooks Report’ to continue.

Image17

Choose a Report from the list then hit ‘Next.’

Select data to be connected from Quickbooks to Google Sheets using Coefficient

Customize your Report import by selecting “Display Columns By” and applying filters such as “Report Period” and “Accounting Method”.

Image24

Select your desired fields and click ‘Import.’

In just a few seconds, your QuickBooks export to Excel will automatically populate your spreadsheet.

Quickbooks Data Exported into Google Sheets

Step 3. Export Data from Your Spreadsheet to Snowflake

Before starting, make sure you’ve connected to Snowflake.

Then, navigate to Coefficient’s menu. Click “Export to…”

Choose Export option in Coefficient sidebar

Choose Snowflake from the list of available data sources.

Choose Snowflake as the data source in Coefficient sidebar

Select the tab and header rows in your spreadsheet that contains the data you want to export.

Select tab and headers rows of the data exported to Snowflake from Google Sheets using Coefficient

Click “Next” to continue.

Select the table in your Snowflake database that you want to update. Then, select the type of action you want to perform—Update, Insert, Upsert, or Delete.

Select the table in Snowflake database to be imported into snowflake

Map the fields from your spreadsheet to the corresponding Snowflake fields.

Map the fields between Google Sheets and Snowflake

Note: Primary Keys (ID fields) are required for Update and Delete actions. For Insert actions, the Primary Key field can be set to auto populate if it’s configured in Snowflake.

(Optional) Specify additional settings such as batch size, whether to export empty cells on an update, and the column for results.

Select the necessary formatting options if required

Confirm your settings.

Confirm the settings to push data into Snowflake from Google Sheets in Coefficient Add-on

Then, highlight the rows you want to update or export. You can choose to export all rows or specific rows.

Highlight the google sheet rows to be updated

After you’re finished, review your settings and click “Export.”

Follow the prompts to confirm your changes.

Click on "Update Rows in Snowflake" to push the data from Google Sheets to Snowflake

In a few seconds, data from your spreadsheet will be pushed to Salesforce.

Data exported to Snowflake successfully using Coefficient add-on

Coefficient will then update the records in Snowflake, displaying the status, record ID, and timestamp of the updates in your spreadsheet.

Method 2: Hevo – Automated, No-Code Data Pipeline

Image6

Hevo offers real-time data replication without requiring code, ideal for users needing automated data pipelines.

Pros:

  • Real-time replication
  • Supports numerous integrations
  • No coding required

Cons:

  • Subscription-based pricing
  • Initial setup can be complex

Step-by-Step Guide:

1. Setting Up Hevo Data:

Sign Up for a Hevo Account:

  • Visit the Hevo Data Website: Go to Hevo Data.
  • Create an Account: Click on “Sign Up” and provide the required information.
  • Log In: Verify your email address, if necessary, and log in to your Hevo Data account.

Choose QuickBooks as Your Source:

  • Access the Dashboard: Navigate to the Hevo dashboard once logged in.
  • Create Pipeline: Click on “Create Pipeline.”
  • Select Source: Choose “QuickBooks” from the list of available sources.

Connect Hevo to Your QuickBooks Account:

  • Follow Prompts: Provide your QuickBooks credentials and authorize Hevo to access your QuickBooks data.
  • Test Connection: Ensure that Hevo can successfully connect to your QuickBooks account.

Configure the Data You Want to Replicate:

  • Select Data Entities: Choose the specific data entities (e.g., invoices, customers, transactions) you want to replicate.
  • Data Extraction Settings: Configure any necessary data extraction settings.

2. Setting Up Snowflake as a Destination:

Add Snowflake as the Destination:

  • Choose Destination: In the Hevo dashboard, click on “Add Destination.”
  • Select Snowflake: Choose “Snowflake” from the list of destination options.

Enter Your Snowflake Account Details:

  • Account Details: Provide the necessary Snowflake account details, including:
    • Account Name: Your Snowflake account name.
    • Database Name: The database where the data will be stored.
    • Warehouse: The Snowflake warehouse to use for the data loading process.
    • Username and Password: Your Snowflake credentials.

Map Your Data Fields from QuickBooks to Snowflake:

  • Field Mapping: Define how the data fields from QuickBooks should map to the corresponding columns in Snowflake.
  • Transformation Rules: Set up any necessary data transformation rules to ensure the data is correctly formatted.

3. Start the Pipeline to Begin Real-Time Data Transfer:

Review the Pipeline Configuration:

  • Review Settings: Ensure all configurations and mappings are correct.
  • Activate Pipeline: Click on “Activate” to start the real-time data transfer.

Monitor the Data Sync Status:

  • Real-Time Monitoring: Use the Hevo dashboard to monitor the data sync status and ensure everything is functioning correctly.
  • Adjustments: Make any necessary adjustments based on the monitoring results.

Method 3: Stitch – Simple, Powerful ETL

Image3

Stitch provides an effective ETL tool capable of handling large data volumes, perfect for more data-intensive needs.

Pros:

  • Easy setup
  • Handles large data volumes
  • Robust documentation

Cons:

  • Limited free tier
  • Some advanced features require coding

Step-by-Step Guide:

1. Setting Up Stitch:

Create an Account on Stitch:

  • Visit the Stitch Website: Go to Stitch.
  • Create an Account: Click on “Sign Up” and provide the required information.
  • Log In: Verify your email address, if necessary, and log in to your Stitch account.

Select QuickBooks as Your Data Source:

  • Access the Dashboard: Navigate to the Stitch dashboard once logged in.
  • Add Integration: Click on “Add Integration” and choose “QuickBooks” from the list of available sources.

Authorize and Connect Your QuickBooks Account:

  • Follow Prompts: Provide your QuickBooks credentials and authorize Stitch to access your QuickBooks data.
  • Test Connection: Ensure that Stitch can successfully connect to your QuickBooks account.

Configure the Data Replication Settings:

  • Select Data Entities: Choose the specific data entities (e.g., invoices, customers, transactions) you want to replicate.
  • Replication Frequency: Set the frequency at which you want the data to be replicated (e.g., hourly, daily).

2. Adding Snowflake as Your Destination:

Add Snowflake as Your Destination:

  • Choose Destination: In the Stitch dashboard, click on “Add Destination.”
  • Select Snowflake: Choose “Snowflake” from the list of destination options.

Input Your Snowflake Account Details:

  • Connection Settings: Provide your Snowflake account details, including:
    • Account Name: Your Snowflake account name.
    • Database Name: The database where the data will be stored.
    • Warehouse: The Snowflake warehouse to use for the data loading process.
    • Username and Password: Your Snowflake credentials.

Map QuickBooks Data Fields to Snowflake Tables:

  • Field Mapping: Define how the data fields from QuickBooks should map to the corresponding columns in Snowflake.
  • Transformation Rules: Set up any necessary data transformation rules to ensure the data is correctly formatted.

3. Start the ETL Process to Transfer and Transform Data:

Review the Configuration:

  • Review Settings: Ensure all configurations and mappings are correct.
  • Start ETL Process: Click on “Start” to begin the data transfer and transformation process.

Monitor the Data Sync Status:

  • Real-Time Monitoring: Use the Stitch dashboard to monitor the data sync status and ensure everything is functioning correctly.
  • Adjustments: Make any necessary adjustments based on the monitoring results.

Conclusion

Connecting QuickBooks to Snowflake enhances your financial data’s accessibility, accuracy, and analytic capabilities. Whether you choose Coefficient, Hevo, or Stitch, each method offers unique strengths tailored to different business needs.

Ready to streamline your financial data management? Get started with Coefficient today here.

How to Connect QuickBooks to PostgreSQL? Top Methods with Walkthroughs

Are you looking to connect QuickBooks to PostgreSQL? You’re in the right place.

In this guide, we’ll explore three methods – each suits different skill levels and needs.  By the end, you’ll know which is best for you and how to set it up.

Let’s dive in!

Advantages of Connecting QuickBooks to PostgreSQL

Before we dive into the “how,” let’s explore the “why” behind connecting these two powerful platforms:

  1. Streamline month-end close process: Automatically sync daily QuickBooks transactions to PostgreSQL. This allows you to run preliminary reports and identify discrepancies earlier, reducing the time spent on month-end reconciliations and closing activities.
  2. Create custom financial reports: Combine QuickBooks’ transaction data with PostgreSQL’s query capabilities. This allows you to generate tailored reports that aren’t possible within QuickBooks alone, such as detailed cash flow projections or customer profitability analysis.
  3. Enhance budget vs. actual analysis: Store historical QuickBooks data in PostgreSQL alongside budget data. This enables more detailed variance analysis, allowing you to quickly identify areas of overspending or underperformance and make timely adjustments to financial strategies.

Top 3 Methods to Connect QuickBooks to PostgreSQL

Now that we understand the benefits, let’s explore the three best methods to connect QuickBooks to PostgreSQL.

SolutionBest For
CoefficientFinance teams who want to sync QuickBooks data to Google Sheets or Excel, then push to PostgreSQL. Ideal for those comfortable with spreadsheets but not coding.
ZapierUsers who need to automate simple data transfers from QuickBooks to PostgreSQL along with other app integrations. Best for basic, trigger-based synchronization.
CData SyncIT departments or data teams that need to replicate large volumes of QuickBooks data to PostgreSQL. Suitable for companies requiring scheduled, bi-directional syncing.

Revised 50-word Introduction:

Let’s dive into each method and see how they stack up.

#1 Coefficient: The Spreadsheet-Native Solution

a screenshot of coefficient's menu

Coefficient syncs live data from various business systems, like QuickBooks, directly into Excel and Google Sheets.

For QuickBooks users, this means you can build real-time financial reports, automate data updates, and streamline your accounting workflows without leaving your familiar spreadsheet environment.

Pros and Cons of Using Coefficient

Pros

Cons

  • Some advanced features, such as scheduled automations, are only available on paid plans. However, Coefficient’s pricing is still very competitive compared to other solutions.

How to Connect QuickBooks to PostgreSQL with Coefficient

Step 1. Install Coefficient for your spreadsheet of choice

For Google Sheets

  • Open a new or existing Google Sheet, navigate to the Extensions tab, and select Add-ons > Get add-ons.
  • In the Google Workspace Marketplace, search for “Coefficient.”
  • Follow the prompts to grant necessary permissions.
  • Launch Coefficient from Extensions > Coefficient > Launch.
  • Coefficient will open on the right-hand side of your spreadsheet.
Opening Coefficient sidebar google sheets

For Microsoft Excel

  • Open Excel from your desktop or in Office Online. Click ‘File’ > ‘Get Add-ins’ > ‘More Add-Ins.’
  • Type “Coefficient” in the search bar and click ‘Add.’
  • Follow the prompts in the pop-up to complete the installation.
  • Once finished, you will see a “Coefficient” tab in the top navigation bar. Click ‘Open Sidebar’ to launch Coefficient.
Opening Coefficient sidebar excel

Step 2. Import Data from QuickBooks to Your Spreadsheet

Open Coefficient Sidebar and Click on the Menu icon.

Selecting import from menu

In the menu, Select “Import From…” and Select “Connected Sources.”

Adding QuickBooks connection

Select “Add Connection” at the bottom of the “Connected Sources” list and select QuickBooks.

selecting quickbooks from the menu

Click on Connect. In the next window, you will be asked to authorize QuickBooks by providing your log in details and allowing data exchange to connect the Coefficient with the platform.

Providing QuickBooks login details

Open the Coefficient Sidebar and click the “Import from…” button to start the import. Choose “QuickBooks” from the provided list, and select  “From QuickBooks Report“.

Picking QuickBooks import from...
Selecting QuickBooks report

Pick the specific QuickBooks report you wish to import from your account (e.g., Profit and Loss).

Picking specific QuickBooks report

Personalize your import settings by selecting options for “Display Columns By, “”Report Period,” “Accounting Method,” and the necessary fields for this import.

Personalizing import settings

Note: When adjusting your import settings, click “Refresh Preview” to see the updated sample data. The data will be sorted automatically based on the columns shown. For instance, “Customers” will appear alphabetically.

Click on Import in the top right corner, and you will have a spreadsheet synced with your QuickBooks!

Importing data to spreadsheet

Step 3. Export Data from Your Spreadsheet to PostgreSQL

Before starting, make sure you’ve connected Coefficient to PostgreSQL.

Then, navigate to Coefficient’s menu. Click “Export to…”

Exporting to PostgreSQL

Select PostgreSQL from the menu.

Selecting workbook tab

Choose the tab in your workbook that contains the data you want to export and specify the header row that contains the database field headers.

Specifying database table

Specify the table in your database where you want to insert the data and choose the appropriate action (Insert, Update, Delete).

Completing field mappings

Complete the field mappings for the export. Ensure that primary keys or ID fields are mapped if required for the action you are performing.

Highlighting rows for export

Confirm your settings and click “Export” to proceed.

Highlight the specific rows in your sheet that you want to export, or choose to export all rows.

confirming export to postgreSQL

Review your settings and follow the prompts to push your data back to PostgreSQL.

Pros and Cons of Using Coefficient

Pros:

  • No coding needed, so anyone on the team can use it.
  • Simple and easy-to-use interface with plug-and-play connectors.
  • Quick installation; you can start using it in less than a minute.
  • Automatic data updates keep your spreadsheet data up-to-date in real-time.
  • Automates tasks like importing accounting data and invoice reconciliation.

Cons:

  • Some features require an upgrade

#2 Zapier: The Multi-App Integration Platform

a screenshot of zapiers homepage

Zapier is a versatile tool that can connect QuickBooks to PostgreSQL along with thousands of other apps. Here’s how to set it up:

  1. Create a Zapier account and set up a new Zap.
  2. Choose QuickBooks as your trigger app.
  3. Select the specific QuickBooks event you want to trigger the sync.
QuickBooks event in Zapier
  1. Connect your PostgreSQL database as the action app.
Connecting PostgreSQL in Zapier
  1. Map the QuickBooks data fields to your PostgreSQL table columns.
  2. Test and activate your Zap.

Pros and Cons of Using Zapier

Pros:

  • Wide range of app integrations
  • User-friendly interface
  • Automated workflows

Cons:

  • Pro account required to access QuickBooks and PostgreSQL
  • May require multiple zaps for complex integrations
  • Limited data transformation capabilities

#3 CData Sync: The Enterprise-Grade ETL Tool

Using CData Sync

CData Sync is a robust solution for businesses needing advanced ETL features. Here’s how to set it up:

  1. Download and install CData Sync.
  2. Configure the QuickBooks connector with your account details.
  3. Set up the PostgreSQL connection with your database credentials.
  4. Create a new sync job, selecting QuickBooks as the source and PostgreSQL as the destination.
  5. Map the QuickBooks tables and fields to your PostgreSQL schema.
  6. Configure sync schedules and options.
  7. Run the sync job and monitor the results.

Pros and Cons of Using CData Sync

Pros:

  • Robust data replication capabilities
  • Supports real-time and scheduled syncing
  • Wide range of supported data sources and destinations
  • Advanced data transformation features

Cons:

  • Can be complex to set up and configure
  • More expensive than some other options
  • May require IT involvement for installation and maintenance
  • Overkill for simple integration needs

QuickBooks to PostgreSQL? Do it in Seconds with Coefficient

Connecting QuickBooks to PostgreSQL can significantly streamline your financial data management and analysis. Whether you’re a spreadsheet enthusiast, need multi-app integration, or require enterprise-grade ETL capabilities, there’s a solution for you.

For businesses looking for a user-friendly, spreadsheet-based solution with real-time syncing capabilities, Coefficient stands out as an excellent choice. Its native integration with Excel and Google Sheets makes it perfect for finance teams who live and breathe spreadsheets.

Ready to supercharge your financial data management? Try Coefficient today and experience seamless QuickBooks to PostgreSQL integration!

Want to explore more integration options? Check out our post on Top QuickBooks Connector Apps for a comprehensive look at other powerful tools in the market.