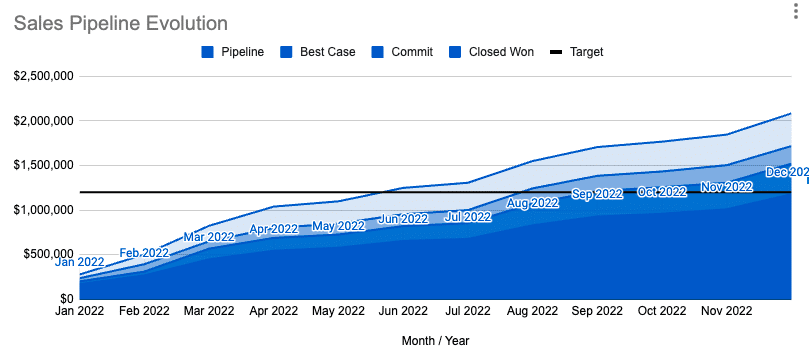
B2B Sales Pipeline Coverage – From Prospect to Profits (Insights from RevOps Expert)

In B2B sales, mastering your pipeline coverage isn’t just important—it’s essential. But with ever-evolving market dynamics and shifting customer behaviors, no two sales cycles are the same.

How can sales leaders navigate these complexities and set their teams up for success?

This guide discusses pipeline coverage best practices to ensure consistent growth by using insights from seasoned RevOps experts Emerson McCuin, Saahil Dhaka, and Cody Kimball.

Let’s dive in.

What is Pipeline Coverage?

At its core, pipeline coverage is a metric that offers a ratio of the total opportunities present in your sales pipeline compared to the sales quota set for a specific time period.

This sales pipeline coverage ratio is often used as a rule of thumb by sales leaders to gauge the health of their pipeline.

A foundational understanding of the pipeline is essential, as it’s “everything you need to know” when evaluating the effectiveness of a sales strategy.

How to Calculate Pipeline Coverage?

The formula for pipeline coverage is: Pipeline Coverage = Total Pipeline / Sales Quota for the Period

Example: If your sales team has a total pipeline value of $320,000 and a quota of $100,000 for the month, the pipeline coverage is 3x.

How to Calculate Sales Pipeline Coverage in Coefficient 

Coefficient’s Pipeline Analysis Dashboard for Google Sheets is your gateway to understanding and optimizing pipeline coverage.

Follow these steps to get started: 

Step 1: Download the template

To start, head to Coefficient.io. Enter your work email in the box and click ‘Get Free Template.’ 
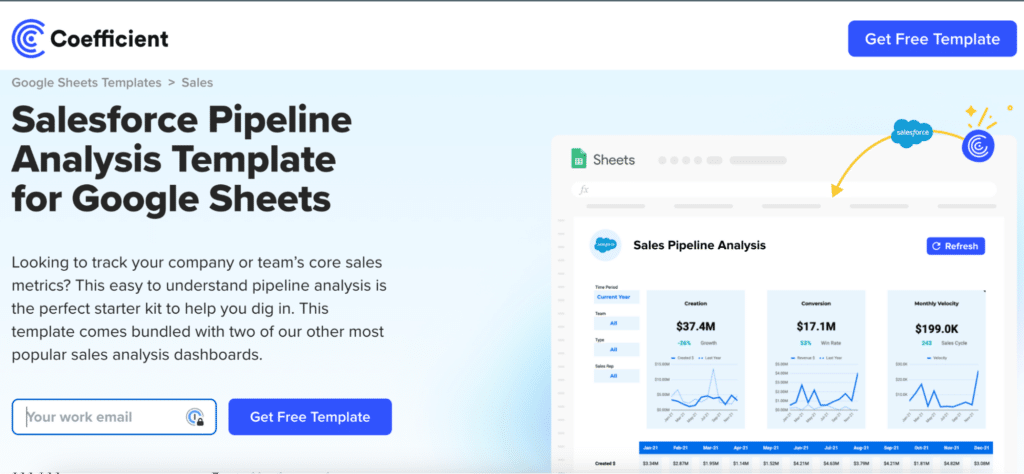
User entering email to receive a free template on Coefficient.io homepage.

You can save the template to your Google account by clicking the ‘Use Template’ button at the top right corner of your screen.
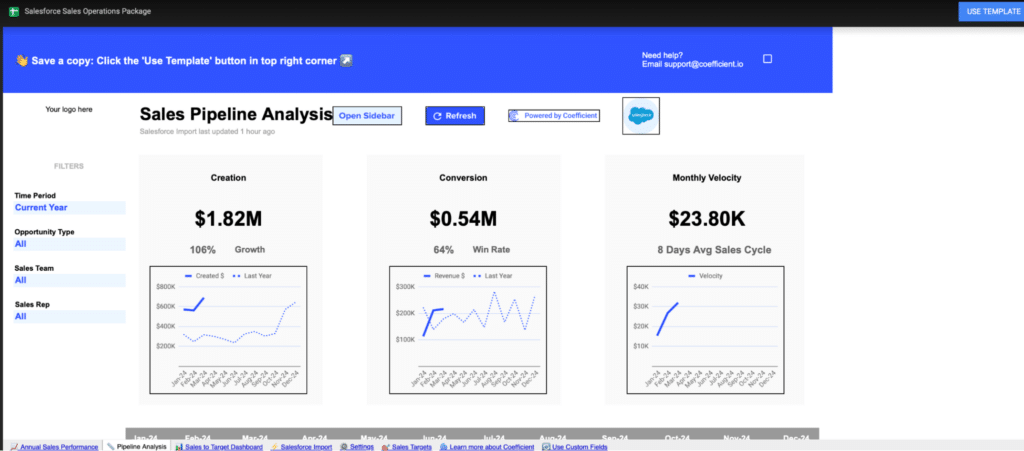
Clicking 'Use Template' button to save the template to Google account.

Your dashboard will open in a new spreadsheet associated with your Google account.
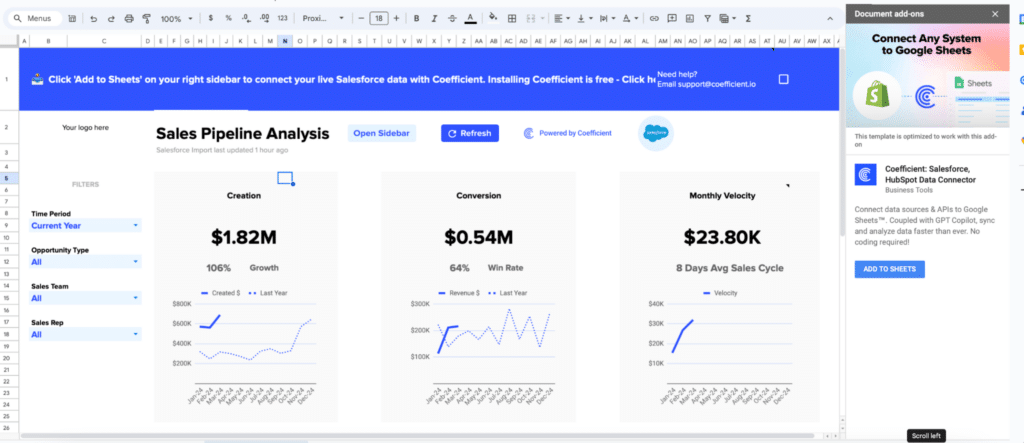
New spreadsheet dashboard opening in Google Sheets for Coefficient.

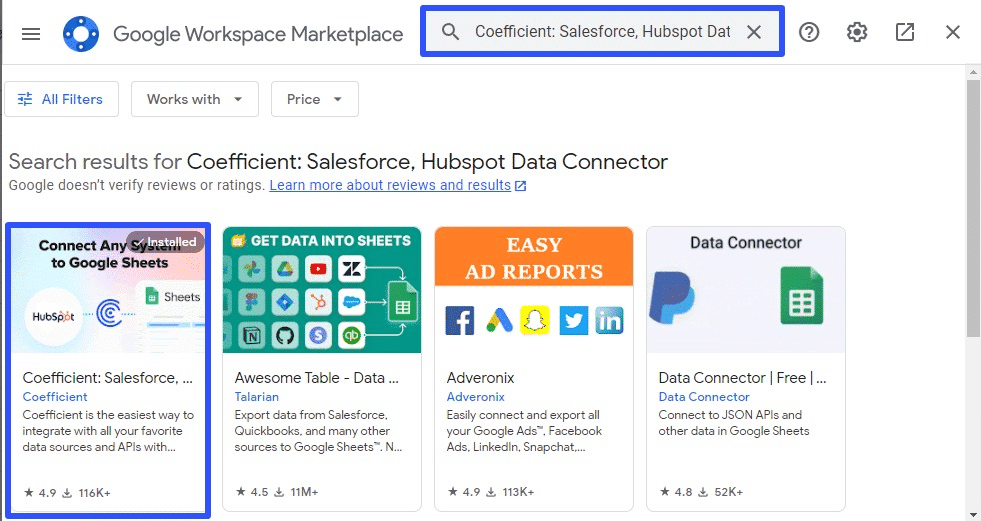
If this is your first time using Coefficient, you’ll need to add it as an add-on to Google Sheets. Click ‘Add to Sheets’ to continue.
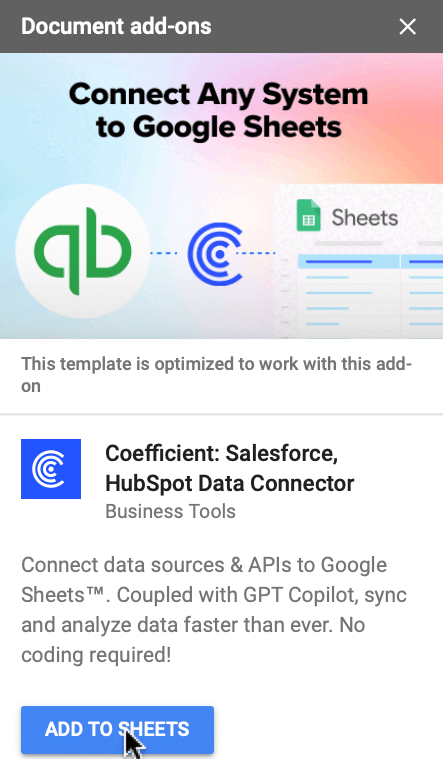
Clicking ‘Add to Sheets’ to integrate Coefficient add-on with Google Sheets.

Hit the ‘Install’ button and follow the prompts to complete the installation.
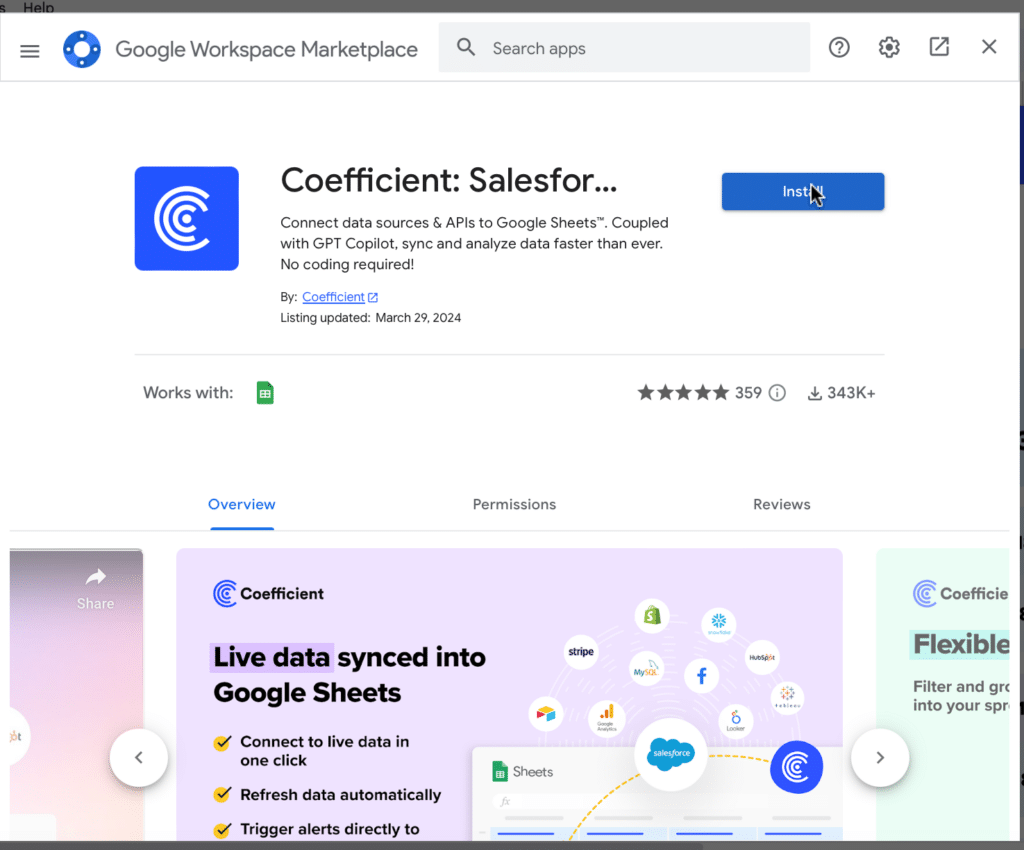
Installing Coefficient add-on by hitting the ‘Install’ button in Google Sheets.

Step 2: Connect Coefficient to Salesforce

After installation is complete, hit ‘Done’ to return to your spreadsheet. 
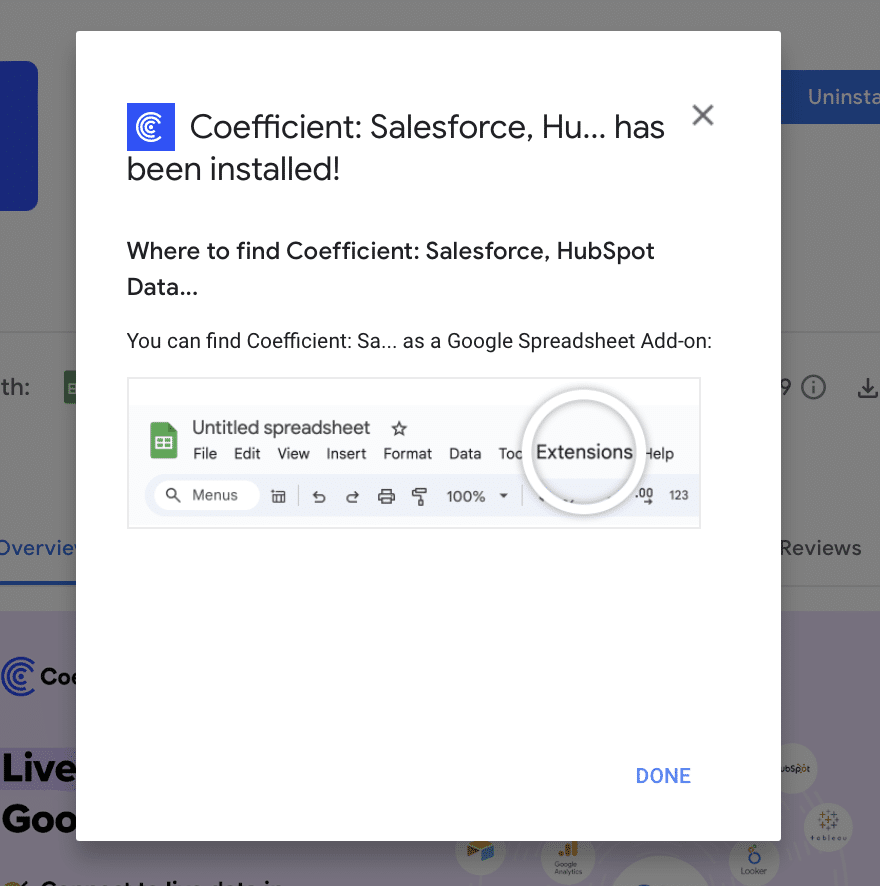
Completing Coefficient installation and returning to spreadsheet by hitting ‘Done’.

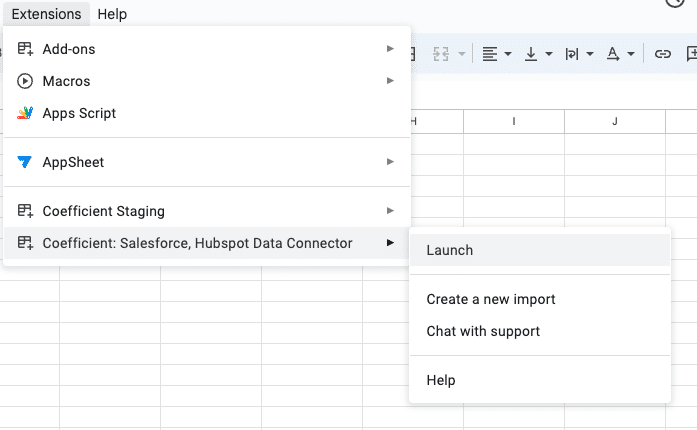
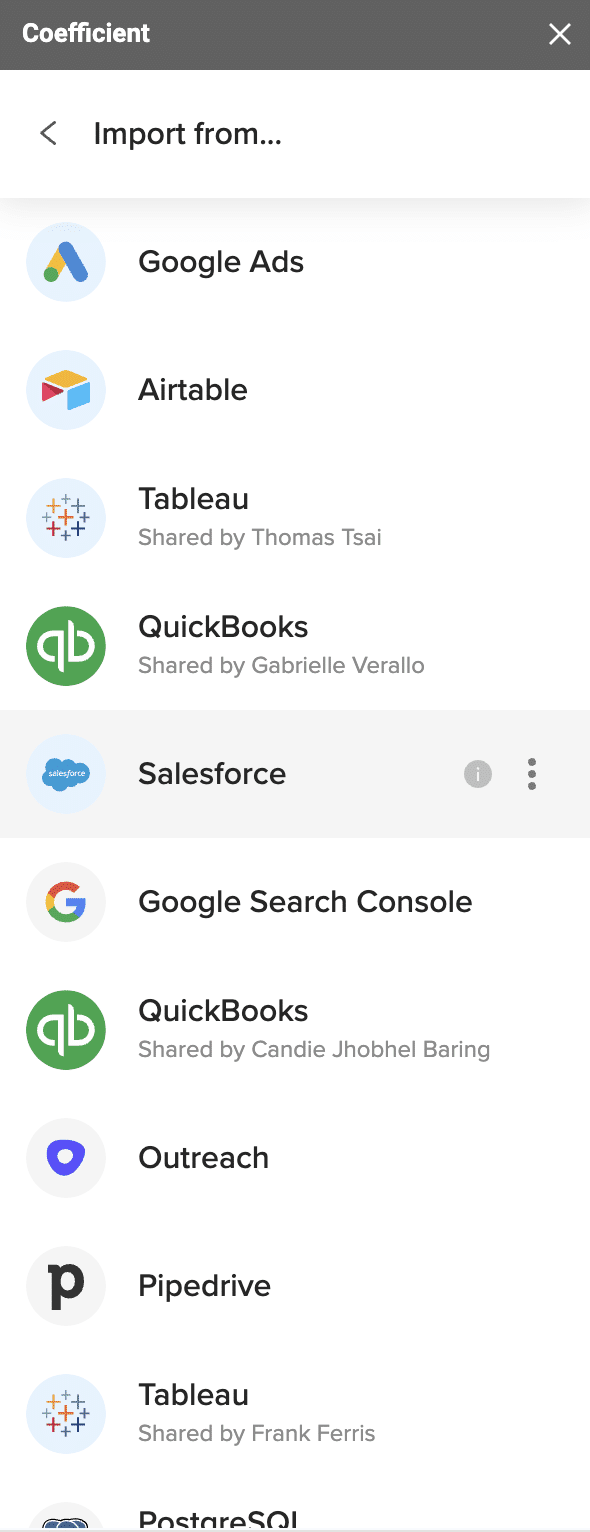
Click ‘Connect to Salesforce’ from the Coefficient menu on the right-hand side of your spreadsheet. 
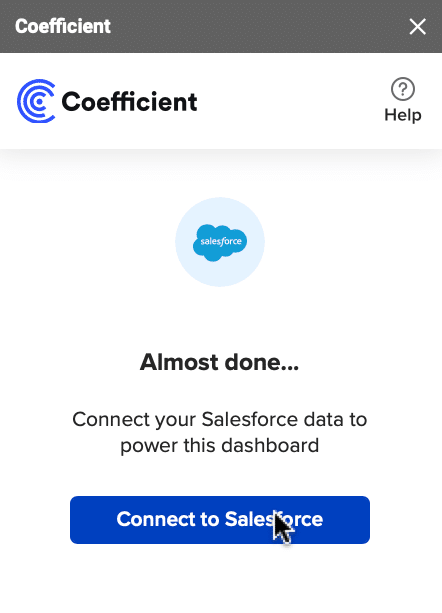
Using Coefficient menu to connect to Salesforce account from a spreadsheet.

Follow the prompts to authorize Coefficient to your Salesforce account.
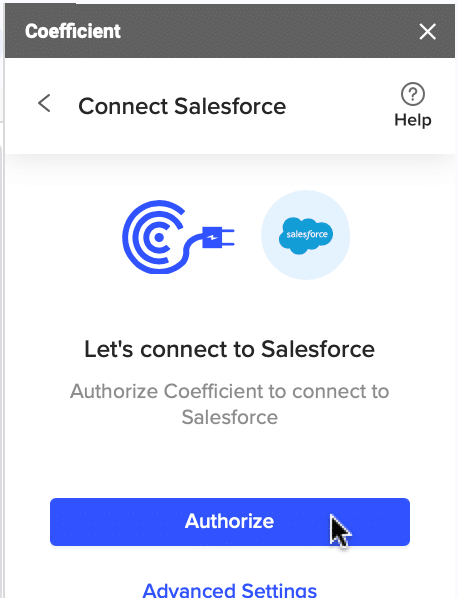
Authorizing Coefficient access to Salesforce account through spreadsheet prompts.

If successful, you’ll see the following notification at the top of your spreadsheet. 

Notification showing successful connection to Salesforce in spreadsheet.

To update your data, navigate to the ‘Salesforce Import’ tab of your spreadsheet and click ‘Refresh.’
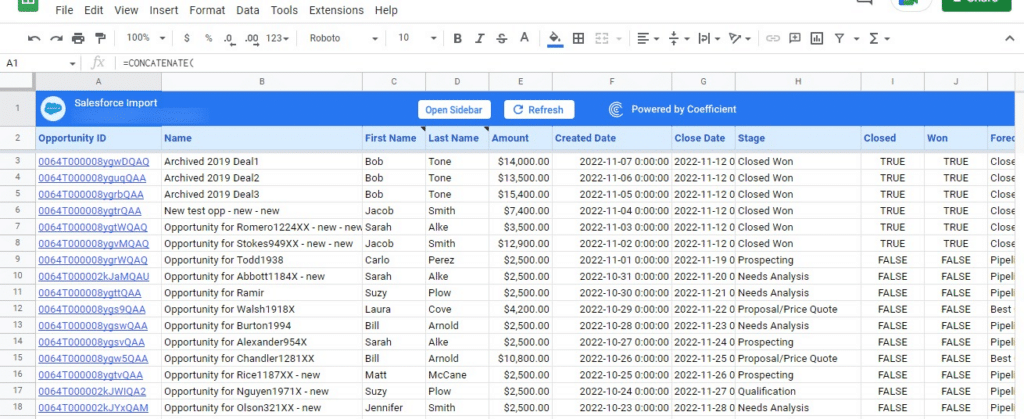
Navigating to Salesforce Import tab in spreadsheet to refresh data.

You can also auto-refresh your data by clicking ‘Set Refresh Schedule.’ 
 clicking ‘Set Refresh Schedule.’

Set up an hourly, daily, or weekly auto-refresh schedule, and Coefficient will automatically update your data based on that time interval.
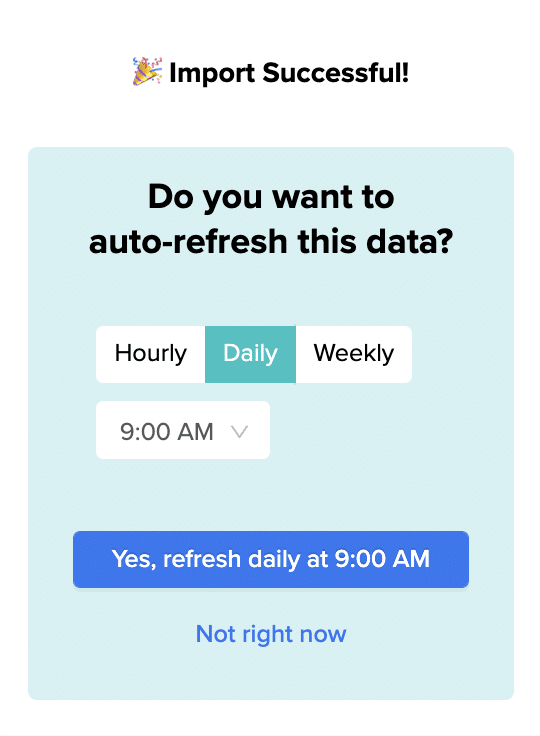
Setting auto-refresh schedule from the Coefficient menu in a spreadsheet.

Set up an hourly, daily, or weekly auto-refresh schedule, and Coefficient will automatically update your data based on that time interval.

Step 3. Customize Your Dashboard

Tailor the template to your organization’s unique needs by navigating to the ‘Settings’ tab. 

Tailor the template to your organization's unique needs by navigating to the 'Settings' tab. 

Company Information 

Customize your company information, pipeline coverage ratios, pipeline stages, and team member details for a more personalized analysis.
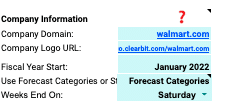
Customizing company information on Coefficient's dashboard for personalized analysis.

Personalize your dashboard by including your company’s domain URL, logo, and the start of your fiscal year. This ensures that the data and insights are specific to your organization and aligned with your financial reporting periods.

Pipeline Coverage Ratios 

Fine-tune your pipeline coverage ratios based on your historical win rates. 

Adjusting pipeline coverage ratios based on historical win rates in Coefficient.

These ratios help you determine the number of opportunities needed in your pipeline to meet your sales targets, ensuring that you have a sufficient volume of potential deals to achieve your goals.

Pipeline Stages 

Customize the pipeline stages in the template to mirror those in your Salesforce setup. 
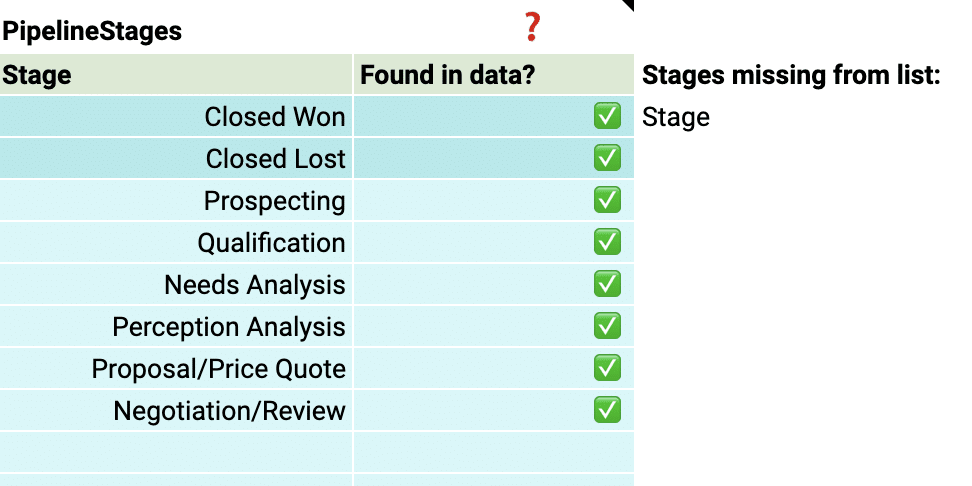
Customizing pipeline stages in Coefficient template to match Salesforce setup.

By aligning the stages in the dashboard with your sales process, you can gain accurate insights into the performance and velocity of your pipeline at each stage.

Team members 

Add details about your sales team members to the dashboard for a more personalized analysis. 

This allows you to track individual performance, identify top performers, and pinpoint areas where team members may need additional support.
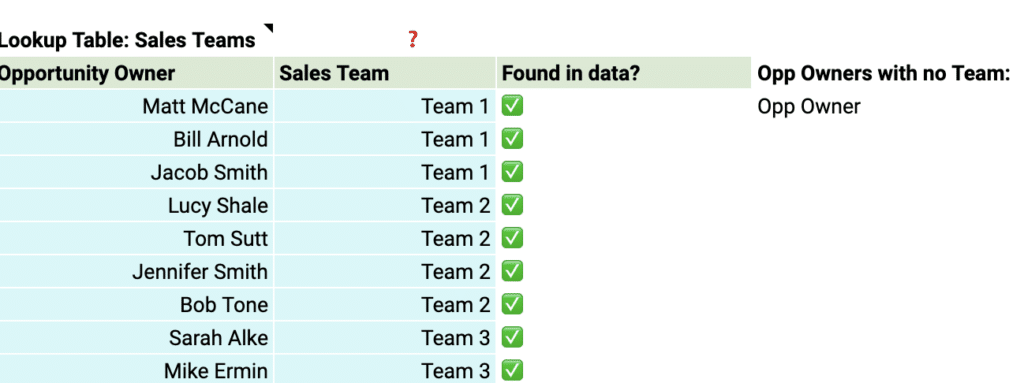
With just a few simple customizations, you can transform the Pipeline Analysis Dashboard Template into a powerful tool tailored to your organization’s specific needs. 

Deep Dive: Coefficient’s Sales Pipeline Analysis Templates

Coefficient’s Pipeline Analysis Dashboard provides two powerful dashboards that give you a comprehensive view of your sales pipeline: the Sales Pipeline Analysis dashboard and the Sales to Target dashboard. 

Let’s dive into how these dashboards can help you optimize your sales process and drive revenue growth.

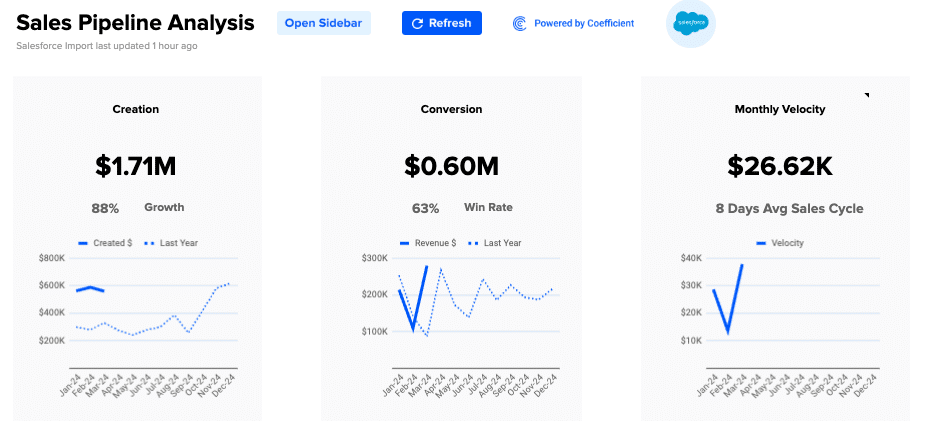
The Sales Pipeline Analysis Dashboard 
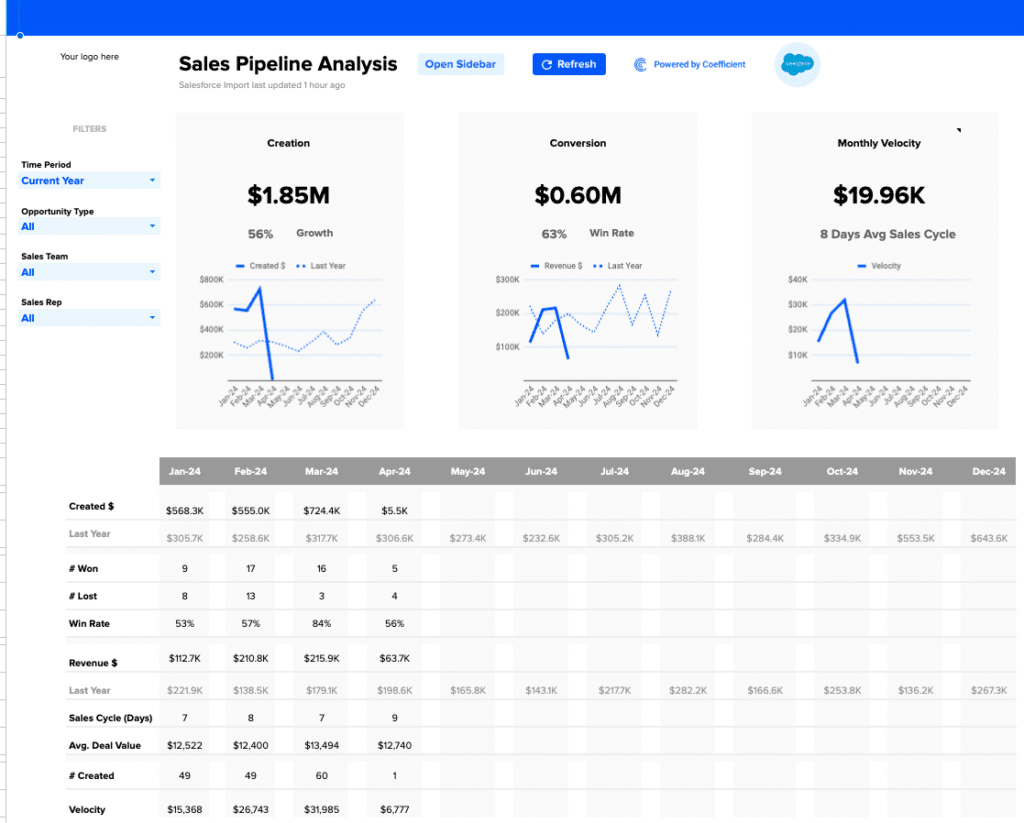
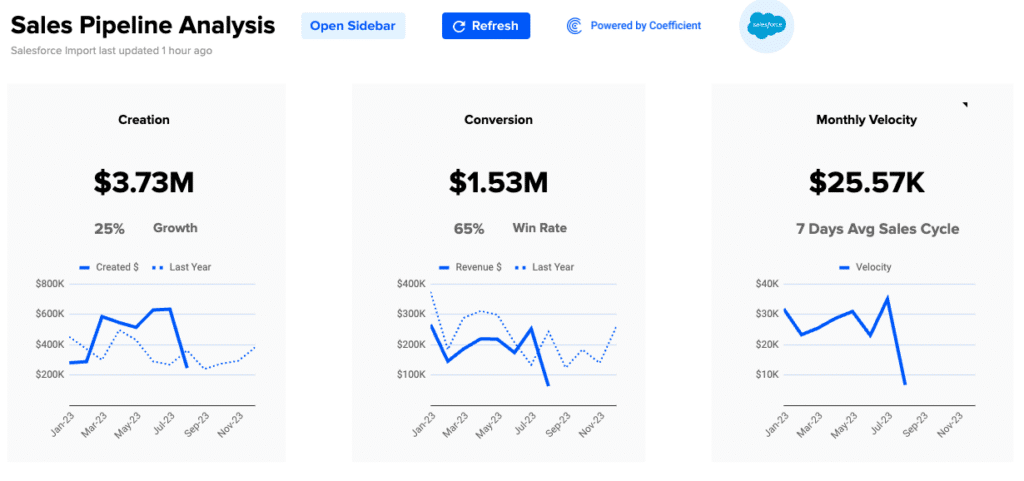
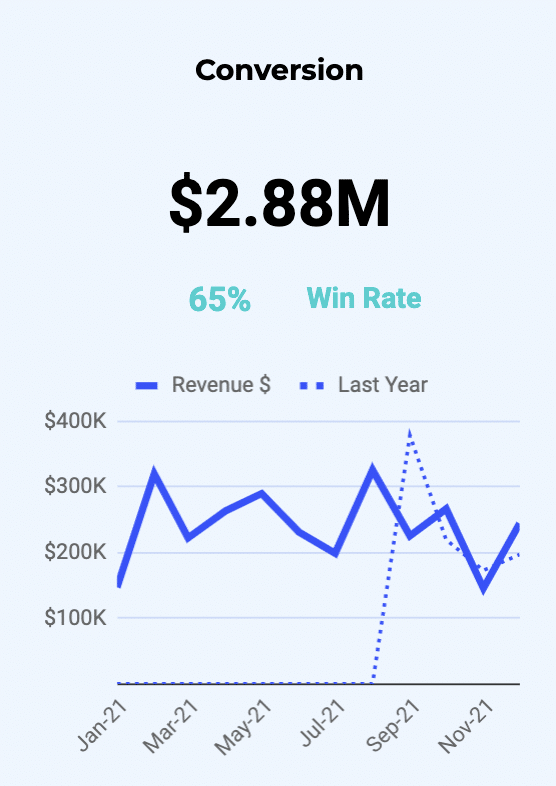
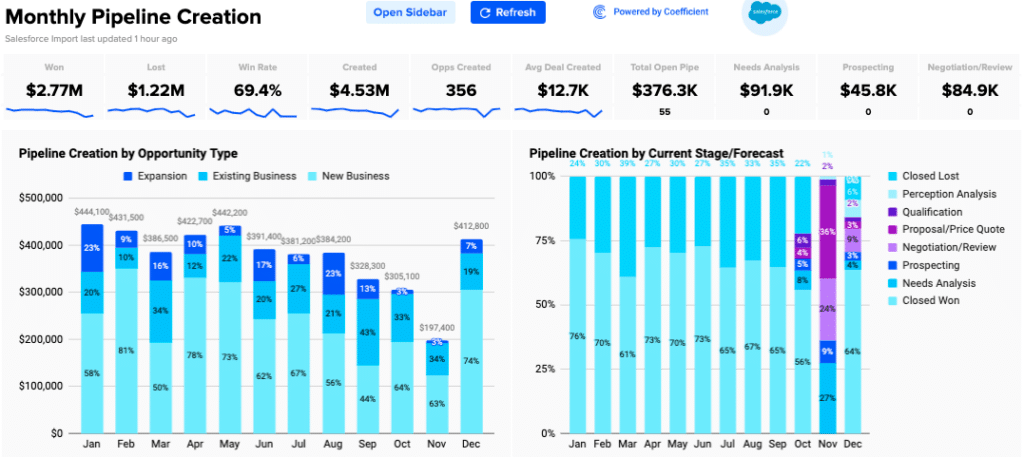
View of the Sales Pipeline Analysis dashboard provided by Coefficient for tracking sales metrics.
  • Understand pipeline creation trends: Track the amount of pipeline generated each month and compare it to the previous year’s performance. This allows you to identify growth trends and seasonality in your pipeline generation.
  • Evaluate pipeline conversion effectiveness: Monitor the percentage of pipeline that converts to won deals each month and compare it to the previous year. Use this insight to assess the health of your sales process and identify areas for improvement.
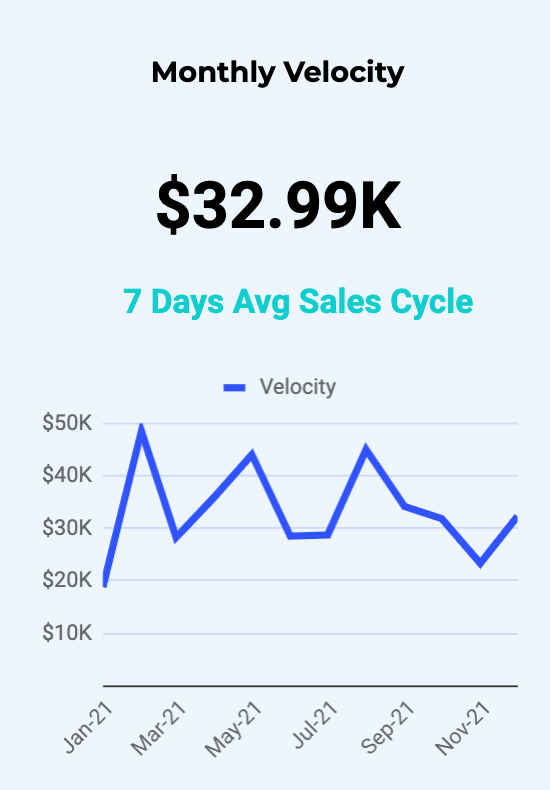
  • Optimize your sales cycle: Keep an eye on the average number of days it takes for a deal to move through your sales cycle each month. This metric, known as sales velocity, helps you identify bottlenecks and optimize your sales process for faster closes.
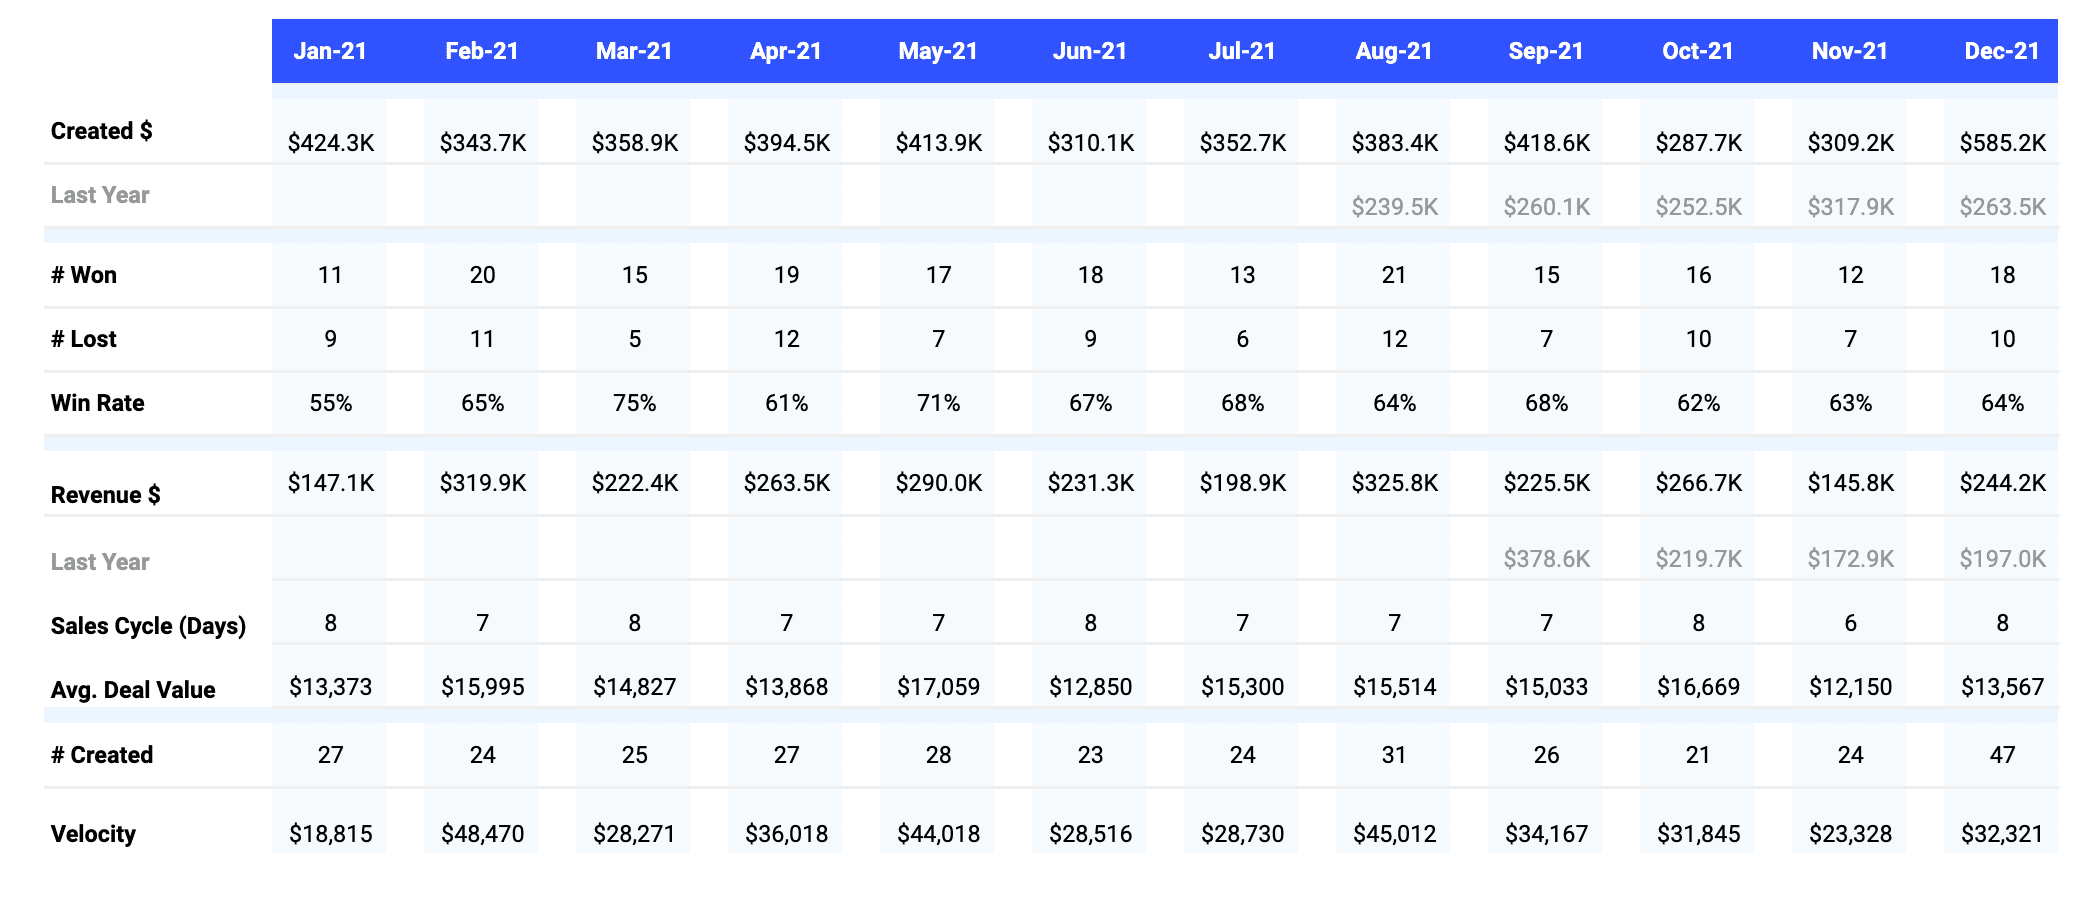
  • Perform in-depth pipeline analysis: Dive into the granular revenue operations data provided in the table beneath the graphs. This detailed data on pipeline creation, conversion rates, revenue, sales cycle length, deal value, and more allows you to pinpoint specific areas for improvement and take targeted action.

The Sales to Target Dashboard
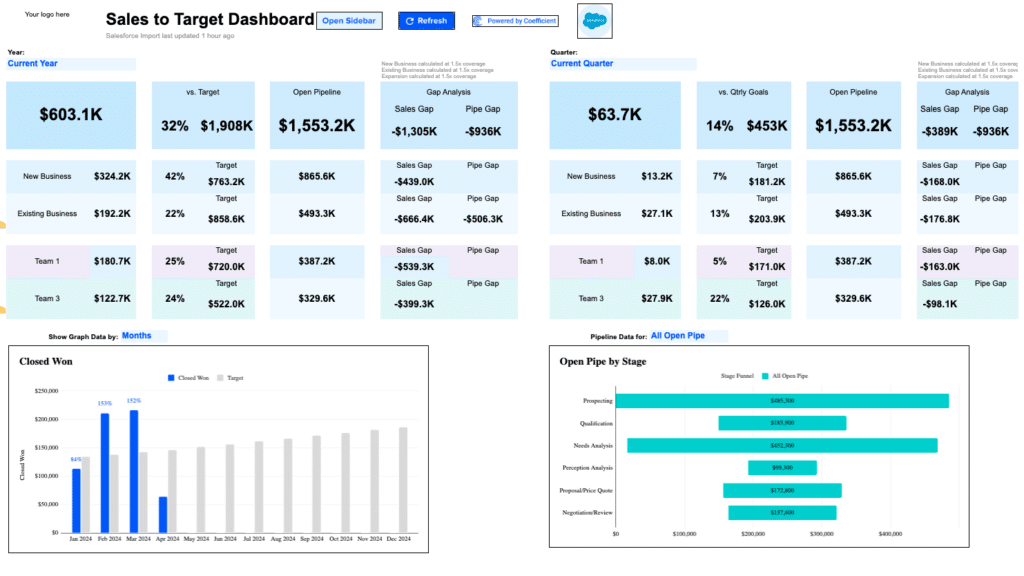
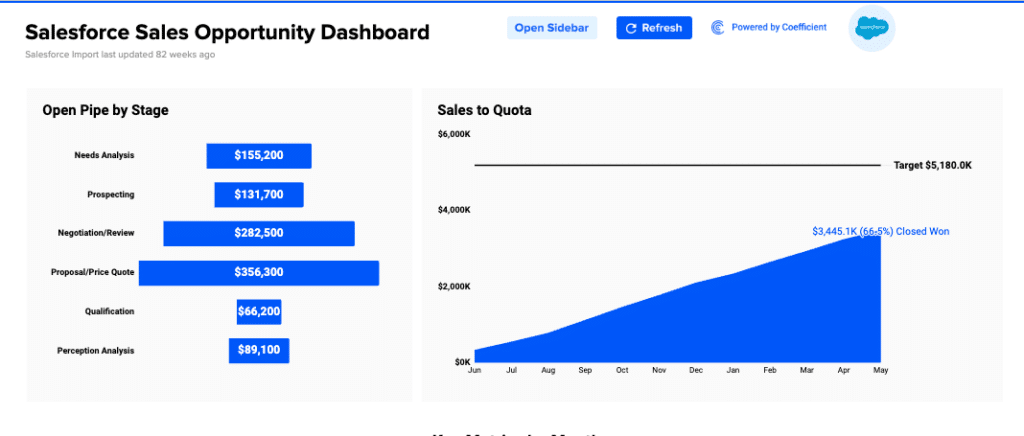
Overview of the Sales to Target dashboard in Coefficient highlighting goal progress.
  • Monitor performance against targets: Quickly see how you’re performing against your targets for key metrics like revenue, new business, existing business, and team-level performance. This at-a-glance view helps you stay on track and identify areas that need attention.
  • Identify the sales gap: Compare your actual sales performance to your targets and see the gap between the two. This insight helps you prioritize efforts to close the gap and hit your goals.
  • Ensure sufficient pipeline coverage: Check if you have enough open pipeline to meet your targets. The “Gap Analysis” section shows you the difference between your current open pipeline and the amount needed to reach your goals, informing your prospecting efforts.
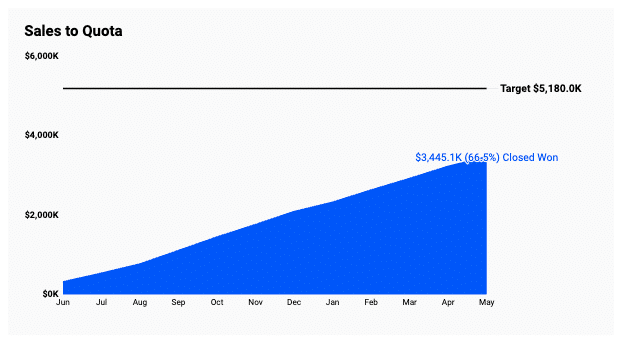
  • Monitor closed won deals: Track your progress towards hitting revenue goals by keeping an eye on the amount of closed won business each month compared to your targets. This graph helps you identify trends and make data-driven decisions.
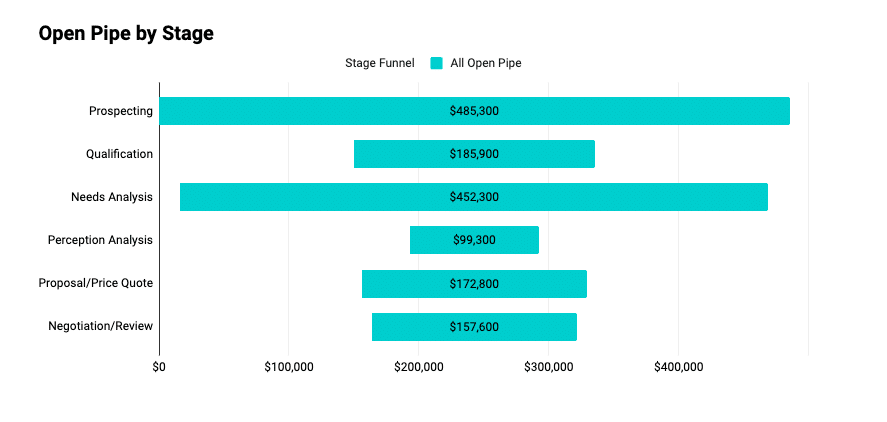
  • Analyze pipeline composition: See how your open pipeline is distributed across each stage of your sales process. This breakdown helps you identify where deals are getting stuck, so you can allocate resources effectively and improve your forecasting accuracy.

What is the Ideal Pipeline Coverage Ratio for B2B?

While there’s no one-size-fits-all answer, the overarching goal is predictability. Sales managers and leaders aim for a figure that ensures consistent achievement of revenue goals every sales cycle.

Effective pipeline management is the cornerstone of accurate sales forecasting, allowing for strategic adjustments to ensure sales goals are consistently met.

What is 3x Pipeline Coverage or 4x Pipeline Coverage?

A 3x pipeline coverage ratio indicates that the total value of opportunities in the pipeline is three times the sales quota, while a 4x pipeline coverage suggests that the total value is four times the sales quota.

Understanding pipeline coverage goes beyond these benchmarks. It’s about recognizing the nuances and intricacies of the sales cycle.

How Does Pipeline Coverage Influence Our Sales and Forecasting Strategies?

Effective pipeline management is foundational for accurate forecasting. It’s about gauging where you stand in relation to your sales goals. By being vigilant about sales forecasts, strategies can be quickly adjusted to ensure revenue targets are achieved.

How to Track Sales Pipeline Coverage Accurately?

Sales Pipeline Coverage Templates

Monitoring pipeline coverage accurately requires the integration of robust tools such as HubSpot and Coefficient. These platforms help salespeople bridge gaps in their reporting, track pipeline metrics accurately and consistently, ensuring everything you need to know is at your fingertips.

Checkout Coefficient’s free Sales Pipeline template!

5 Common Missteps in B2B Pipeline Management

1. Over-Reliance on a Few Big Deals

In B2B sales, it’s tempting to focus on a handful of high-value deals, thinking they’ll be the ticket to meeting quotas. However, this strategy can be a double-edged sword.

While big deals can significantly boost revenue, putting all your eggs in one basket can jeopardize predictability. It’s essential to diversify the pipeline with various deal sizes, ensuring a more stable and predictable sales outcome.

2. Sales and Marketing Misalignment

A common pitfall in many organizations is the disconnect between marketing teams and sales teams. Each department might be operating with different objectives, leading to disjointed efforts and missed opportunities.

To ensure a seamless sales process, it’s crucial for both teams to have aligned goals, collaborate closely, and share insights. This alignment can bridge the gap and drive more cohesive pipeline management strategies.

3. Poor CRM Hygiene

A sales pipeline management tool or CRM, like Salesforce, is the backbone of effective pipeline management. However, its efficacy diminishes if not regularly updated. Outdated or incorrect data can lead to missed opportunities and misinformed strategies.

To maximize the benefits of a CRM, sales reps should be diligent in maintaining its hygiene, ensuring that all data is current and accurate.

4. Inconsistent Follow-Ups

The importance of consistent communication in sales cannot be overstated. Without a structured follow-up process, potential clients might slip through the cracks, leading to missed opportunities or even a loss of trust.

Implementing a consistent follow-up schedule, aided by CRM reminders, can ensure timely communication, nurturing leads towards becoming closed deals.

5. No Lead Nurturing

Focusing solely on leads that appear ready to buy can be a short-sighted approach. Many qualified leads might need more time, information, or persuasion before they’re ready to commit.

 Neglecting these leads means potentially losing out on deals that, with a bit more effort, could have been sealed. A robust lead nurturing strategy, involving regular check-ins and content sharing, can warm up these leads, increasing their likelihood to convert.

6. Over-Optimism

Setting ambitious sales targets can be motivating for sales reps. However, being overly optimistic can backfire. If sales targets are consistently unrealistic and unmet, it can demoralize the sales team and skew pipeline management strategies.

It’s essential to set realistic targets based on past performance, market conditions, and current capabilities, ensuring that they’re both challenging and achievable.

9 Strategies to Boost Pipeline Coverage in B2B Sales

Our experts recommend a combination of lead generation and enablement tactics to enable optimal sales efficiencies. The importance of automation and pricing adjustments is also highlighted, along with an emphasis on refining the sales process and improving conversion rates.

Let’s dive into each.

1. Enhanced Prospecting

To effectively reach the right audience, it’s essential to harness the power of intent data. Engaging in social selling, employing lead scoring, and utilizing targeted remarketing can further refine your prospecting efforts, ensuring you’re connecting with potential clients who are genuinely interested.

2. Referrals: Building Trust through Existing Connections

Referrals are a goldmine in B2B sales. By leveraging satisfied customers and partners, you can expand your network and tap into high-quality leads that come with an inherent level of trust.

3. Affiliate Programs & Partnerships: Collaborating for Growth

Establishing meaningful partnerships, especially with consultants, can open doors to new opportunities. By leveraging their networks and expertise, you can amplify your reach and tap into new customer bases.

4. Cross-Selling and Upselling: Maximizing Existing Relationships

Your existing customer base is a treasure trove of opportunities. By identifying areas for cross-selling and upselling, you can not only increase your sales quota but also solidify and deepen your relationships with clients.

5. New Market Expansion: Diversifying Sales Territories

Expanding into new regions or industries can be a strategic move to diversify your sales territories. This approach not only spreads risk but also uncovers fresh revenue streams, ensuring sustained growth.

6. Channel Experimentation: Broadening Sales Strategies

Diversifying your sales strategies can lead to unexpected success. If you’ve been primarily focused on either inbound or outbound tactics, consider blending the two. This hybrid approach can reach a broader audience and bring in diverse leads.

7. Better Sales Training: Investing in Your Salespeople

Your sales team is only as good as their training. By equipping them with the latest strategies, tools, and insights, you’re investing in their success, boosting your company’s performance.

8. Improving Sales Enablement: Streamlining the Sales Process

A well-equipped sales team is a successful one. Streamlining the sales process by providing your team with the necessary resources, tools, and information ensures they can close deals efficiently and effectively.

9. Thought Leadership: Establishing Market Authority

Positioning your brand as a thought leader can set you apart in a crowded market. Collaborate with recognized industry entities like Forrester, G2, and McKinsey to bolster your brand’s authority and trustworthiness.

Weighted vs. Unweighted Sales Pipeline

Both the weighted and unweighted sales pipelines are crucial metrics that businesses use to predict future sales and revenue. However, they approach this prediction from different perspectives.

By comparing the unweighted and weighted sales pipelines, businesses can gain insights into the quality of their leads and the effectiveness of their sales strategy. The disparity between the two values can also shed light on potential challenges in the sales cycle and areas for improvement.

How is the Unweighted Sales Pipeline Calculated?

An unweighted sales pipeline simply adds up the value of all deals in the pipeline, irrespective of their stage or likelihood of closing.

  1. List all active deals: Begin by listing out all the deals currently in your pipeline.
  2. Assign a value to each deal: This is typically the potential revenue from each deal.
  3. Sum up the values: Add together the values of all the deals.

Example:

  • Deal A is worth $10,000
  • Deal B is worth $15,000
  • Deal C is worth $5,000

Unweighted Sales Pipeline = Deal A + Deal B + Deal C = $30,000

How is the Weighted Sales Pipeline Calculated?

The weighted sales pipeline takes into account the stage of each deal and assigns a probability to each stage. This provides a more realistic view of the potential revenue, as not all deals will close.

  1. List all active deals: As with the unweighted pipeline, start by listing all deals.
  2. Assign a value to each deal: Determine the potential revenue from each deal.
  3. Assign a closing probability to each deal: Based on the deal’s stage in the sales funnel. For instance, a deal in the “Prospect” stage might have a 10% chance of closing, while one in the “Negotiation” stage might have an 80% chance.
  4. Multiply the deal value by its closing probability: This gives you the weighted value of each deal.
  5. Sum up the weighted values: Add together the weighted values of all the deals.

Example:

  • Deal A is worth $10,000 and is in the “Prospect” stage with a 10% closing probability. Weighted value = $10,000 * 0.10 = $1,000
  • Deal B is worth $15,000 and is in the “Negotiation” stage with an 80% closing probability. Weighted value = $15,000 * 0.80 = $12,000
  • Deal C is worth $5,000 and is in the “Proposal” stage with a 50% closing probability. Weighted value = $5,000 * 0.50 = $2,500

Weighted Sales Pipeline = $1,000 + $12,000 + $2,500 = $15,500

Master Pipeline Coverage for Predictable Sales

By following the pipeline coverage best practices outlined in this guide, businesses can ensure a more streamlined, efficient, and effective sales process. These strategies not only provide clarity on the journey from prospect to profit but also make it more predictable and manageable.

Try Coefficient for free today to see how it can streamline your pipeline coverage analyses and more.

About the Experts

Emerson McCuin, RevOps Manager at HAAS Alert: 

Emerson is a seasoned RevOps professional with a passion for CRM and automation tools like HubSpot. With a keen focus on collaborating with GTM leaders, Emerson’s expertise lies in strategizing around goals, KPIs, and action plans. He’s an active member of the RevOps community, sharing insights and knowledge to elevate businesses by optimizing expenses and costs and maximizing revenue. (LinkedIn)

Saahil Dhaka, Founder and CEO, Clientell:

Saahil is an entrepreneur dedicated to helping business leaders harness the power of machine learning for smarter decision-making. With a background spanning startups to AI in sales, he offers a scientific approach to sales processes and pipeline management. Saahil is passionate about crafting competitive GTM strategies that give revenue teams an edge. (LinkedIn)

Cody Kimball, RevOps and GTM Leader, Entrata: 

With over a decade of experience in data and technology, Cody is a corporate development leader specializing in analytics, operations optimization, and preparing organizations for enterprise growth. He’s adept at aligning organizations with business processes backed by relevant KPIs. Cody’s strengths encompass data analytics, leadership, and brand cultivation. He’s known for bridging the gap between technical and business aspects, ensuring seamless integration of technology, strategy, and operations. You can tap on his skills at getthedataguy.com (LinkedIn)
Comparing Best Free and Paid Sales Pipeline Management Tools

Navigating the intricacies of the sales process can be daunting for even the most experienced SalesOps professionals. With numerous touchpoints in the sales cycle and the need to align various stakeholders, it’s easy to feel overwhelmed.

Sales pipeline management is the glue that holds these moving parts together, helping to ensure leads and opportunities don’t slip away.

Fortunately, the right sales pipeline management tool not only tackles these challenges but also streamlines the entire sales process. These solutions will help SalesOps professionals monitor sales activities, ensuring a smooth journey from lead generation to closed deals.

This blog will give a complete breakdown of the most popular sales pipeline management solutions out there.

Let’s dive in!

What Are Sales Pipeline Management Tools?

Sales pipeline management tools are software solutions that give Sales leadership full-funnel visibility, allowing them to optimize strategies, accelerate lead management, and more.

Most sales pipeline management software includes these features:

  • Task management
  • Workflow automation
  • Sales analytics
  • Reports and dashboards
  • Lead scoring
  • Customer profile
  • Third-party integrations
  • Remote data access

Top 5 Paid Sales Pipeline Management Tools

HubSpot CRM

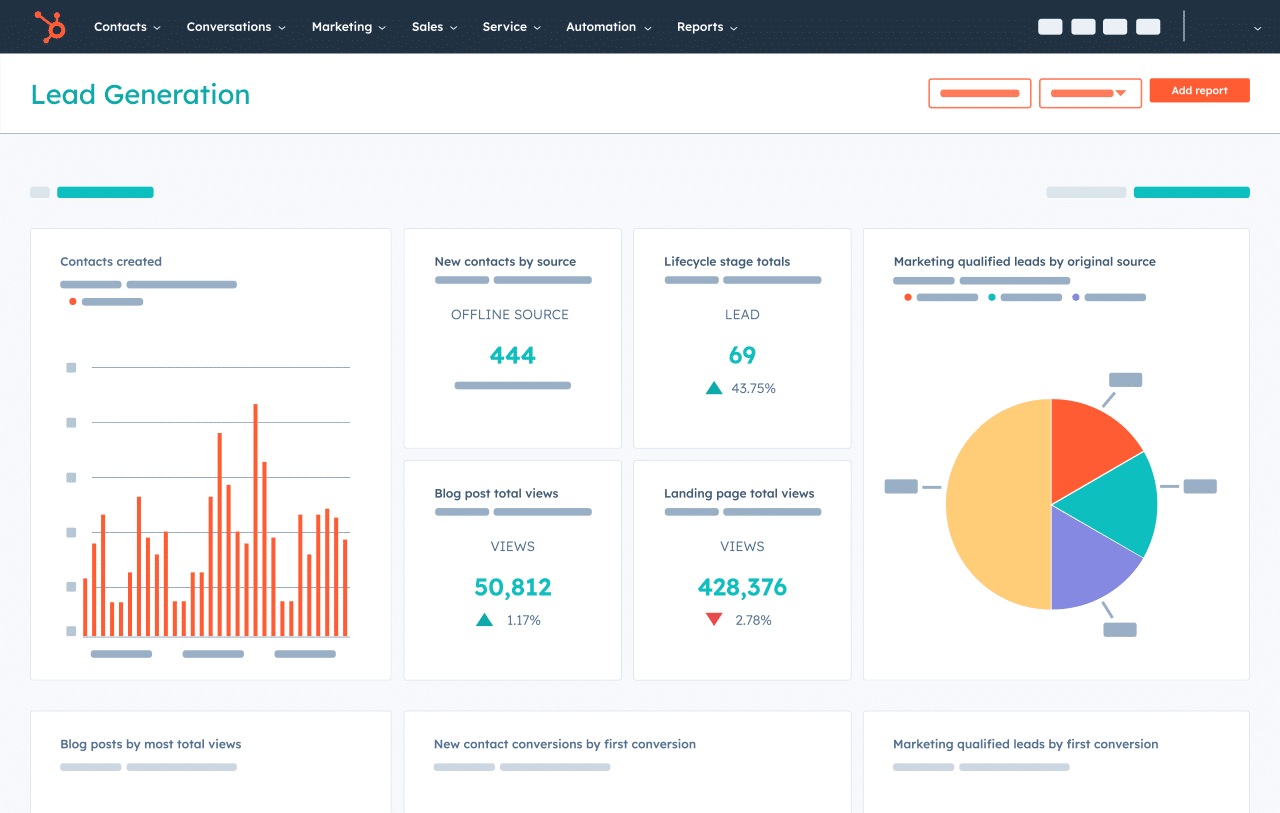
HubSpot is a popular, comprehensive CRM system with features that unify your customer service, marketing, and sales teams.

HubSpot is a popular, comprehensive CRM system with features that unify your customer service, marketing, and sales teams. It has everything you need to streamline every stage of your sales pipeline, like the meeting scheduler, website builder, sales tracking, and reporting.

Pros

  • Robust functionalities. Experience the convenience of real-time reporting, live chat, meeting scheduler, and email tools without spending a single dime.
  • Automation features. Speed up the buyer’s journey through pipeline stages with automated follow-up emails and a chatbot for booking meetings, providing customer support, and more.
  • App Marketplace. Create a unified software ecosystem by connecting HubSpot with your existing tools, including landing page builders, ticketing solutions, and email marketing platforms.
  • Flexible pricing. HubSpot CRM lets you create your own HubSpot products and add-ons bundle tailored to your specific needs.

Cons

  • Minor slowdowns. Users may experience unexpected delays and slowdowns when performing certain tasks, like connecting calls to mobile devices or logging in.
  • Steep learning curve. Although HubSpot’s core CRM solution is user-friendly, using it alongside other HubSpot products and integrations can initially be challenging.

G2 Reviews Around HubSpot CRM

Functionality, ease of use, the education that HubSpot provides for new sales team members.”

Luke S., Small Business (50 or fewer employees)
“One of the key benefits of HubSpot is its comprehensive suite of tools, which includes marketing automation, customer relationship management, sales, and service modules.”

– Ines O., Small Business (50 or fewer employees)

Salesforce CRM

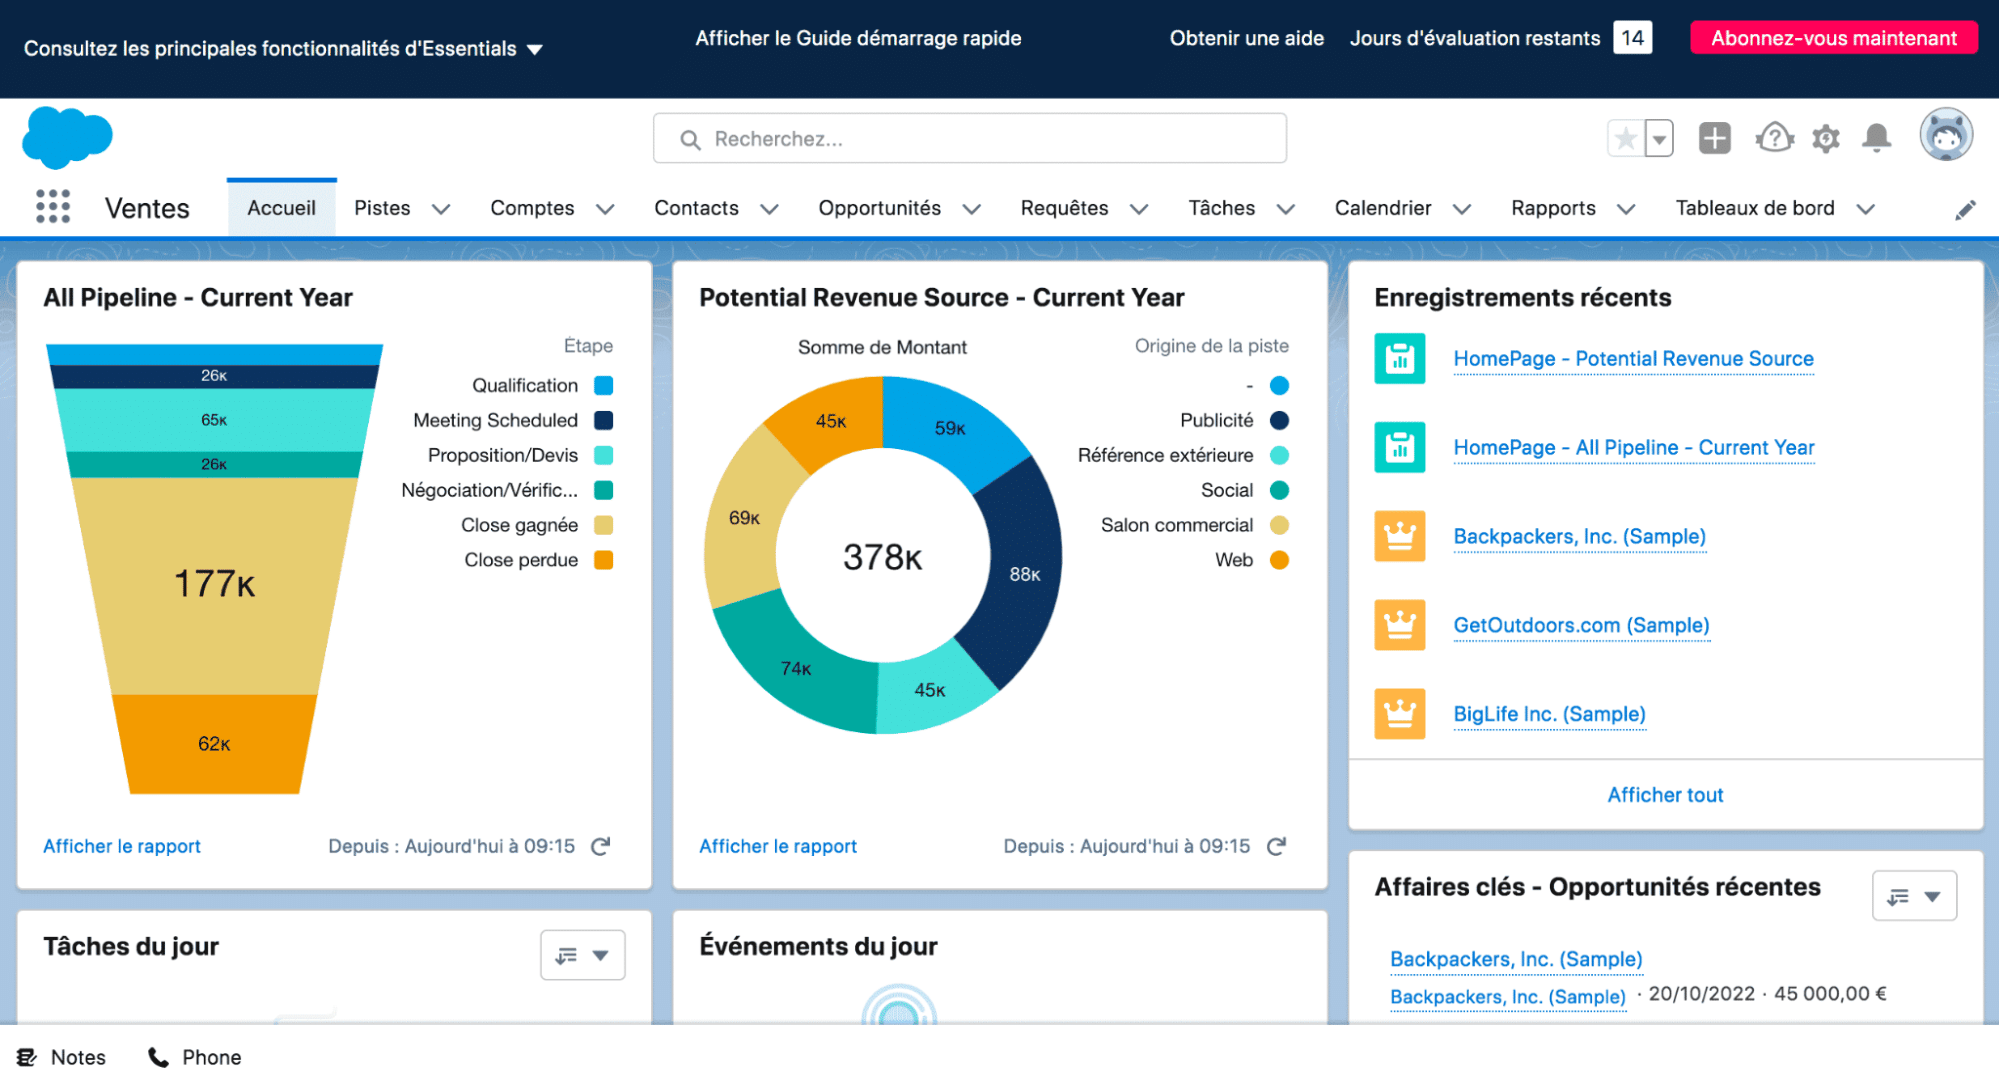
Salesforce is a trusted CRM platform that consolidates all customer-facing activities—from digital marketing to customer service.

Salesforce is a trusted CRM platform that consolidates all customer-facing activities—from digital marketing to customer service. It’s designed to maximize the productivity of your sales and marketing teams, maximizing revenue while reducing customer churn.

Pros

  • Collaboration features. Augment sales enablement with a strong lineup of collaboration tools for your salespeople.
  • Extensive customization. Streamline your sales pipeline management by customizing the Salesforce CRM with custom fields, web forms, and more.
  • Automation features. Similar to HubSpot, Salesforce comes with automation features for redundant admin work and customer interactions.
  • Cross-platform productivity. Use the Salesforce mobile app to access the dashboard, respond to messages, and collaborate with your team on the go.

Cons

  • Technical issues. Due to the level of customization that businesses can achieve, Salesforce users may experience problems with certain features like macros, quoting, and other dashboard tools.
  • Cumbersome reporting interface. Although powerful, Salesforce CRM’s reporting feature takes some time to learn and use proficiently.

G2 Reviews Around Salesforce CRM

“Creating and sharing dashboards on the performance of a particular service area is easy, helping us monitor the pipeline of opportunities in real-time.”

Rayaprolu V., Mid-Market (51-1,000 employees)

Salesforce Sales Cloud gives our internal teams a platform to collaborate and provide the best experience to our customers.”

Chris T., Enterprise (> 1,000 employees) 

Pipedrive

Pipedrive’s CRM tool is designed to help brands optimize each customer journey stage and maximize revenue

Pipedrive’s CRM tool is designed to help brands optimize each customer journey stage and maximize revenue. While it’s not as feature-rich as other top-tier CRM software, it allows teams to focus on what matters in customers’ experience.

Pros

  • Clean dashboards. Pipedrive’s clutter-free visual interface centers around sales pipeline management, maximizing your sales team’s productivity and ease of use.
  • Affordable pricing. Pipedrive’s pricing model offers one of the most affordable subscription plans among paid sales pipeline management solutions.
  • Automation features. Use Pipedrive’s workflow automation features to save time on manual tasks, including lead scoring, revenue forecasting, lead nurturing, and so on.
  • Paid add-ons. Extend the functionality of the Pipedrive dashboard with add-ons for lead communications, visitor analysis, and campaign management.

Cons

  • Limited integrations library. Although Pipedrive has a respectable integrations count of over 400, it pales in comparison to other platforms that support 1,000+ third-party app integrations.
  • Feature limitations. Due to Pipedrive’s focus on sales pipeline management, it lacks additional features like extended support hours, live chat for end users, and dashboard branding options.  

G2 Reviews Around Pipedrive

“Ultimately, we appreciate Pipedrive for the fact that it delivers great value for the price, at all subscription levels.”

Joseph V., Small Business (50 or fewer employees)

“One does not need a lot of experience to be able to use Pipedrive and create contacts, leads, deals, or a sales pipeline.”

Brendan K., Small Business (50 or fewer employees)

Insightly

Insightly is a scalable CRM platform that simplifies lead tracking, collaboration, and reporting within a modernized cloud dashboard

Insightly is a scalable CRM platform that simplifies lead tracking, collaboration, and reporting within a modernized cloud dashboard. One of its strongest suits is usability, but the platform doesn’t skimp on sales pipeline management features.

Pros

  • Low pricing. Insightly offers cost-effective pricing across all subscription plans even with advanced features like custom validation rules, unlimited file storage, and AppConnect integration.
  • Automation features. Take advantage of complete workflow automation for activities like sales emails, follow-ups, task creation, and more.
  • User-friendly interface. Insightly CRM is highly praised for its streamlined and easy-to-learn user interface, allowing your internal teams to jump into action in virtually no time.
  • Build your Insightly package from scratch. Combine specific Insightly products that match your business needs, be it for CRM, customer service, marketing, or a combination of these areas.

Cons

  • Lack of customization options. While the default Insightly dashboard is built with user-friendliness in mind, the limited customization options prevent businesses from optimizing their experience for maximum productivity.
  • Automation update issues. Automation workflows may change or stop working completely upon installing software updates to Insightly.  

G2 Reviews Around Insightly

“This platform provides a complete solution that caters to our every need, making it a valuable asset for our business.”

Ajay Y., Mid-Market (51-1,000 employees)

“One thing I love the most about Insightly CRM is how the projects are structured and how easy it is to find the information we need.”

Esperanca L., Mid-Market (51-1,000 employees) 

Zoho CRM

Zoho CRM combines your marketing, sales, and customer support in a single, powerful platform.

Zoho CRM combines your marketing, sales, and customer support in a single, powerful platform. Its all-in-one approach to sales pipeline management covers everything, including sales enablement, marketing automation, team collaboration, analytics, and process management.

Pros

  • Extensive customization. Get granular control over your CRM, including data entry validity, dashboard filters, custom components, and multi-lingual support.
  • Automation features. Leverage automation workflows to save time on tasks like lead scoring, relationship building, deal management, and more.
  • Omnichannel experience management. Manage customer experiences across all touchpoints, including social media, phone calls, emails, and web portals.

Cons

  • Steep learning curve. The more integrations and customizations your business uses, the harder it is to get familiarized with Zoho CRM’s interface.
  • Problems with specific integrations. Despite its popularity, users may have difficulty integrating certain third-party software into their Zoho CRM ecosystem.

G2 Reviews Around Zoho CRM

“One of the standout attributes of Zoho CRM is its user-friendly interface, which makes it simple for customers to get around and utilize the platform’s features.”

Praveen K., Small Business (50 or fewer employees)

“Zoho One is a good CRM and suite of tools for small businesses that are price-conscious. It’s easy to use for people unfamiliar with CRMs.”

Sharon W., Small Business (50 or fewer employees)

Top 5 Free Sales Pipeline Management Tools

Below are the top five sales pipeline management tools you can use for free.  

Monday.com

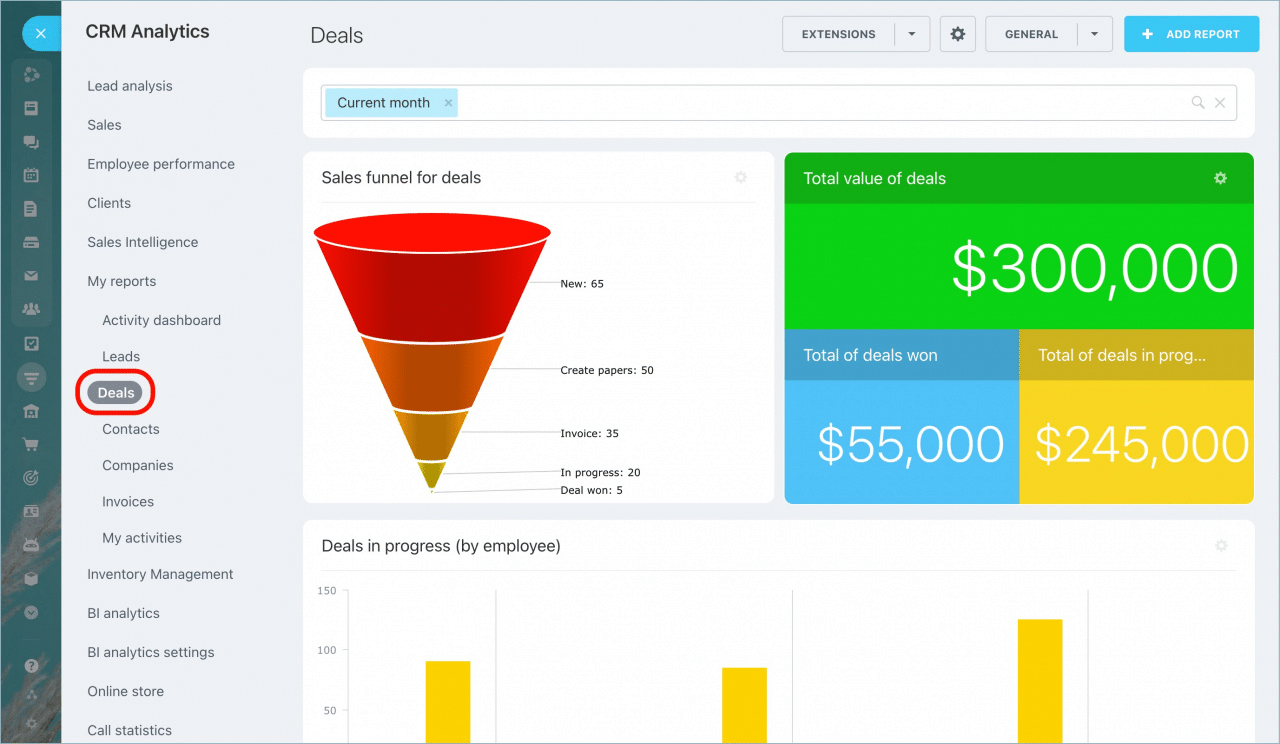
Monday.com is an all-in-one cloud-based platform that lets you create apps to make your workflows, team collaboration, and project management efficient.

Monday.com is an all-in-one cloud-based platform that lets you create apps to make your workflows, team collaboration, and project management efficient.

The platform’s Monday Sales CRM product includes features that help streamline your sales pipeline.

The Sales CRM helps you gather and score leads from multiple sources easily. All the data goes to a Deals board that contains all the pipeline metrics and relevant information you need to manage your pipeline coverage.

Another handy Sales CRM product feature is its automations which reduces your manual and repetitive tasks. For instance, you can configure the CRM to automatically set a deal’s creation date based on when it was added to the board.

Pros

  • Unlimited boards. All Monday sales CRM product plans offer unlimited boards, allowing you to organize your clients, projects, and processes efficiently.
  • Easy Workflow automations. Setting up and implementing the sales pipeline workflow automations is straightforward and user-friendly.
  • 24/7 Customer support. Regardless of the plan you choose, Monday sales CRM provides round-the-clock customer support.

Cons

  • Action limitations. The Monday Sales CRM product restricts the number of actions you can perform each month.
  • Seat limit caps. All the paid plans for Monday Sales CRM mandate a three-seat minimum.

G2 Reviews Around Monday.com

“Monday does the work of at least 3 or 4 individual products and keeps getting better. There are also many integrations, and they keep updating and adding regularly.” — Keith C., Director of Outreach, Small-Business(50 or fewer emp.)

“The automation proved to be immensely valuable as it enabled us to establish a streamlined system within monday.com for managing all our data and I’m really impressed with the update feature.” — Shinoy R., Digital Marketing Specialist, Enterprise(> 1000 emp.)

Bitrix24

Bitrix24 is a free sales pipeline management solution that simplifies and streamlines managing your sales pipeline.

Bitrix24 is a free sales pipeline management solution that simplifies and streamlines managing your sales pipeline. You won’t need to build your sales pipeline management templates from scratch since the tool can automatically create them for you based on your defined sales process stages.

The software’s sales automation features include:

  • Automatic lead assignment
  • Custom workflows
  • Access rights
  • Tasks and projects

Pros

  • Feature-rich. Bitrix offers a plethora of features, from sales pipeline management and CRM solutions to task and project management.
  • Feature-packed free version. Unlimited access to records, leads, contacts, deals, and companies with the free version.

Cons

  • Complex Interface. The user interface can be challenging to navigate.
  • Steep Learning Curve: Especially for newcomers to sales pipeline management and CRM.

G2 Reviews Around Bitrix24

“How easy it is to create automations in the pipeline and also how easy it is to customize our pipeline, being able to go through different products and comprehend the sales process more easily.” — JoĂŁo V., Small-Business(50 or fewer emp.)

“This is a SAAS system and Bitrix24 will take care of all system maintenance and hosting. The best part of the system is employee management and kanban for task management. CRM embeddings for sales, project management, and many other modules are also available.” â€” Thomas B., Project Engineer, Mid-Market(51-1000 emp.)

Capsule CRM

Capsule CRM is a customer relationship management platform that helps you track and manage business relationships with your clients and leads.

Capsule CRM is a customer relationship management platform that helps you track and manage business relationships with your clients and leads. The platform’s sales pipeline management software features allow you to:

  • Track sales opportunities via forecasted sales pipeline value based on total opportunity and probability value.
  • Manage your open sales opportunities on one page and outline your sales plan using a visual sales planner.
  • Create multiple pipelines representing various services, markets, and products. The pipelines give your sales team a more accurate view of your sales process, allowing them to better forecast sales, analyze pipeline easily, tailor your sales cycle to prospects, and close more deals.

Pros

  • User-friendly. Capsule CRM is intuitive and easy to use.
  • Robust integrations. Seamlessly integrates with Microsoft 365, Google Workspace, Xero, and Mailchimp.

Cons

  • Limited security features. Basic security options with restricted user roles and permissions.
  • Lacks marketing automation. Users need to rely on third-party integrations like Zapier for certain automated workflows.

G2 Reviews Around Capsule CRM

“Capsule is an excellent CRM that satisfies all of our requirements. It’s simple to locate and extract contact groups for upload/sort purposes. This software has a clean, simple, and intuitive sales pipeline dashboard.”— Eshrak M., Junior Frontend Developer, Small-Business(50 or fewer emp.)

“This software help pulls together all of our Sales and Marketing efforts. Our intranet business loves using this!” — Rebecca H., Digital Marketing Manager, Small-Business(50 or fewer emp.)

FreeAgent CRM

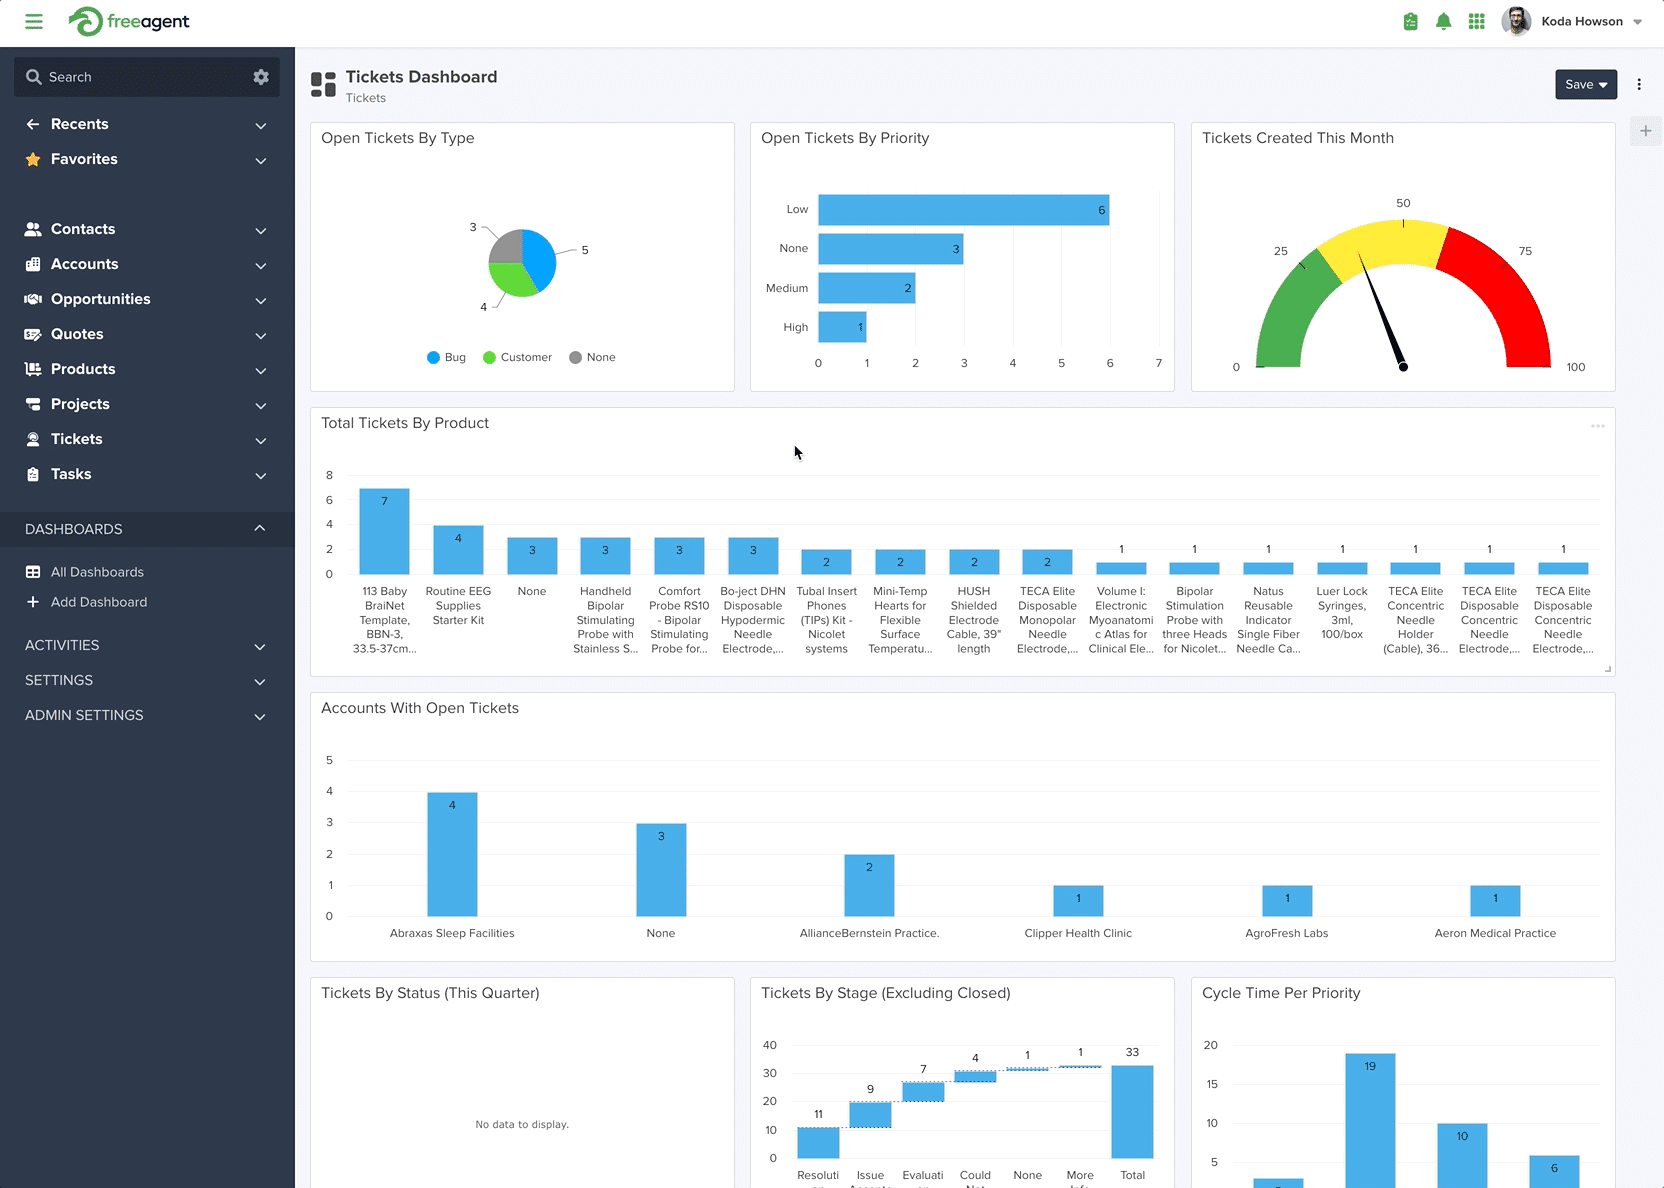
FreeAgent CRM is a CRM platform with features that help your team streamline organizing and gaining visibility into daily tasks.

FreeAgent CRM is a CRM platform with features that help your team streamline organizing and gaining visibility into daily tasks. Its easy-to-use yet powerful sales platform aids your sales team in managing their workflows, allowing them to close more deals.

The platform’s pipeline management solution allows you to do the following:

  • Customize your deal structure, processes, and sales stages.
  • Forecast and pipe reviews that give you necessary insights. The platform’s built-in reporting engine helps you extract insights to drill down into your reports and see the source data.
  • Automatically capture, assign, and follow up leads.
  • Automate your task management and capture team interactions with deals and contacts within the Activity Timeline for easy tracking and assessment.

Pros

  • Workflow automations. Helps teams work faster and smarter with auto-assign task-based triggers for notifications.
  • Comprehensive tracking. Tracks deals, monitors contacts, manages data, and presents projects via automated reporting.
  • Automated lead management. Offers automated lead assignments and follow-ups for improved sales plays.

Cons

  • Not Ideal for Small Teams. The platform’s features might be overwhelming for smaller companies with fewer than ten employees.

G2 Reviews Around FreeAgent CRM

“There are two things. First: their customer service is bar-none, the best i have ever seen. They have a chat option that allows you to get answers within 5 minutes if not sooner. Second: the system so so robust you can work operations, payments and sales seamlessly together.” — Janie W., Platform Development Consultant, Small-Business(50 or fewer emp.)

“Customizable, easy to use and learn the basics with potential to add a lot more later. They show you how and where you can access and control all aspects of the setup.” — Permveer B., Small-Business(50 or fewer emp.)

Freshsales CRM

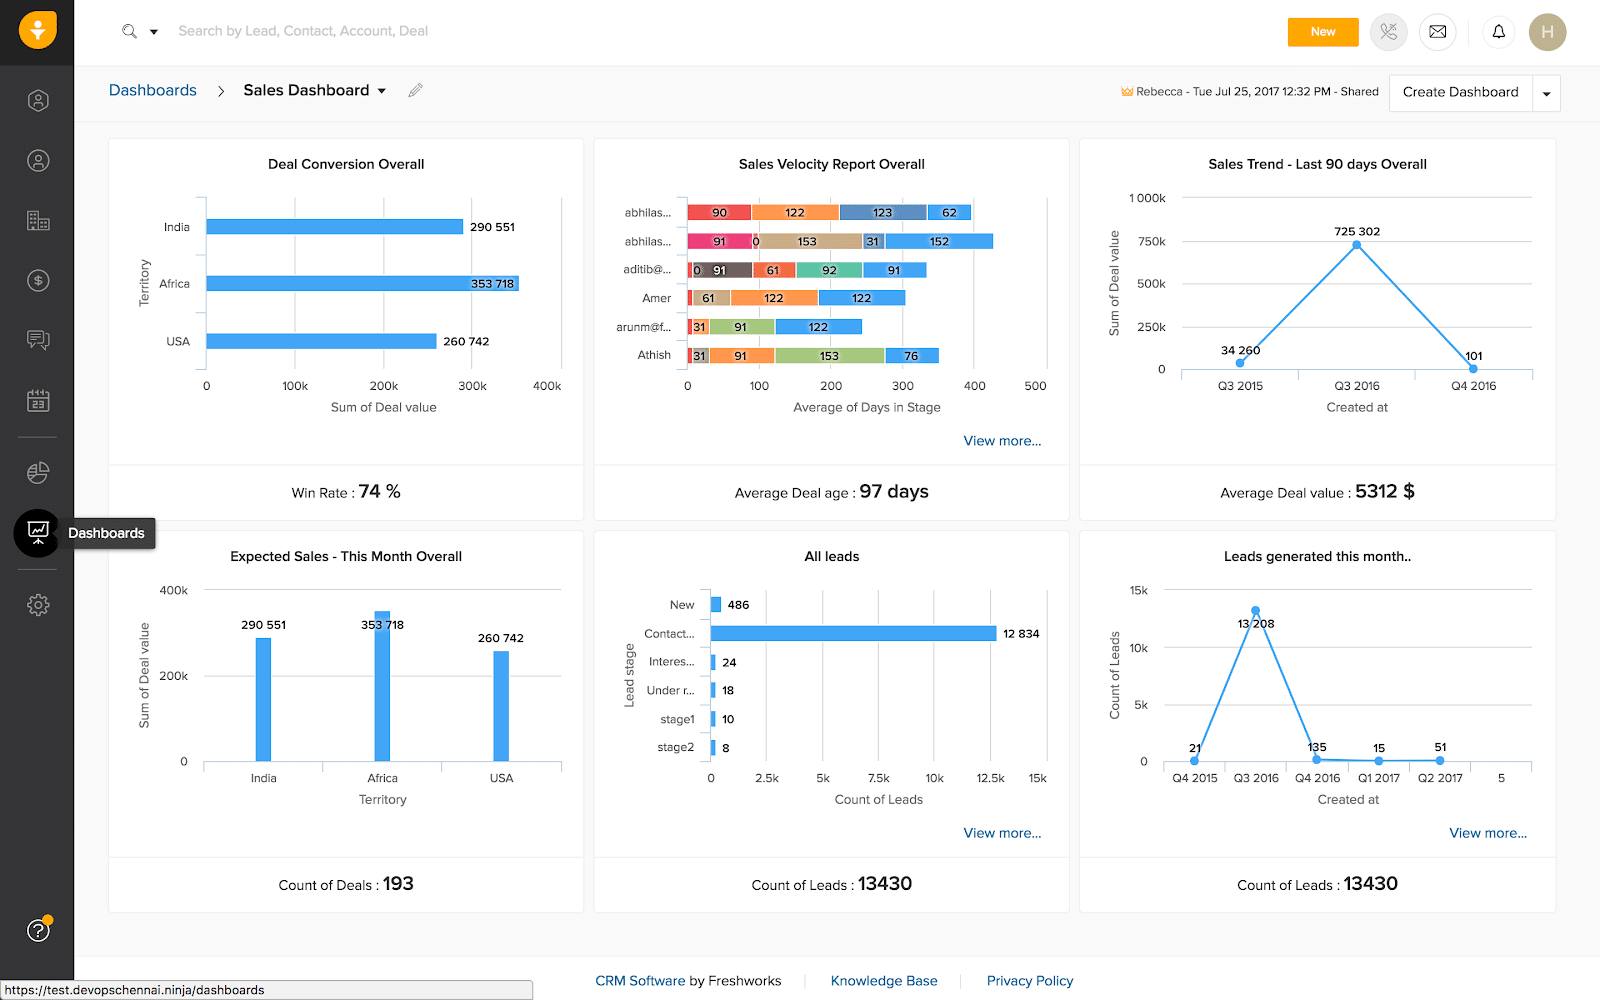
Freshsales CRM is a cloud-based CRM software that is part of Freshworks’ suite of tools that integrate seamlessly

Freshsales CRM is a cloud-based CRM software that is part of Freshworks’ suite of tools that integrate seamlessly. The software is known for its customization options, AI-powered contact and deal scoring functionalities, and built-in phone features.

The Freshsales CRM Sales Intelligence feature allows you to:

  • Spot and prioritize your most sales-ready prospects based on scores assigned by Freddy AI.
  • Leverage the Freddy AI insights based on historical engagement, activities, and sales data to predict deal closure.
  • Use Freddy AI’s smart suggestions to manage calendars, set up tasks, reschedule appointments, and more.
  • Use past data to predict revenue and sales performance and target high-intent deals.

Pros

  • Multichannel contacting. Free plans include multiple channels to contact leads, such as email, chat, and phone.
  • AI-Powered lead scoring. Utilizes artificial intelligence for lead scoring.
  • Automation capabilities. Provides numerous automations to streamline sales pipeline and CRM tasks.
  • Customizable dashboards. Users can tailor their dashboards and reports to their needs.

Cons

  • Limited free plan. The free version does not include reporting features.

G2 Reviews Around Freshsales CRM

“Freshsales has provided us with high-quality items at a reasonable price. We have managed and improved our sales and marketing efforts with Freshsales‘ support.” — Mindi M., Senior Client Coordinator, Marketing and Advertising, Enterprise(> 1000 emp.)

“As a sales rep, this tool is really helpful for me to create, manage and project deals of prospects and see the progress and the sales cycle. The best part is this platform allows or notify us of real-time deal opportunities so we can connect with the client asap.” — Neel R., Manager International Sales, Mid-Market(51-1000 emp.)

How to Choose the Right Sales Pipeline Management Tool

Consider the following to ensure you choose the right CRM platform for your business:

1. Understand Your Business Needs

Before comparing your options, it’s crucial to have a clear understanding of your business’s needs.

Various CRM solutions prioritize different aspects of sales pipeline management, be it automation, collaboration, or customer service. Ensure your CRM platform fits your needs adequately without bloating costs with unnecessary features.

2. Consider Your Budget

Is the CRM platform you’re considering offering viable or reasonable pricing based on projected returns?

Compare each CRM software’s pricing structure to find a suitable subscription plan you can afford. If you’re cash-strapped, consider CRM platforms with a free offering or a free trial offer.

3. Evaluate the Tool’s Features

Thoroughly evaluate each CRM platform’s features and investigate how they will impact your sales performance.

Ensure your CRM platform of choice has everything you need in terms of sales pipeline management. This will reduce your dependency and, in turn, expenses on supporting apps and add-ons.

4. Check Integration Capabilities

Choose a CRM platform that seamlessly integrates with apps you already use.

It’s possible to achieve cross-functionality between your CRM and third-party apps through connectors like Zapier and IFTTT. However, CRM platforms that natively support third-party software via in-app integrations achieve better efficiency and functionality.

5. Scalability

Your CRM platform should be able to scale as your business grows.

Remember, what you need today CRM-wise will change over time as your processes and teams evolve. As such, it’s beneficial to pick a CRM solution with options to upgrade or extend limitations without paying for a completely new product.

6. Customer Support and Training

Before investing in a new CRM platform, take a look at the available learning and onboarding resources on their website.

Training employees to use a brand-new CRM solution is a major roadblock to productivity. To overcome this, CRM providers may offer online courses, video tutorials, or assisted onboarding services.

Can Google Sheets be used for Sales Pipeline Management?

Absolutely. Google Sheets offers familiar functionalities that make it a prime choice for sales pipeline management, especially for startups or smaller businesses on a tight budget.

But there’s a catch.

Getting your sales pipeline data into your Google spreadsheet can be a real headache. Sure, you can manually export data from your CRM, but that’s tedious, error-prone, and a massive time sink.

Enter Coefficient, a free Google Sheets add-on that allows you to seamlessly sync live data from your favorite business systems into your spreadsheet.

Installing Coefficient to Google Sheets is a breeze. And once set up, you can directly connect to CRMs like Salesforce.

Coefficient also lets you combine data from other data sources, allowing you to perform more holistic analyses of performance.

And the best part? Coefficient has an expansive library of free sales reporting templates to help you visualize your data, like in the pipeline analysis dashboard below.

coefficient's sales pipeline analysis dashboard

How Sales Pipeline Management Tools Help Sales Performance

Sales pipeline management tools help sales performance by providing sales reps with a clear view of the sales pipeline. This includes information such as the status of each lead, the next steps needed to move the lead forward, and the expected close date. This helps sales reps to stay organized and focused and identify any potential bottlenecks in the sales process.

Improve Sales Forecasting

Sales Pipeline Management Tools enhance sales forecasting by providing a clear view of each stage in the sales funnel, allowing for real-time data updates and historical analysis. These tools promote consistency by standardizing forecasting metrics, facilitating scenario analyses, and can integrate with other business software for a comprehensive view of the customer journey. Leadership can then leverage this information to set sales targets based on anticipated revenue.

Enhance Lead Management

Sales Pipeline Management Tools tools categorize leads based on their position in the sales funnel, ensuring that each lead receives the appropriate attention and engagement. This structured approach helps sales teams prioritize high-potential leads, ensuring timely follow-ups and more effective nurturing strategies.

Automate Route Tasks

In the fast-paced world of sales, every second counts. Sales Pipeline Management Tools allow sales reps to focus on building relationships and closing deals by automating routine tasks like lead scoring and assignment, sending follow-up reminders, etc.

Provide Real-Time Insights and Reporting

With Sales Pipeline Management Tools, sales teams have instant access to crucial data. They can monitor key performance indicators, track sales trends, and analyze lead behavior in real-time. This immediate feedback allows for quick adjustments to strategies, ensuring that sales efforts are always aligned with current market dynamics.

Enable Collaboration

Sales is a team sport. Sales Pipeline Management Tools offer teams a central platform where data is used to ensure transparency and accountability. Team members can share insights, update deal statuses, and discuss potential roadblocks. This collaborative environment ensures that everyone is on the same page, leading to a more cohesive and effective sales strategy, ensuring that everyone is aligned toward common goals.

Increase Conversion Rates

By offering insights into each lead’s preferences and interactions, Sales Pipeline Management Tools enable salespeople to tailor their approaches accordingly. Personalized interactions, combined with optimized follow-up timings, enhance engagement. As a result, sales teams can convert leads into customers more efficiently, boosting overall sales performance.

Find the Best Sales Pipeline Management Tool for Your Business

A quality sales pipeline management tool is pivotal for refining your entire sales process. It offers leaders a panoramic view of sales activities, pinpoints and rectifies bottlenecks, and paves the way for smoother operations.

While every tool has its limitations, Coefficient steps in to bridge these gaps. It allows teams to effortlessly merge data from diverse sources, ensuring richer, more comprehensive analyses – all within the familiar confines of a spreadsheet.

Get started for free today and see how it seamlessly integrates with your tools and workflows today.

Sales Funnel Templates You Can Sync Live Data Into in A Few Clicks

In the fast-paced world of B2B Sales, careful management of the sales funnel is crucial to success. Companies need tools that streamline these processes and provide a holistic view of their sales pipelines. This is where templates that visualize the sales funnel come into play.

Dive into this blog to explore a few free sales funnel templates that will bring your sales data to life.  

What is a Sales Funnel?

A sales funnel illustrates the customer journey, starting from the initial interaction at the top of the funnel to the culmination in a purchase. This model aims to shepherd as many potential customers as possible through each stage, transitioning them from mere prospects to paying customers.

By delineating the buying process from the first spark of interest to the final transaction, the sales funnel offers businesses a systematic method to nurture leads and transform them into loyal customers.

In contrast, a marketing funnels address the broader customer journey from the time a person becomes aware of a product to the purchase. It includes strategies that attract, engage, and nurture potential customers, employing marketing strategies like content marketing, email marketing, etc. to guide prospective customers to the next stage of the funnel.  

Benefits of Using a Sales Funnel

1. Structured Approach to Lead Generation and Conversion

A sales funnel provides a structured pathway to manage prospective customers through which leads progressBy categorizing leads into different stages, such as awareness, consideration, and decision, sales reps can systematically guide them through each phase of the buying process.

This structured approach prevents potential customers from falling through the cracks. Every lead is assigned a specific stage, making it easier for sales and marketing teams to understand the lead’s current position in the buying journey. This systematic arrangement allows businesses to deploy targeted strategies and resources to nurture and convert leads effectively.

2. Clear Visibility into Lead Progress

One of the key advantages of an effective sales funnel is the transparent visibility it offers into the lead’s progression. Throughout each stage of the funnel, businesses can monitor and track the movement of leads from one phase to the next. This visibility is particularly valuable in optimizing email strategies, allowing for insights into the performance of follow-up emails and landing pages.

Understanding how leads progress enables businesses to identify top-performing stages and pinpoint areas that require improvement. Armed with this understanding, making prompt adjustments becomes an integral part of ensuring that the journey of qualified leads through the funnel remains both effective and efficient. This level of insight holds immense value, particularly for SaaS businesses. In this context, precise tracking and optimization of sales processes are of the utmost importance.

3. Informed Decision-Making

Sales funnels incorporate automation beyond lead tracking; they yield precious insights driving strategic decision-making. Progressing through distinct stages, leads generate a trove of data concerning their interactions, preferences, and behaviors. This data serves as a crucial wellspring for businesses, aiding in informed decision-making processes that positively impact the bottom line.

For instance, the analysis of conversion rates within each stage unveils the precise junctures where drop-offs manifest. Armed with this awareness, teams can channel efforts into refining content, messaging, or offers specific to those stages, thereby amplifying conversions.

Furthermore, insights from the funnel enable businesses to allocate resources smartly, optimizing both time and budget distribution, enhancing brand awareness and effectively navigating the buyer’s journey. These insights are particularly valuable when optimizing a checkout page, ensuring a seamless transition from interest to conversion.

4. Customer-Centric Approach

Sales funnels inherently prioritize the customer’s journey and experience. By mapping out the stages a lead goes through, businesses can tailor their communication and engagement strategies according to the specific needs of each stage.

Different Sales Funnel Stages

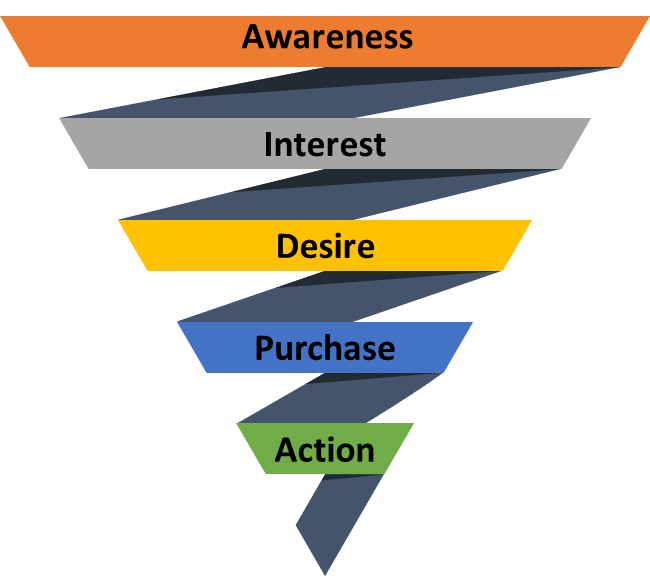
A typical sales funnel consists of several stages, each representing a specific phase of the customer journey. These stages can vary slightly depending on the nature of your business, but they generally follow the AIDA model: Awareness, Interest, Desire, and Action.

A Standard Sales Funnel


Awareness

At this stage, potential customers become aware of your product or service through various marketing efforts. This could involve encountering your brand through advertisements, content marketing, social media, or word-of-mouth recommendations. The primary goal of the awareness stage is to capture the attention of your target audience and make them aware of your existence and what you offer.

In this phase, it’s crucial to establish a compelling initial connection. Crafting your marketing materials to be both engaging and informative is essential, tailoring them to directly address your audience’s specific needs.

Interest

During the interest stage, prospects transition from simply being aware of your offering to displaying active interest in it. This is the critical phase when potential customers begin delving deeper, actively seeking more detailed information about your product or service. They might explore your website, dive into blog posts, watch videos, or interact with your social media content to gain a better understanding of what you provide.

To nurture this interest, provide valuable and informative content that addresses your audience’s pain points and offers solutions. Highlight the unique benefits and features of your offering that set you apart from competitors. Building interest encourages potential customers to stay engaged and learn more about how your product or service can meet their needs.

Desire

As prospects progress to the desired stage, they begin to develop a genuine desire for your product or service. This stage is all about helping them understand the value and relevance of what you offer. Potential customers should feel that your solution aligns with their specific needs and can provide them with the desired outcomes.

To create desire, showcase real-world examples, success stories, and testimonials from satisfied customers. Provide detailed information about how your product or service can solve their problems or enhance their lives.

Action

The ultimate stage of the sales funnel is action, where prospects initiate tangible interactions with your brand. This could encompass executing a purchase, enrolling in a complimentary trial, joining your email list, or soliciting further information. The crux lies in optimizing the process, streamlining the journey for potential customers to effortlessly embrace the desired functionality.

At this juncture, it becomes imperative to present lucid and compelling calls to action (CTAs). Guarantee that the steps leading to conversion are both uncomplicated and instinctive. Address any qualms or hesitations prospective customers might harbor and furnish the data requisite for a well-founded decision.

This approach holds true whether you’re facilitating engagement through channels like LinkedIn, email campaigns, phone calls, or capitalizing on an enticing lead magnet to fortify conversion rates.

B2B Sales Funnel vs. B2C Sales Funnel

While the core concept of a sales funnel remains consistent, there are notable differences between Business-to-Business (B2B) and Business-to-Consumer (B2C) sales funnels. Let’s compare them side by side:

AspectB2B Sales FunnelB2C Sales Funnel
AudienceTargeted towards businesses and organizations.Targeted towards individual consumers.
Decision-MakersInvolves multiple decision-makers within a company.Involves individuals or small groups.
Sales CycleLonger sales cycle due to complex decision-making.Shorter sales cycle with quicker purchasing decisions.
RelationshipsFocus on building long-term, professional relationships.Focuses on creating emotional connections and impulse buying.

Sales Funnel Template Examples

Understanding the importance of coefficients in optimizing sales funnels, let’s delve into practical examples of  sales funnel templates.

Note: Coefficient offersfree sales funnel templates for HubSpot and Salesforce designed to streamline your lead nurturing process, enhance conversion rates, and optimize your sales strategy.

1. B2B Sales Funnel Template

The B2B Sales Funnel Template offers a comprehensive view of your pipeline, making it easier to manage and prioritize leads effectively. It streamlines lead management, opportunity tracking, and deal progression within the B2B context.

Key metrics tracked include:

  • Lead Volume: Total count of individuals or businesses that show interest in your product or service and enter the top of the sales funnel.
  • Lead Conversion Rate: The percentage of leads that progress to the next stage in the sales funnel
  • Win Rate: The percentage of opportunities that successfully convert into sales, calculated as (Number of successful sales / Total opportunities) x 100.
  • Average Deal Size: The average value of each sale or contract, calculated as the total revenue from sales divided by the number of successful sales.

2. Sales Funnel Template by B2B Pipeline Stages Template

open pipeline by stage

The Sales Funnel Template by B2B Pipeline Stages offers a visual representation of how leads progress through the pipeline and where potential drop-offs occur. This information can guide your efforts to optimize conversion rates at each stage of the sales process.

Key metrics tracked include:

  • Pipeline Creation: Measures the number of new leads entering the sales pipeline within a set time frame, indicating lead generation effectiveness.
  • Win Rates: Calculates the percentage of leads that convert into sales, reflecting the efficiency of the sales process.
  • Average Opportunity Size: Represents the average value of each potential deal, helping prioritize larger opportunities.
  • Sales Velocity: Assesses how quickly leads move through the sales pipeline, highlighting the pace of revenue generation.

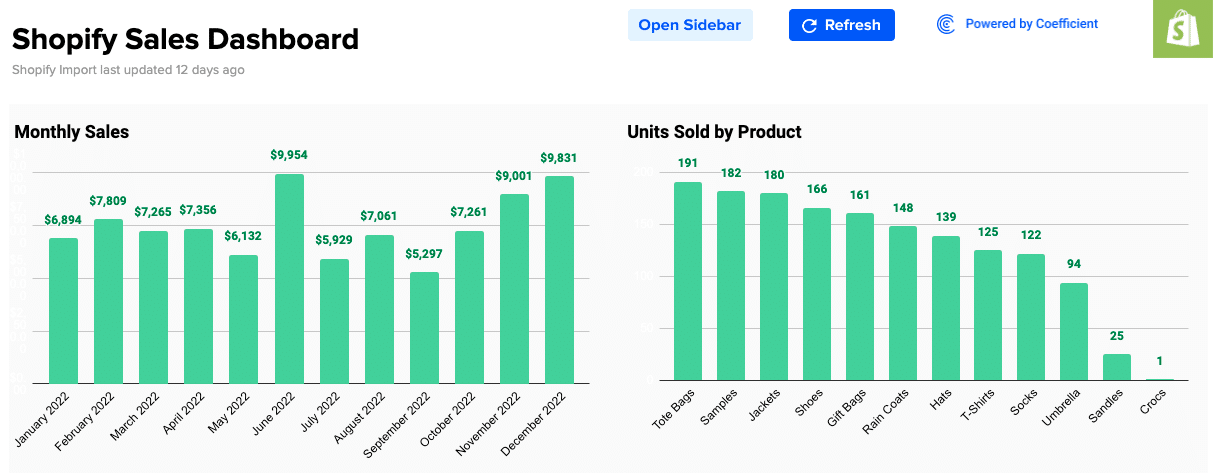
3. B2C Shopify Sales Funnel Template

shopify sales dashboard

The B2C Shopify Sales Funnel Template provides insights into your customer’s journey. Identify and improve key touchpoints to boost retention and conversion. Improve your online store’s results, enhance customer interactions, and boost your digital sales.

Key metrics tracked include:

  • Website Engagements: Stay informed about the influx of visitors gracing your online emporium.
  • Product Engagement: Gain insights into which products or services are capturing the attention of potential patrons.
  • Cart Additions: Monitor the frequency of items being added to virtual shopping carts.
  • Checkout Progress: Track the pivotal juncture where potential buyers proceed to finalize their purchases.
  • Successful Transactions: Seamlessly record triumphant transactions that contribute to your revenue stream.

Consulting Business Sales Funnel Template

Consulting Sales Funnel Templates are meticulously crafted for consultants and consulting firms. They streamline the process from lead acquisition to project completion, ensuring every opportunity is maximized.

Key metrics tracked include:

  • Lead Management: Capture and categorize potential clients expressing interest in your expertise.
  • Appointment Coordination: Simplify the process of scheduling consultations, avoiding overlaps and ensuring timely interactions.
  • Proposal Tracking: Monitor the status of proposals dispatched, ensuring timely follow-ups and adjustments as needed.
  • Conversion Monitoring: Gain insights into how many proposals transition into concrete projects, helping in refining your proposal strategy.
  • Project Oversight: Keep a pulse on ongoing projects, ensuring they’re on track and client expectations are met.

Tips to Optimize Your Sales Funnel

1. Segment Your Audience        

Dividing your audience into segments allows you to tailor your approach and messaging for higher relevance. Not all leads are the same; they have varying needs, preferences, and pain points. By segmenting your audience based on demographics, behaviors, interests, or purchase history, you can create more personalized and targeted communication strategies.

2. Implement Lead Nurturinng

Lead nurturing involves engaging with leads over time through targeted content, nurturing their interest, and building trust. Not every lead is prepared to make an immediate purchase. Some might be in the early stages of research, while others might need more information before committing.

To nurture leads effectively, provide them with valuable content that addresses their needs and concerns. This content can include blog posts, ebooks, webinars, and case studies.

3. Optimize Call To Actions

Clear Calls to Action (CTAs) are essential for guiding leads toward the desired action. A CTA is a prompt that encourages users to take a specific action, such as signing up for a newsletter, downloading a resource, or making a purchase.

CTAs should be easily visible, compelling, and strategically placed throughout your marketing materials. CTAs should also be aligned with the stage of the funnel and the content that accompanies them.

4. Make Data-Driven Optimizations

Using analytics to identify weak points in your funnel enables data-driven improvements. Tracking and analyzing key metrics at each stage of the funnel provides insights into where potential customers are dropping off and what might be causing friction. This data empowers you to make informed optimization decisions.

Bring Your Data to Life with Sales Funnel Templates

Leveraging the right sales funnel templates can profoundly transform your sales approach and outcomes. It’s essential to understand that optimization is a continuous journey. With the right techniques and tools at your disposal, you can perpetually fine-tune your sales funnel to achieve unparalleled success.

By integrating these strategies and templates, you not only elevate your sales performance but also gain a deeper insight into your customer’s preferences and behaviors.

Try Coefficient for free to see how our free sales funnel templates can help elevate your sales strategy.

Creating a Sales Pipeline Dashboard in Google Sheets

Are you ready to create a sales pipeline dashboard so you can track your sales performance easily?

If you’re like most sales managers, then you’re always concerned about your targets.

You want quick and easy access to sales pipeline reporting so you can keep a close eye on sales trends, conversion rates, or how your sales teams are performing to win new clients.

Sadly, it’s not always easy to perform a sales pipeline analysis.

This is especially true if you don’t have a streamlined and efficient method of pulling crucial sales data into one, easy-to-use platform.

That is why in this post, we are going to create a full-flash spreadsheet-based sales pipeline dashboard (or sales template) for tracking sales progress with Google sheets.

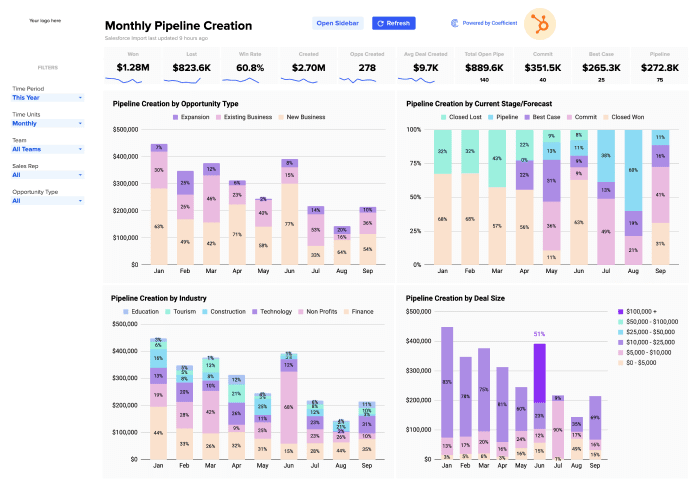
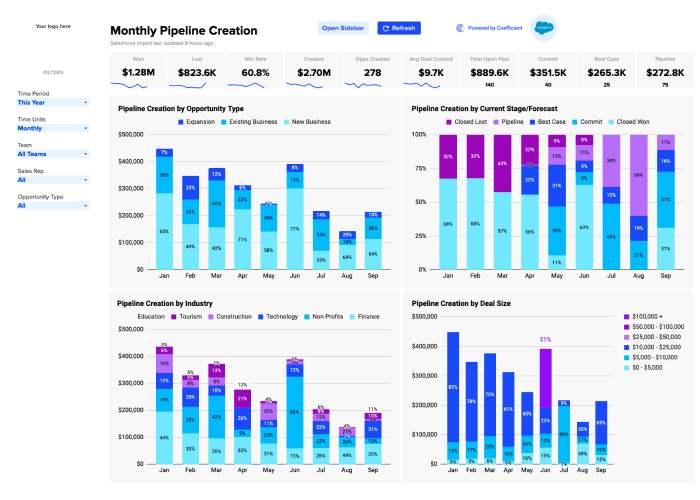
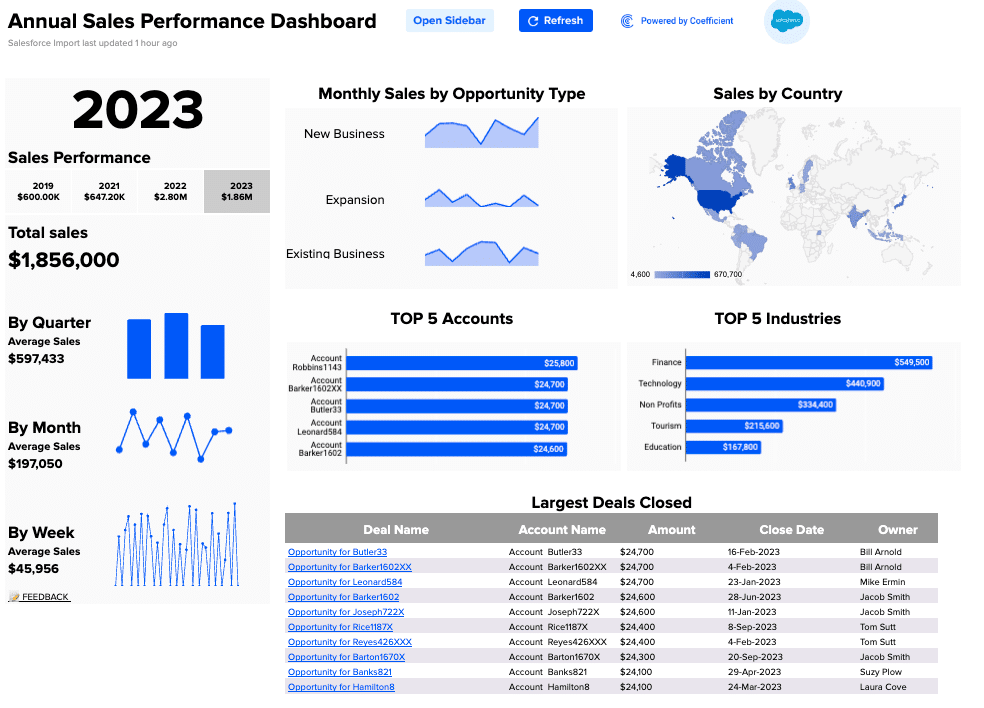
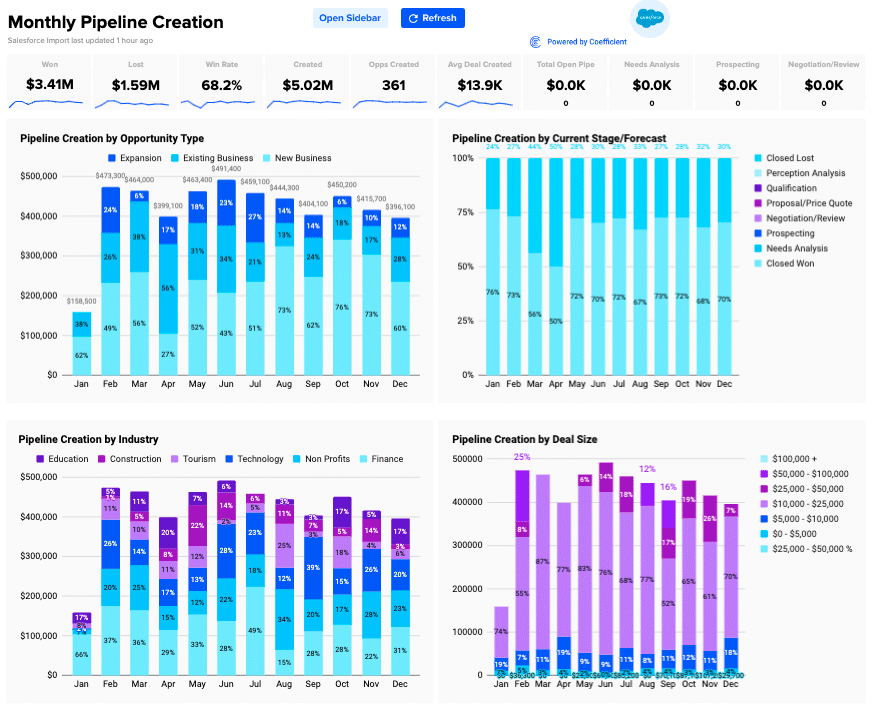
Want to skip the heavy build process? Copy one or our free, pre-built Google Sheets templates. If you’re using Hubspot or Salesforce, pull in your live data in just a few clicks. If you’re not, copy and make it your own!

hubspot pipeline creationsalesforce pipeline creation

Why create a sales pipeline report in Google Sheets

Google Sheets is free and it is great for team collaboration.

The sales team members can contribute to the spreadsheet directly and their work can be traced very easily. 

It is also easy to retrieve data from multiple sources – specifically with add-ons.

How to import crucial data for your sales pipeline report using Coefficient

Coefficient.io is a dedicated add-on for Google Sheets that makes importing data a breeze.

You can import data from a variety of sources for analysis which includes simple spreadsheets or CSV files as well as databases present online and offline. 

Here are some data sources:

  1. Salesforce
  2. HubSpot
  3. Google Analytics
  4. MySQL
  5. Redshift
  6. PostgreSQL
  7. Snowflake
  8. Looker
  9. Google Sheet
  10. CSV

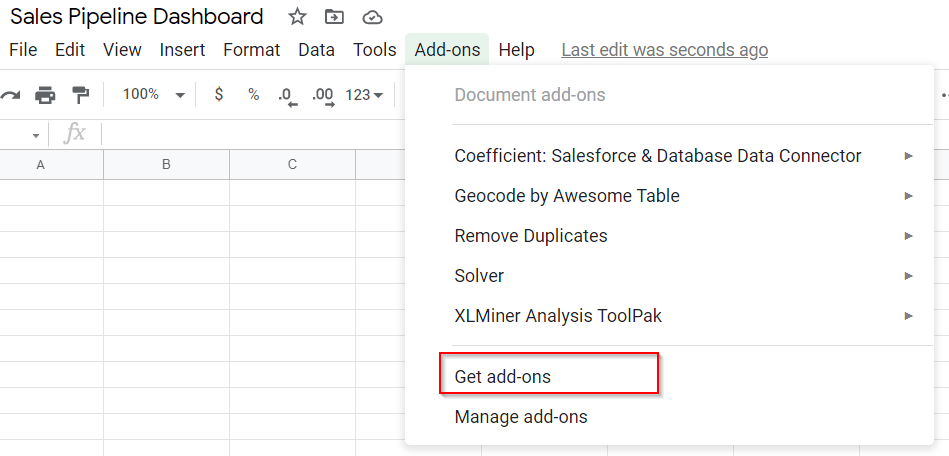
Installing the add-on is easy. Go to Add-ons on the menu bar in Google Sheets, search for “Coefficient: Salesforce & Database Data connector.”

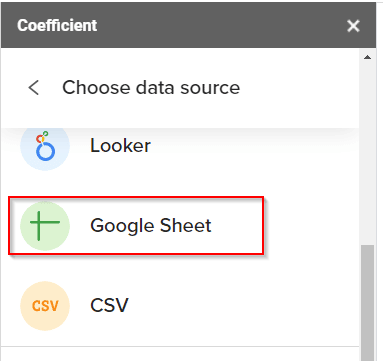
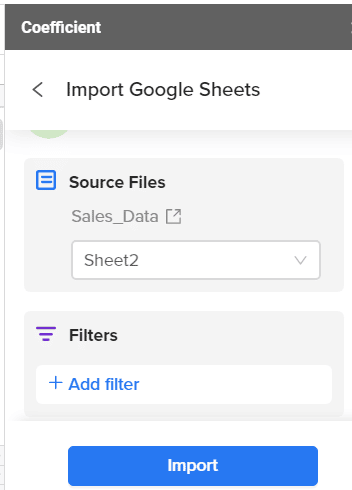
The add-on comes with a dedicated dialogue box to select the source of data. For this example, we will choose Google Sheet as the data source.

For this case study, we used a file named Sales_Data. Connect the analysis sheet to the data source by importing Sales_Data.

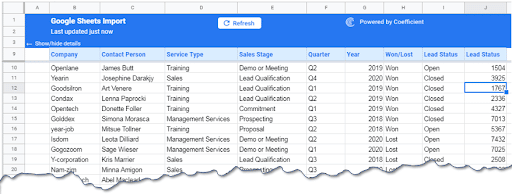
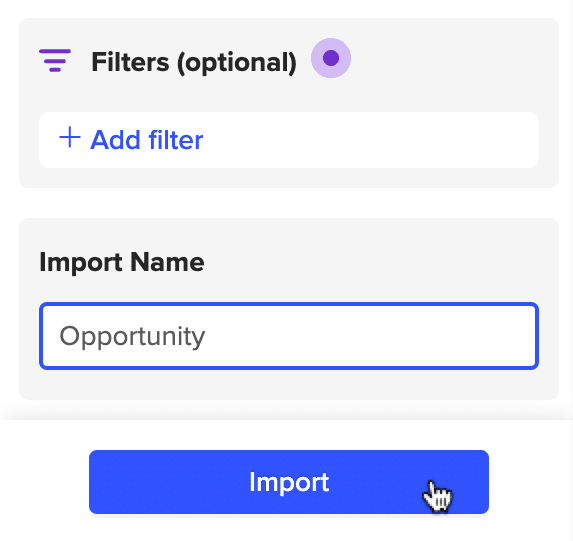
Our data is present in Sheet1 of Sales_Data, we will import the data and apply filters if required. For this analysis, we have not applied any filters.

This is how the analysis sheet looks once data is imported.

We are now ready to build our sales pipeline report.

Preparing the sales pipeline report

Let’s start by answering the fundamental questions related to a Sales Pipeline:

Open and closed deals and their dollar values

  1. What is the number of deals that are open or closed?
  2. What is the dollar value attached to these deals? 

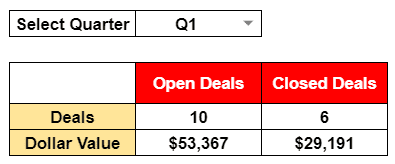
We used the formulas SUMIF(), SUMIFS(), COUNTIF(), and COUNTIFS() to find the number of open or closed deals and to know their respective dollar values. The final output is this table below:

We applied a drop-down to get an individual quarter or select all of the quarters. The number of open and closed deals and their dollar values are displayed in the table.

As you can see from the table above, we have 10 deals open for the current quarter and that will yield $53367. For the current quarter, we have earned $29191.

Thus we can see that 35.35% of the income has already been realized.

Open deals by Stage

The second obvious detail that everyone might be interested in is the breakdown of every deal by the stage they are in the pipeline.

The image below shows a detailed report of open deals data in one quarter. Again, we used conditional sum formulas for this report.

The table above was produced using the formulas SUMIFS() and COUNTIFS() with conditionals added through the IF() function.

After selecting a calendar quarter, the data was displayed in the table showing the breakdown of the deals and their dollar values.

Deals won and lost by segment

The table below shows the details of the deals that the company had won and lost for the selected period and the breakdown of deals by segment and their dollar values. 

From the table, we can see that there is a 50:50 ratio in deals won and lost. You can also notice that the biggest share of deals belongs to Sales (sales of goods) followed by Training that is provided to clients.

In the second row, the dollar values of the deals are shown. Using the dollar value for each service type, we would know the marginal value each deal can bring to the company.

For example, acquiring one client that needs “sales service” will add 33847/7 = $4835 to the company whereas Management Services will give $5632 and $5232. Thus, the management service is the service type that adds the most value to the company.

A similar analysis could be done for deals won and lost against any service type to find out which service type needs improvement.

Year over year analysis of sales

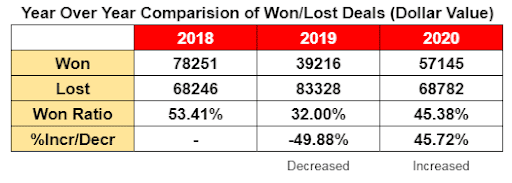
In the following table, we analyzed the total deals won and lost for every year and compared them.

Year over year analysis of sales

The data above shows the won/lost ratio. This ratio took a dip in the year 2019 and then increased again in 2020. The last row shows that the win ratio in 2019 decreased by almost 50%, and it increased again by 46% in 2020. Still, the ratios reported in these two years are lower than the base year of 2018.

Salesperson performance

No target can be achieved without team effort; hence it is really important to see the contribution of each individual in the team. The following table presents the performance of each salesperson in terms of dollar value-added.

Salesperson performance dashboard

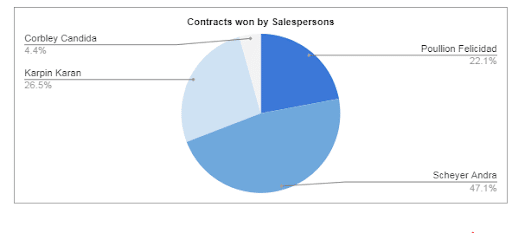
The table shows the sales figures for the four salespeople working in the company. The most successful salesperson is Scheyer Andra who brought the business worth $26,908 of sales, followed by Karpin Karan with $15,125.

Graphs

Graphs always add value to reports by presenting key facts in visual form.

The following graphs show the open or active deals versus the delivered or closed deals. A total of 64% are still open. This implies that services still need to be delivered. This number also represents outstanding payments.

The following graph is the visual presentation of won and lost projects in every quarter of three calendar years.

It also shows the variation in business volume over the years as the bars in the graph rise and fall in every quarter.

From the visual inspection, there is almost a 50:50 ratio in projects won and lost by the company. 

The graph above presents the data from the last table in a visual form showing that major sales come from Scheyer Andra and Karpin Karan.

Syncing and updating the data

Once the report is produced, it will need to be updated to keep the report fresh. This is generally done manually by importing and exporting data, but you can get the data in real-time without importing or exporting using Coefficient. Our add-on makes that easy by providing an option to automatically schedule updates.

You just need to set when the Sales Pipeline Dashboard has to be updated and as the pipeline data is updated, the dashboard will be, too.

Try our pre-built sales pipeline dashboard – launch in a single click in Google Sheets

If you want to bypass the manual work of building a sales pipeline dashboard, you can launch our free Sales Pipeline Analysis template (Salesforce / HubSpot) in a single click. Our Sales Pipeline Analysis template offers pre-built dashboards that visualize your sales pipeline in Google Sheets.

Now you can measure individual, team, and company-wide sales performance for all dashboards and reports. Simply toggle the drop down menu to your preference.

With the Sales Pipeline Analysis template, you can track pipeline creation with live data from your Salesforce or HubSpot CRM. Track the flow of SQLs in your pipeline, how lead generation initiatives are performing, pipeline health, and sales forecasting KPIs, without having to build dashboards from scratch.

Visualize monthly conversions, measure win rate, and compare revenue year-over-year with our pre-designed dashboards. Understand how individual reps and teams are performing, what they’re contributing to total revenue, and also isolate trends that might call for an adjustment of sales tactics.

Check out our monthly velocity dashboard to see how much revenue is passing through your pipeline on a monthly basis. This allows you to understand how fast your sales reps are converting leads. It’s a key indicator of pipeline health, and incorporates many fundamental sales KPIs — SQLs, average deal value, and sales cycle length.

The template also maintains a monthly report for many of the key sales pipeline metrics: pipe created, closed won, closed lost, win rate, revenue, cycle length, average deal value, and more. This gives you a bird’s eye view of how your reps, teams, and company are performing in all facets of the sales pipeline.

Our one-click Sales Pipeline Analysis template (Salesforce / HubSpot) is a great free option for sales professionals who do not have the time to build and maintain dashboards.

Conclusion

Creating sales pipeline reports is made easy using the Coefficient.io add-on in Google Sheets. As you have seen in the various analysis we have done — determining values corresponding to different stages, deals won and lost and their dollar values, year over year analysis of sales, time-series presentation of data, and year wise performance of salespeople — reports could be easily generated using the proper software.

These data analysis reports can be used to find loopholes in your sales plans so you can implement immediate remedial actions that can boost conversions. You can also use them to observe sales trends, conversion rates, or the performance of your sales teams.

In preparing this report, we used the spreadsheet formulas SUMIFS(), COUNTIFS(), SUMPRODUCT(), IF(). In order to have details of these formulas, please download the dashboard sheet. 

The analysis shown here can be taken as a starting point and can further be explored. You can use it to further study the performance of a salesperson in a specific sector, analyze over a quarter comparison of sales trends, and know why a sales lead was lost, and many more.

Try Coefficient for free today!

Launch Pre-Built Sales Dashboards in Google Sheets Now

Top 7 Sales Pipeline Metrics You Can’t Ignore

Sales pipeline metrics are more than just buzzwords; they’re the backbone of an effective sales process. However, not all metrics drive results. While some enhance sales strategies and guide reps, others merely offer surface-level insights. 

So, which sales metrics should you prioritize tracking in your CRM? We’ve pinpointed the top seven sales pipeline metrics that genuinely impact growth.

Let’s dive in!

What is a Sales Pipeline?

A sales pipeline represents the stages that a prospect goes through, from initial contact to closing a deal. It’s a visual representation of your sales process, guiding your team through the journey of converting leads into loyal customers.

A well-structured sales pipeline allows you to track and manage each stage of the average sales cycle length, enabling you to optimize your efforts for maximum results.

Importance of Tracking Sales Pipeline Metrics

Effective sales pipeline coverage and management goes beyond mere intuition – it’s about data-driven decision-making.

Tracking sales pipeline metrics with dashboards provides you with actionable insights into your team’s performance, enabling you to identify bottlenecks, streamline processes, and allocate resources efficiently.

Top 7 Sales Pipeline Metrics and KPIs to Track

  • Number of Qualified Opportunities: The count of potential deals that have progressed to pipeline stages where they are considered qualified and likely to convert into customers.
  • Avg. Deal Size: The average value of deals closed within a specific timeframe, providing insights into deal quality and revenue potential.
  • Sales Velocity: The rate at which deals progress through various pipeline stages over a specific period of time, underscoring potential bottlenecks and areas for improvement.
  • Win Rate: The percentage of qualified opportunities that successfully result in closed deals, reflecting the team’s effectiveness in converting leads.
  • Customer Acquisition Cost (CAQ) to Lifetime Value (LFT) Ratio: The relationship between the cost of acquiring a new customer and their potential lifetime value, indicating efficiency in navigating through the sales funnel and retention.
  • Average Sales Cycle: The average time it takes for a lead to progress through various pipeline stages, revealing the efficiency of the sales process.
  • Marketing Qualified Lead (MQL) to Sales Qualified Lead (SQL) Conversion Rate: The percentage of marketing-qualified leads successfully transitioning to sales-qualified leads, showcasing the alignment between marketing and sales efforts.

1. Number of Qualified Opportunities

Assessing the Number of Qualified Opportunities is key to evaluating your SaaS sales effectiveness. Combined with insights from Customer Lifetime Value (CLV), deals, and leads, it guides refined sales strategies.

Who Owns the Metric: The Sales Development team typically is responsible for this metric, spearheading the early stages of lead engagement.

Tracking Frequency: A weekly review of the number of qualified opportunities is recommended.

Free Tracking Template

Download Coefficient’s free Pipeline Creation Dashboard to stay on top of your pipeline.

Tips to Improve Qualified Opportunities

  • Prospecting: Effective prospecting is the foundation of a healthy sales pipeline. Invest time in thorough market research to identify potential leads that align with your target customer profile.
  • Lead Qualification: Train your sales development team to qualify leads based on predefined criteria rigorously. This ensures that only leads with a genuine interest and potential to convert are advanced to the next stages of the pipeline.

2. Average Sales Cycle

Average Sales Cycle gauges the duration from a lead’s first engagement to the final deal closure. Alongside metrics such as churn rate, it illuminates the effectiveness of a sales process. Grasping this cycle enables businesses to optimize lead management, opportunity volume, and sales outcomes.

Who Owns the Metric: The Sales Operations team typically tracks the Average Sales Cycle.

Tracking Frequency: Monthly monitoring of the Average Sales Cycle is vital, allowing for agile adjustments to marketing strategies based on real-time insights.

Free Tracking Template

Coefficient offers a free Average Sales Cycle tracking template designed to connect you to your Salesforce data to track edits and changes over any period.

Tips to Improve Average Sales Cycle

  • Sales Automation: Embracing sales automation tools can significantly reduce the time spent on repetitive and administrative tasks. By automating tasks like data entry, follow-up emails, and appointment scheduling, you can expedite the sales process and shorten the overall sales cycle.
  • Better Communication: Effective communication between your sales and marketing teams is crucial for streamlining the customer journey. When both teams are aligned and well-informed about leads’ interactions, preferences, and pain points, they can collectively work towards a smoother and quicker conversion process.
  • Optimizing Sales Strategies for SaaS Success: For SaaS companies, leveraging automation tools optimizes sales opportunities and boosts revenue growth. Pipeline analysis in real-time is essential, guiding strategies effectively. Tracking sales opportunities over time, combined with precise pipeline value insights, enables informed decisions. This data-driven approach, coupled with aligned sales and marketing efforts, accelerates conversions in the competitive SaaS realm.

3. Quota Attainment

Quota Attainment measures the percentage of sales targets met or exceeded by the sales team within a specific timeframe. It evaluates the effectiveness of sales strategies, the productivity of sales reps, and the overall health of the sales pipeline.

Who Owns the Metric: Quota Attainment metrics are typically owned by Sales Leadership and Sales Operations teams. These teams are responsible for setting the quotas, tracking performance against these quotas, and implementing strategies to ensure these targets are met.

Tracking Frequency: It’s essential to track Quota Attainment on a monthly basis. This allows sales teams to make necessary adjustments to their strategies and efforts to ensure they are on track to meet or exceed their sales targets by the end of the quarter or year.

Free Tracking Template

Enhance the tracking and analysis of Quota Attainment with Coefficient’s Sales Dashboard Template. This tool offers seamless integration with your live sales data for real-time insights, making sales management more efficient and effective. 

Tips to Improve

  • Regular Performance Reviews: Hold regular review sessions with sales representatives to assess their progress towards their quotas and provide constructive feedback.
  • Training and Development: Offer continuous training and development opportunities to enhance the sales skills of your team members.

4. Average Deal Size

Average Deal Size measures the average monetary value of the deals successfully closed within a specific time frame. It provides essential insights into the quality and potential revenue generated by individual deals. By understanding the average deal size, you can evaluate the impact of your sales efforts and make more accurate revenue forecasts.

Who Owns the Metric: The ownership of the Average Deal Size metric typically resides within the Sales Leadership team. This team oversees the strategic direction of sales efforts and assesses the value and significance of individual deals.

Tracking Frequency: It’s advisable to monitor the Average Deal Size metric quarterly. This frequency allows you to identify shifts in customer preferences or market demand and respond accordingly.

Free Tracking Template

Coefficient’s free Salesforce Sales Performance Dashboard tracks key sales performance by year, by quarter, by month, or by week, in a single spreadsheet.

Tips to Improve Average Deal Size

  • Upselling: Train your sales team to identify opportunities for upselling proactively. Encourage them to understand the unique needs of each customer and effectively communicate the additional value that higher-tier offerings bring. By positioning upsells as solutions that address specific pain points, your team can increase the average deal size.
  • Bundling: Create product bundles or packages that combine complementary products or services. By offering customers a comprehensive solution that addresses multiple needs, you can incentivize them to invest in a larger deal size. Bundling not only increases the perceived value of the offering but also encourages customers to explore more extensive options.

5. Sales Pipeline Velocity

Sales Pipeline Velocity offers insights into the pace at which deals progress through your sales pipeline. It considers the time that leads spend in each stage of the pipeline, helping you identify bottlenecks, inefficiencies, and areas where your sales process can be optimized for quicker conversions.

Who Owns the Metric: The responsibility for tracking and improving the Sales Pipeline Velocity metric typically falls under the purview of the Sales Operations team. These professionals are dedicated to enhancing the efficiency and effectiveness of your sales process.

Tracking Frequency: It’s advisable to monitor the Sales Pipeline Velocity metrics monthly. This frequency allows you to identify trends and anomalies in the speed of deal progression.

Free Tracking Template

Coefficient’s free Salesforce Pipeline Analysis Dashboard instantly populates with your live data, allowing you to track sales key metrics like Pipeline Creation and Sales Velocity.

Tips to Improve Sales Pipeline Velocity

  • Sales Training: Continuous investment in training is essential to equip your sales team with the skills, knowledge, and techniques needed to navigate the pipeline efficiently. Regular training sessions can keep them updated on best practices and new strategies, ultimately contributing to faster deal progression.
  • Streamlining Sales Processes and Ops: Regularly assess and refine your sales processes to eliminate any unnecessary or redundant steps that might slow down the sales cycle. Collaborate with your sales team to identify areas where processes can be streamlined and made more efficient.

6. Win Rate

Win Rate is a pivotal KPI measuring the percentage of qualified opportunities successfully converted into closed deals. It offers valuable insights into your sales team’s effectiveness in turning potential leads into paying customers. By calculating the Win Rate, you gain a deeper understanding of your team’s ability to navigate the sales process and close deals successfully.

Who Owns the Metric: The ownership of the Win Rate metric lies within the Sales team.

Tracking Frequency: It’s recommended to monitor the Win Rate metric weekly. This frequency allows you to respond promptly to any fluctuations and adapt your approaches accordingly.

Free Tracking Template

Coefficient’s free Win Rate tracking template is designed to monitor successful conversion rates across teams, individuals, industries, regions, and deal sizes.

Tips to Improve Win Rate

  • Effective and Timely Follow-ups: Implement a structured follow-up process that ensures leads are engaged at the right time and in the right manner. By promptly responding to inquiries, addressing concerns, and providing relevant information, you increase the likelihood of successful conversions.
  • Value Selling:Train your sales team to emphasize the unique value proposition of your products or services. Equip them with the knowledge and skills to address specific pain points and challenges that potential customers may have. By showcasing how your offering meets their needs, you can differentiate your solution and increase conversion rates.

7. Win Rates by Source

Win Rates by Source calculates the effectiveness of different lead sources based on the percentage of leads that convert into customers. It’s a crucial for understanding which marketing strategies and channels yield the highest converting leads, informing where to focus efforts and investment.

Who Owns the Metric: This metric falls under the purview of Marketing Operations and Sales Operations teams, who analyze the effectiveness of various lead generation sources and enhance strategic alignment between marketing and sales.

Tracking Frequency: Quarterly analysis of Win Rates by Source is recommended. This timeframe provides a substantial data set for impactful insights, allowing for strategic adjustments and optimizations.

Free Tracking Template

Dive into your win rates by source with Coefficient’s Win-Loss Analysis Template. This template integrates directly with your data for up-to-the-minute insights, enabling you to pinpoint which marketing and sales channels are bringing in the most successful deals. 

Tips to Improve Win Rates by Source

  • Refine Lead Qualification: Regularly review and refine your lead qualification criteria to ensure you’re focusing on high-potential sources.
  • Invest in High-Performing Channels: Allocate more resources to lead sources that show higher win rates to maximize your ROI.

Decoding Sales Pipeline Metrics for Success

Data is essential in sales. By mastering the top seven sales pipeline metrics, you can empower your team to boost efficiency, increase revenue, and close more deals. Each metric provides insights into your sales process, assisting you in making strategic decisions.

Coefficient offers a suite of free dashboards and templates to make tracking sales pipeline metrics a breeze. Get started for free today and see how it seamlessly integrates with your pipeline management tools and workflows today.

How to Build a Sales Pipeline Tracker in Google Sheets (Free Template)

Sales pipeline tracking is an integral part of any sales team. The dashboard visually represents every step of your sales process to help you understand if you’re approaching your strategic sales goals.

However, creating an automated and dynamic sales pipeline tracker is a sometimes difficult task. Core challenges like data integration and maintaining real-time updates often disrupt the process.

In this guide, we’ll demonstrate how you can easily build a sales pipeline tracker in Google Sheets by leveraging your Salesforce data.

And to make things easier, we’ve developed a free sales pipeline tracking template for Google Sheets that you can use right now!

That way, you can bypass the building process and start tracking your sales process in Google Sheets right away.

Let’s get started! Here’s a step-by-step guide on how to create a sales pipeline tracker in Google Sheets.

Video Walkthrough: How to Create a Sales Pipeline Tracker in Google Sheets

Sales Pipeline Tracking: A Step-by-Step Guide to Visualizing Your Salesforce Data

To build the sales pipeline tracker, you’ll need to import your Salesforce CRM data into Google Sheets.

But don’t waste your time manually copying-and-pasting Salesforce data into Google Sheets — use Coefficient instead.

Coefficient allows you to automatically import real-time data from your company systems into Google Sheets.

With Coefficient, you can pull live Salesforce data into Sheets and build a sales pipeline tracker on top of it. That way, your tracker is always up-to-date and ready-to-share.

Let’s install Coefficient so we can import real-time Salesforce data into Sheets and build our sales pipeline tracker.

Step 1: Install Coefficient

First, let’s install Coefficient.

Coefficient allows you to directly connect Salesforce to Google Sheets without coding or a complicated setup. The app makes exporting, importing, and syncing your live Salesforce data in Sheets easy.

Install the Coefficient add-on by clicking the Extensions menu tab on Google Sheets. Then,  select Add-ons and Get add-ons.

Install the Coefficient add-on by clicking the Extensions

Enter “Coefficient” on the Google Workspace Marketplace pop-up window’s search bar. Select Coefficient, and go through the prompts to complete the installation.

Select Coefficient in the Google Workspace Marketplace

After installing the Coefficient Google Sheets add-on, return to the Extensions menu tab and launch the app.

Kick things off by launching the Coefficient app from the extensions menu in Google Sheets. Navigate to Extensions -> Coefficient -> Launch.

Untitled

Step 2: Import Salesforce Data

Choose ‘Import from…’ once the Coefficient sidebar launches.

Untitled

Next, select Salesforce as your data source.

Untitled

Click From Objects & Fields.

Untitled

Under New Import, choose the Opportunity object.

Untitled

Choose the fields you want to import. For this example, we’ll select ‘Forecast Category,’ ‘Amount,’ and ‘Close Date.’

Pasted image 0

Once you’re done selecting fields, toggle Pivot Mode on.

Pasted image 0

Set ‘Forecast Category’ as your row and ‘Close Date’ as your columns going across the pivot table.

Pasted image 0

Group by month with ‘Amount’ as your value and change the dropdown to ‘Sum.’

Name your import and click ‘Import.’

Pasted image 0

Step 3: Build Your Sales Pipeline Tracker

To start building your sales pipeline tracker, open a separate tab in your Google spreadsheet.

Build a table referencing your Salesforce import where ‘Forecast Category’ is in column A, and your months run across the first row.

Untitled

Next, use the following formula to calculate amounts for your sales pipeline categories. Drag the formula across the months to generate the totals:

=iferror(INDEX(‘⚡️Opportunity’!$A$3:$M$7,match($B8,’⚡️Opportunity’!$A$3:$A$7,0),match(C$7,’⚡️Opportunity’!$A$3:$M$3,0)),)’=iferror(INDEX(‘⚡️Opportunity’!$A$3:$M$7,match($B8,’⚡️Opportunity’!$A$3:$A$7,0),match(C$7,’⚡️Opportunity’!$A$3:$M$3,0)),)

Pasted image 0

Copy this formula across the closed won label row:

=if(MAX(‘⚡️Opportunity’!$B$3:$M$3)=C$7,text(C$11,”$#,##0.0,K”),)

Pasted image 0

Step 4: Create Your Charts

Now chart your sales pipeline tracker.  Highlight the entire range and go to the top nav and click ‘Insert’ -> ‘Chart.’

Untitled

Change the chart from the default ‘area chart’ to a ‘combo chart.’

Untitled

This allows us to customize the chart to showcase the sales pipeline evolution as an area chart in conjunction with a line for your target.

To do so, click the ‘Customize’ tab and select ‘Series.’

Untitled

Now click the drop-down and select ‘Target.’

Untitled

Then navigate to Format -> Type -> Line.

Untitled

Now, go through each one of the forecast categories. Change the area opacity to differentiate between the dollar amounts between each forecast category. Select ‘Closed Won’ as the heaviest opacity like below.

Untitled

And now, as your Salesforce import grows throughout the year, you can see how the pipeline evolves with it, like below.

Untitled

Let’s add the chart label. Click the 3-column periods in the top right corner.

Untitled

Then select ‘Edit Chart’ -> ‘Setup’ -> Scroll down to ‘Series’ -> Go to ‘Closed Won’ -> ‘Add labels.’

Untitled

Then add the Closed Won label to the series.

Untitled

In just a few minutes, you’ve brought your Salesforce data to life using the Coefficient app and Google Sheets. You can now track how your sales pipeline evolves throughout the year.

Visualize Your Sales Pipeline Tracking Faster Than Ever with Coefficient

The combined power of Coefficient and Google Sheets makes visualizing your sales pipeline tracking a breeze, offering fresh, valuable insights on your sales progress throughout the year.

Curious about how Coefficient can help streamline analysis of your Salesforce data? Get started for free with Coefficient to start leveraging your real-time Salesforce data in Google Sheets.