Free, pre-built Sales Performance Dashboard in Google Sheets
Monitor your sales team’s performance, all within a single spreadsheet. Our Sales Performance Analysis Template allows you to see if and how sales reps are meeting annual goals, without requiring you to build anything.
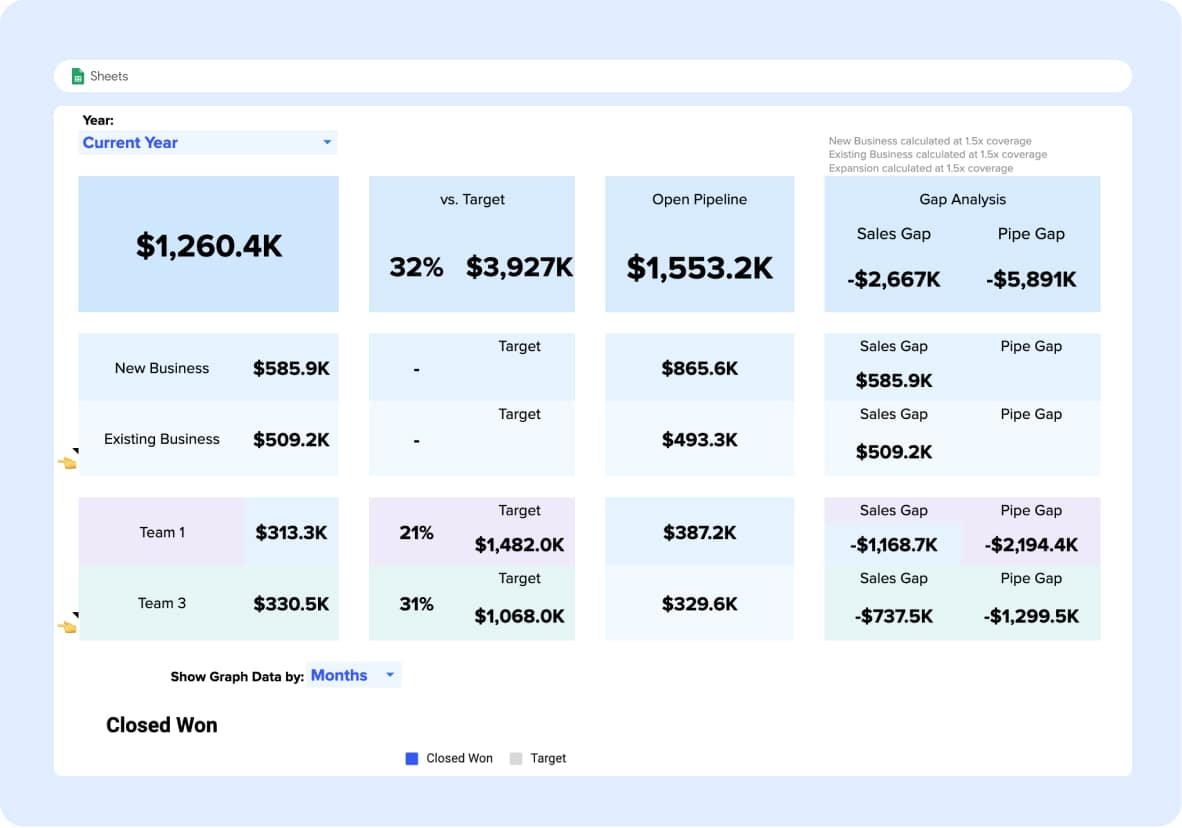
Harness pre-designed charts and graphs to view sales performance by time period, opportunity type, and country. Filter visualizations by year, team, opportunity, and geolocation.
This Sales Performance dashboard will help you:
- Automatically populate this dashboard with live data from your Salesforce CRM
- Track year-over-year sales results and celebrate growth
- Instantly gain insights into your top performing teams, regions, industries, and accounts
- Monitor other important Sales KPIs with our dashboards included in this template package
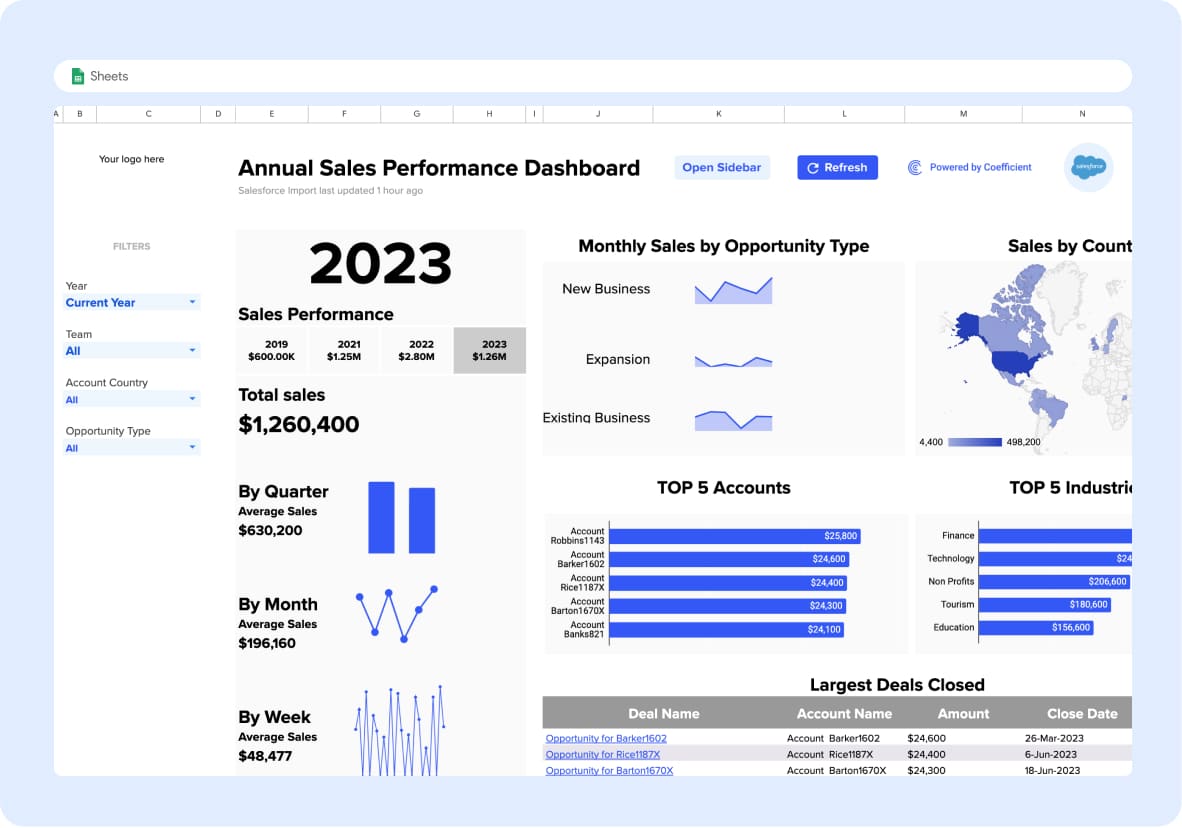
Here’s an overview of the Sales Performance Dashboard’s key visualizations:
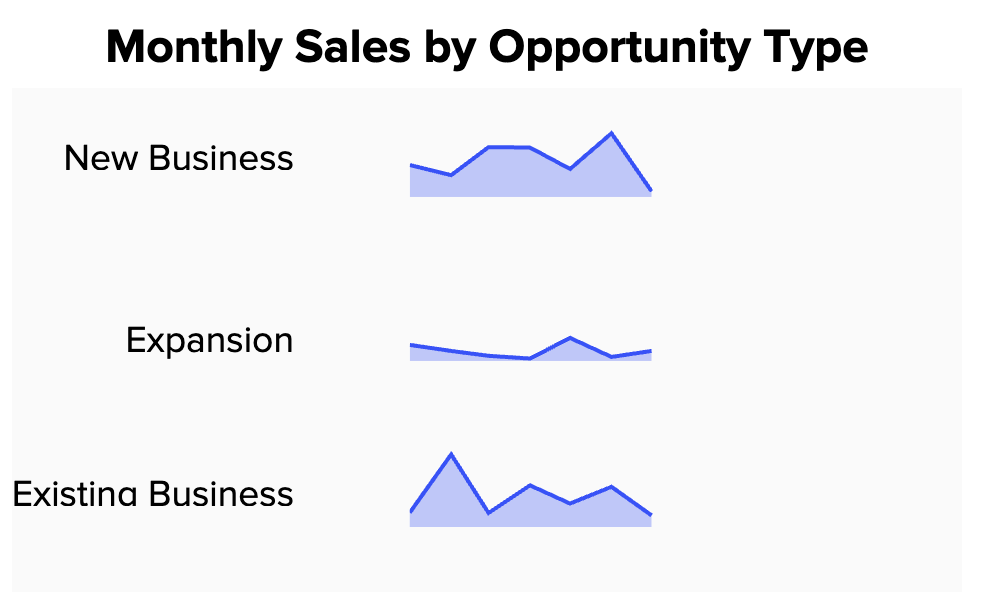
Easily visualize monthly sales by opportunity type new business, upsells, or renewals.


Rapidly display your top five accounts.
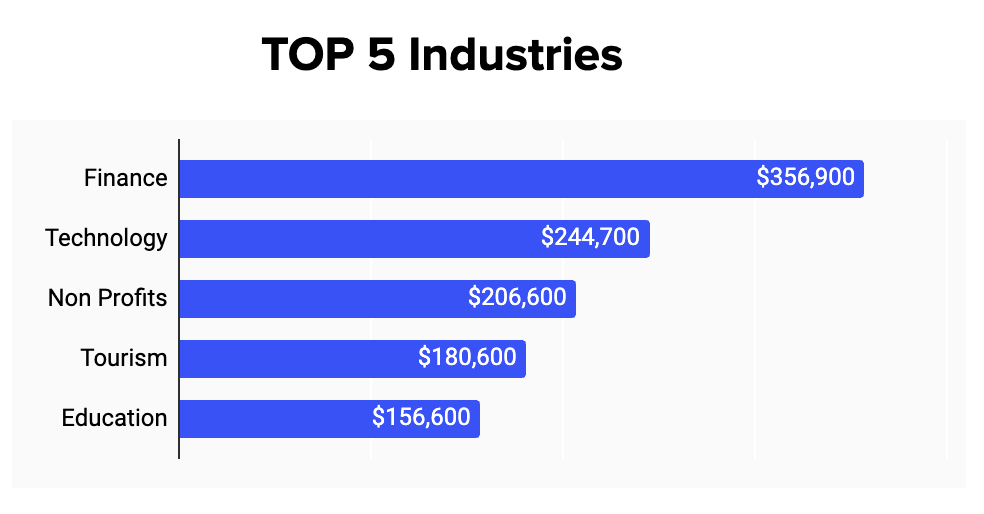
Segment your clients by industries like ‘Finance,’ ‘Technology,’ ‘Non-Profit,’ ‘Tourism,’ ‘Education.’
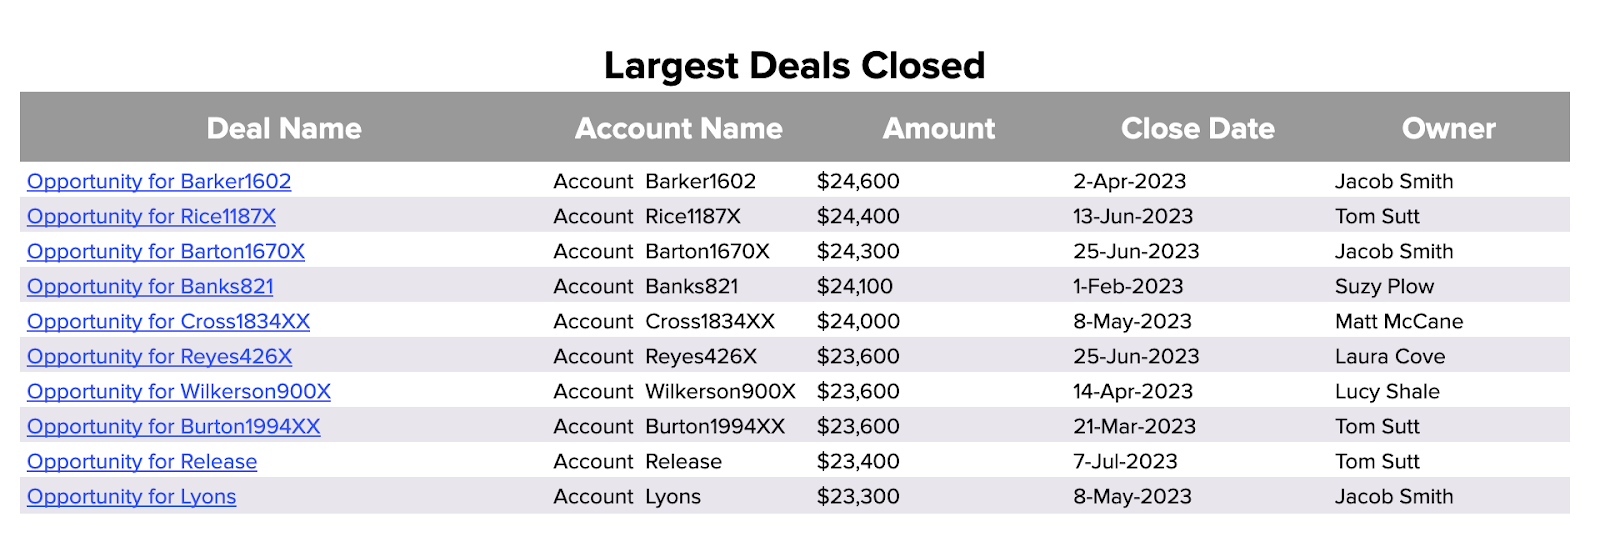
Review your largest deals categorized by ‘Deal Name,’ ‘Account Name,’ ‘Amount,’ ‘Close Date,’ and ‘Owner.’
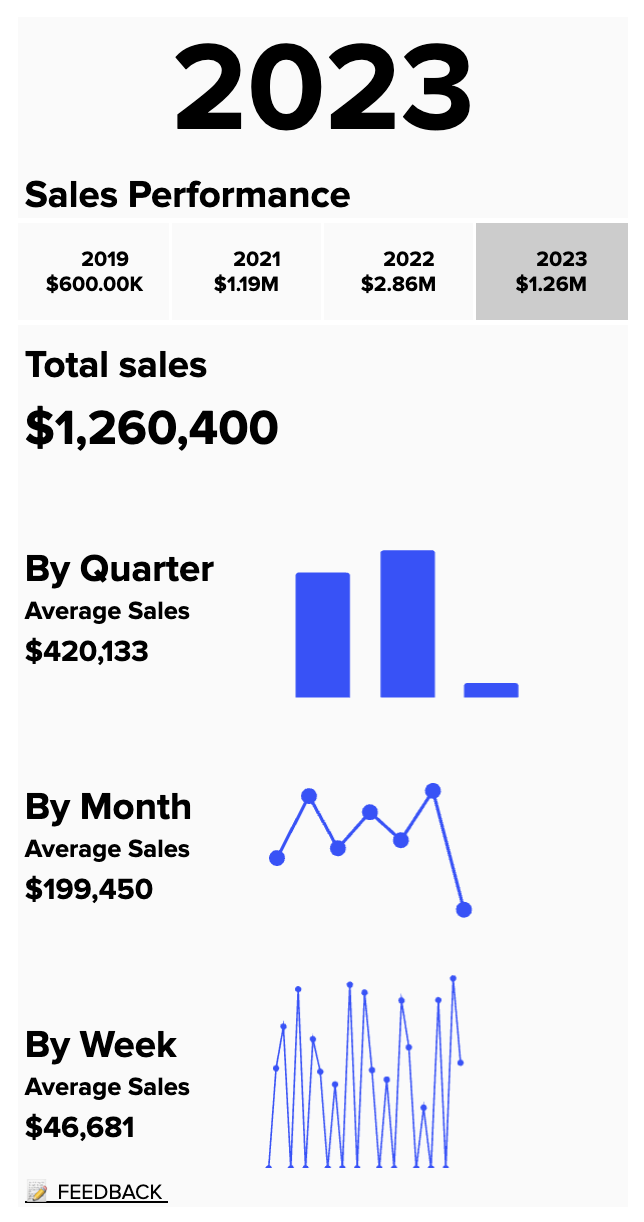
Granularly breakdown sales volume by the week, month, quarter, or year.

Filter performance by year, team, account category, or opportunity type.