


Table of Contents
![]()
-
1. B2B Sales Pipeline Coverage – From Prospect to Profits (Insights from RevOps Expert)
- What is Pipeline Coverage?
- How to Calculate Pipeline Coverage?
- What is the Ideal Pipeline Coverage Ratio for B2B?
- How Does Pipeline Coverage Influence Our Sales and Forecasting Strategies?
- How to Track Sales Pipeline Coverage Accurately?
- 5 Common Missteps in B2B Pipeline Management
- 9 Strategies to Boost Pipeline Coverage in B2B Sales
- Weighted vs. Unweighted Sales Pipeline
- Master Pipeline Coverage for Predictable Sales

In B2B sales, mastering your pipeline coverage isn’t just important—it’s essential. But with ever-evolving market dynamics and shifting customer behaviors, no two sales cycles are the same.
How can sales leaders navigate these complexities and set their teams up for success?
This guide discusses pipeline coverage best practices to ensure consistent growth by using insights from seasoned RevOps experts Emerson McCuin, Saahil Dhaka, and Cody Kimball.
Let’s dive in.
What is Pipeline Coverage?
At its core, pipeline coverage is a metric that offers a ratio of the total opportunities present in your sales pipeline compared to the sales quota set for a specific time period.
This sales pipeline coverage ratio is often used as a rule of thumb by sales leaders to gauge the health of their pipeline.
A foundational understanding of the pipeline is essential, as it’s “everything you need to know” when evaluating the effectiveness of a sales strategy.
How to Calculate Pipeline Coverage?
The formula for pipeline coverage is: Pipeline Coverage = Total Pipeline / Sales Quota for the Period
Example: If your sales team has a total pipeline value of $320,000 and a quota of $100,000 for the month, the pipeline coverage is 3x.
How to Calculate Sales Pipeline Coverage in Coefficient
Coefficient’s Pipeline Analysis Dashboard for Google Sheets is your gateway to understanding and optimizing pipeline coverage.
Follow these steps to get started:
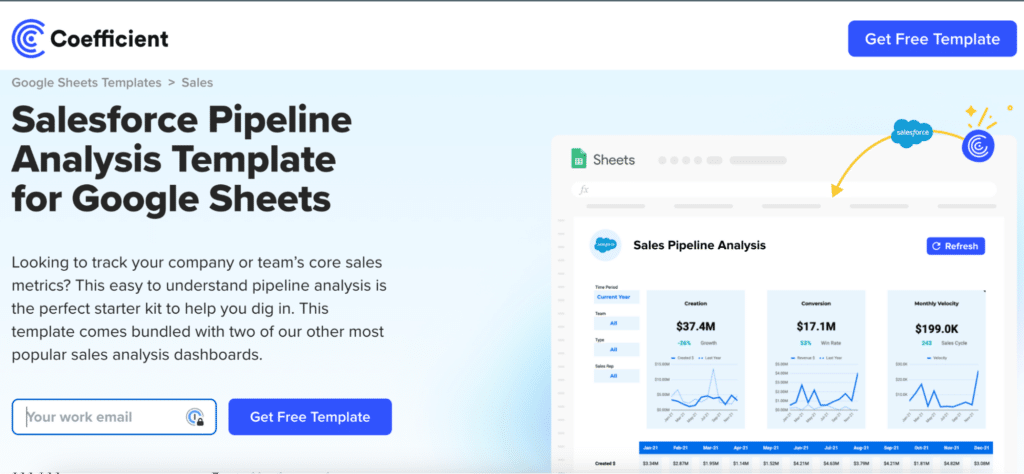
Step 1: Download the template
To start, head to Coefficient.io. Enter your work email in the box and click ‘Get Free Template.’
You can save the template to your Google account by clicking the ‘Use Template’ button at the top right corner of your screen.
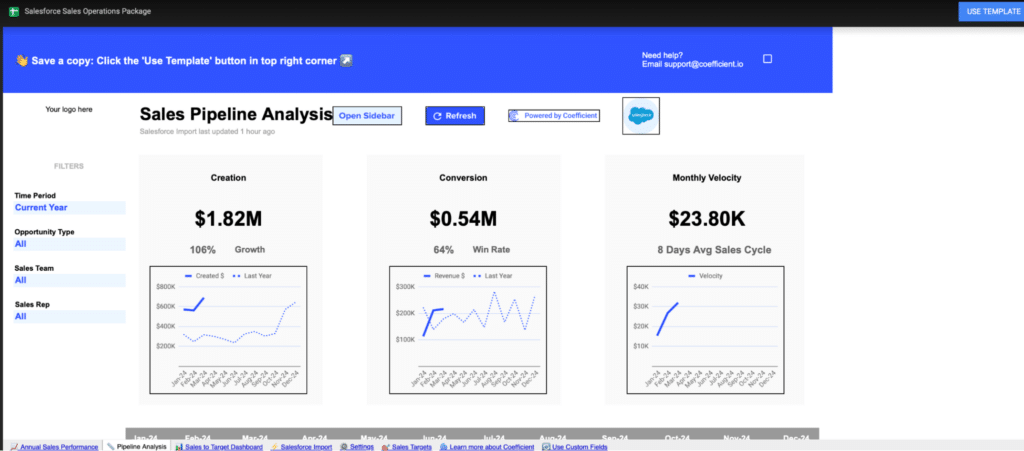
Your dashboard will open in a new spreadsheet associated with your Google account.
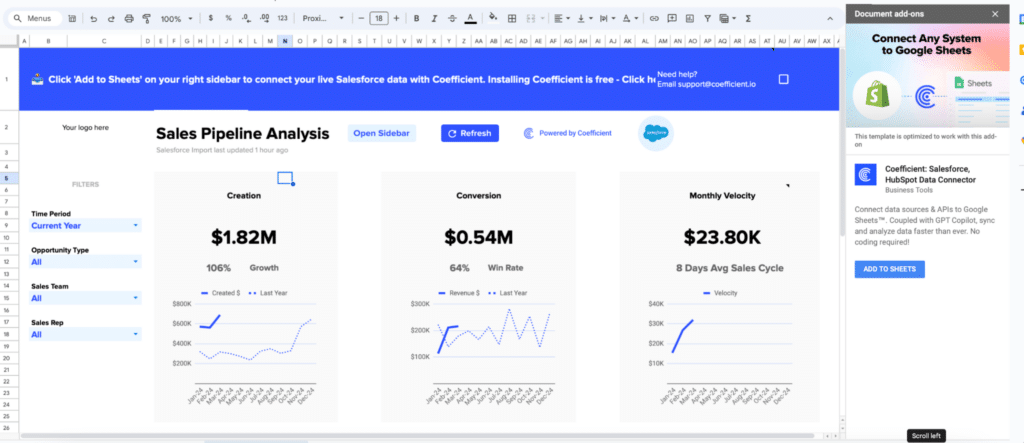
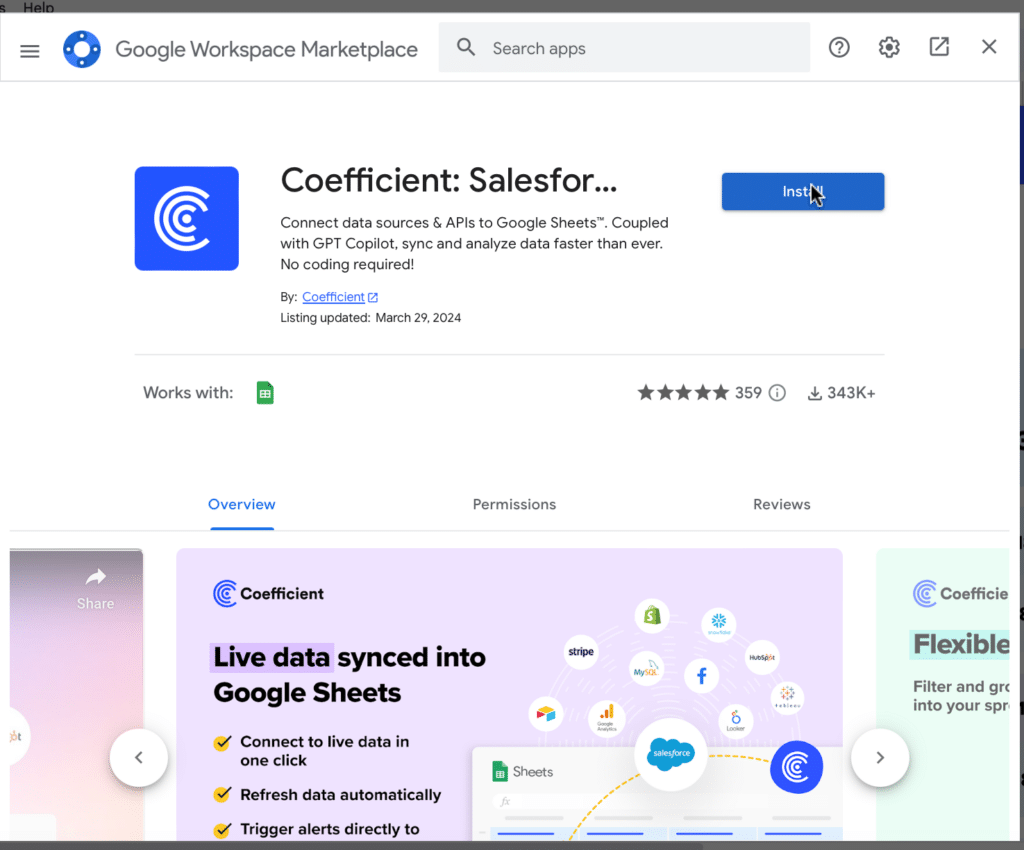
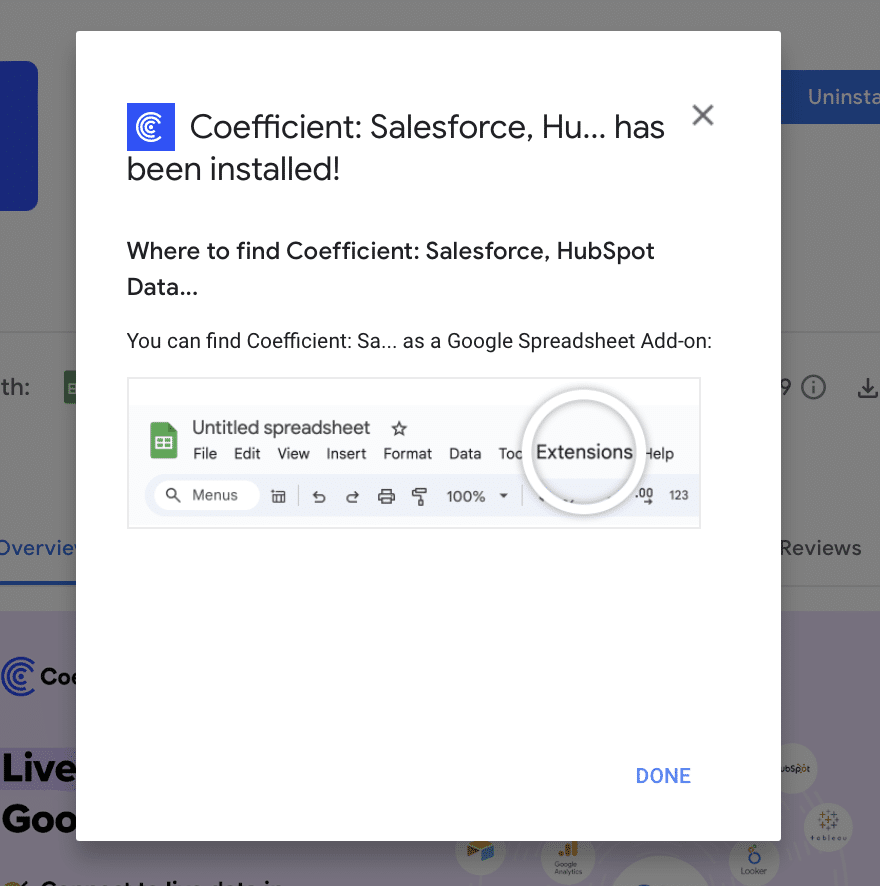
If this is your first time using Coefficient, you’ll need to add it as an add-on to Google Sheets. Click ‘Add to Sheets’ to continue.
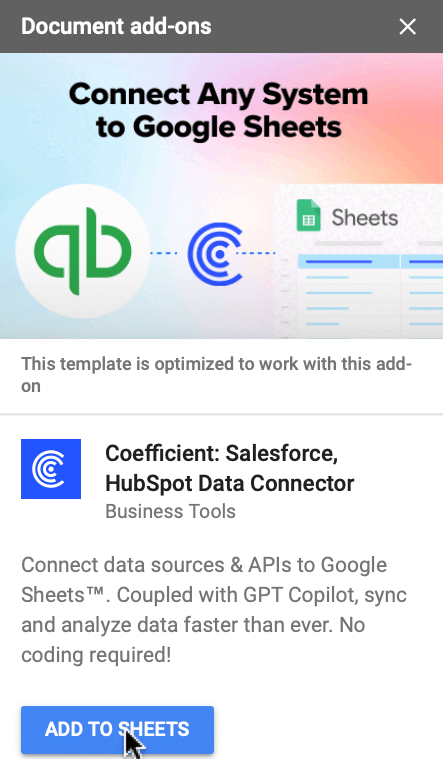
Hit the ‘Install’ button and follow the prompts to complete the installation.
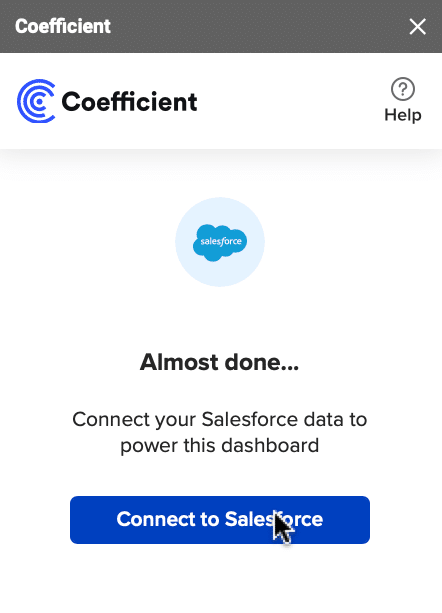
Step 2: Connect Coefficient to Salesforce
After installation is complete, hit ‘Done’ to return to your spreadsheet.
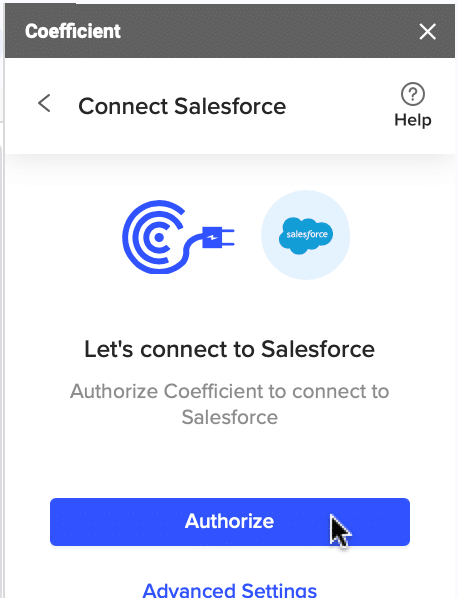
Click ‘Connect to Salesforce’ from the Coefficient menu on the right-hand side of your spreadsheet.
Follow the prompts to authorize Coefficient to your Salesforce account.
If successful, you’ll see the following notification at the top of your spreadsheet.

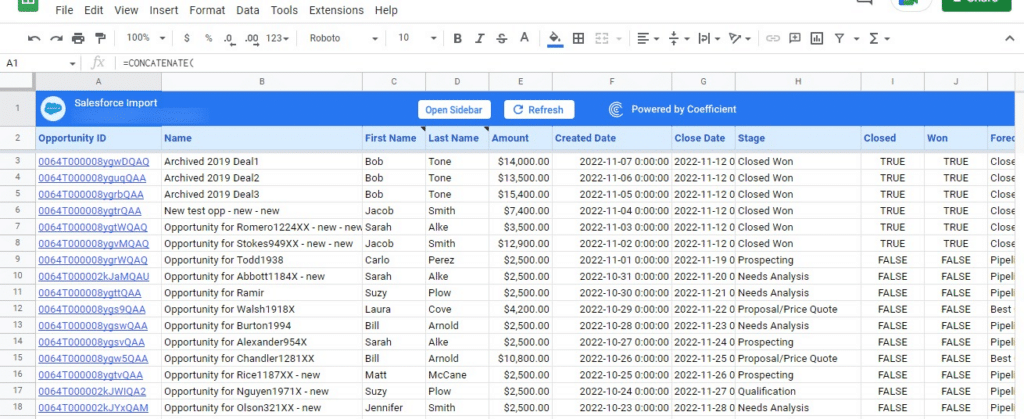
To update your data, navigate to the ‘Salesforce Import’ tab of your spreadsheet and click ‘Refresh.’
You can also auto-refresh your data by clicking ‘Set Refresh Schedule.’
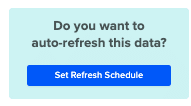
Set up an hourly, daily, or weekly auto-refresh schedule, and Coefficient will automatically update your data based on that time interval.
Set up an hourly, daily, or weekly auto-refresh schedule, and Coefficient will automatically update your data based on that time interval.
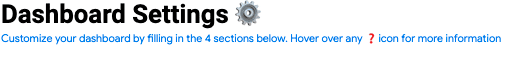
Step 3. Customize Your Dashboard
Tailor the template to your organization’s unique needs by navigating to the ‘Settings’ tab.
Company Information
Customize your company information, pipeline coverage ratios, pipeline stages, and team member details for a more personalized analysis.
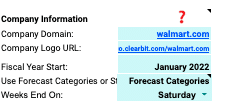
Personalize your dashboard by including your company’s domain URL, logo, and the start of your fiscal year. This ensures that the data and insights are specific to your organization and aligned with your financial reporting periods.
Pipeline Coverage Ratios
Fine-tune your pipeline coverage ratios based on your historical win rates.
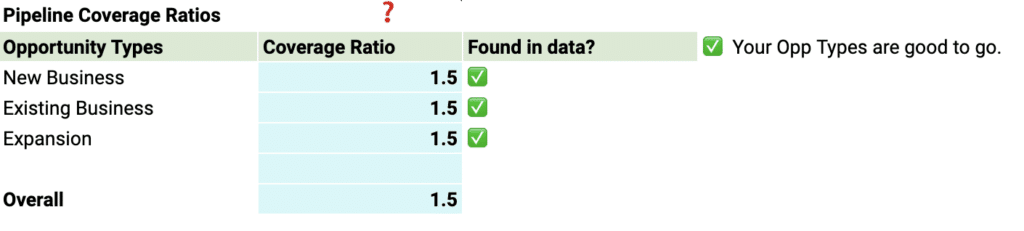
These ratios help you determine the number of opportunities needed in your pipeline to meet your sales targets, ensuring that you have a sufficient volume of potential deals to achieve your goals.
Pipeline Stages
Customize the pipeline stages in the template to mirror those in your Salesforce setup.
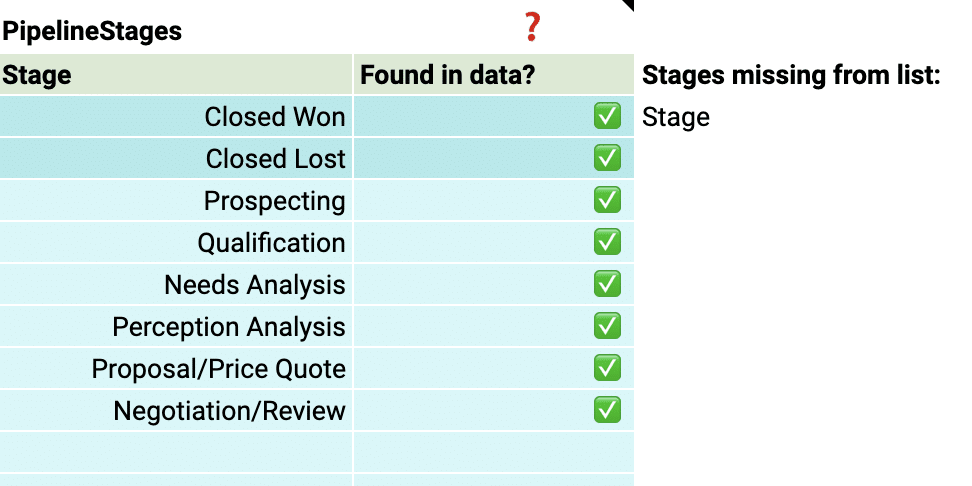
By aligning the stages in the dashboard with your sales process, you can gain accurate insights into the performance and velocity of your pipeline at each stage.
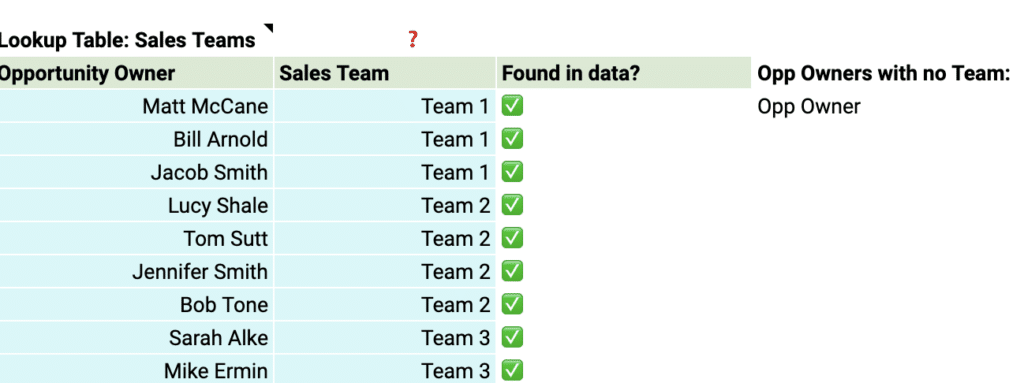
Team members
Add details about your sales team members to the dashboard for a more personalized analysis.
This allows you to track individual performance, identify top performers, and pinpoint areas where team members may need additional support.
With just a few simple customizations, you can transform the Pipeline Analysis Dashboard Template into a powerful tool tailored to your organization’s specific needs.
Deep Dive: Coefficient’s Sales Pipeline Analysis Templates
Coefficient’s Pipeline Analysis Dashboard provides two powerful dashboards that give you a comprehensive view of your sales pipeline: the Sales Pipeline Analysis dashboard and the Sales to Target dashboard.
Let’s dive into how these dashboards can help you optimize your sales process and drive revenue growth.
The Sales Pipeline Analysis Dashboard
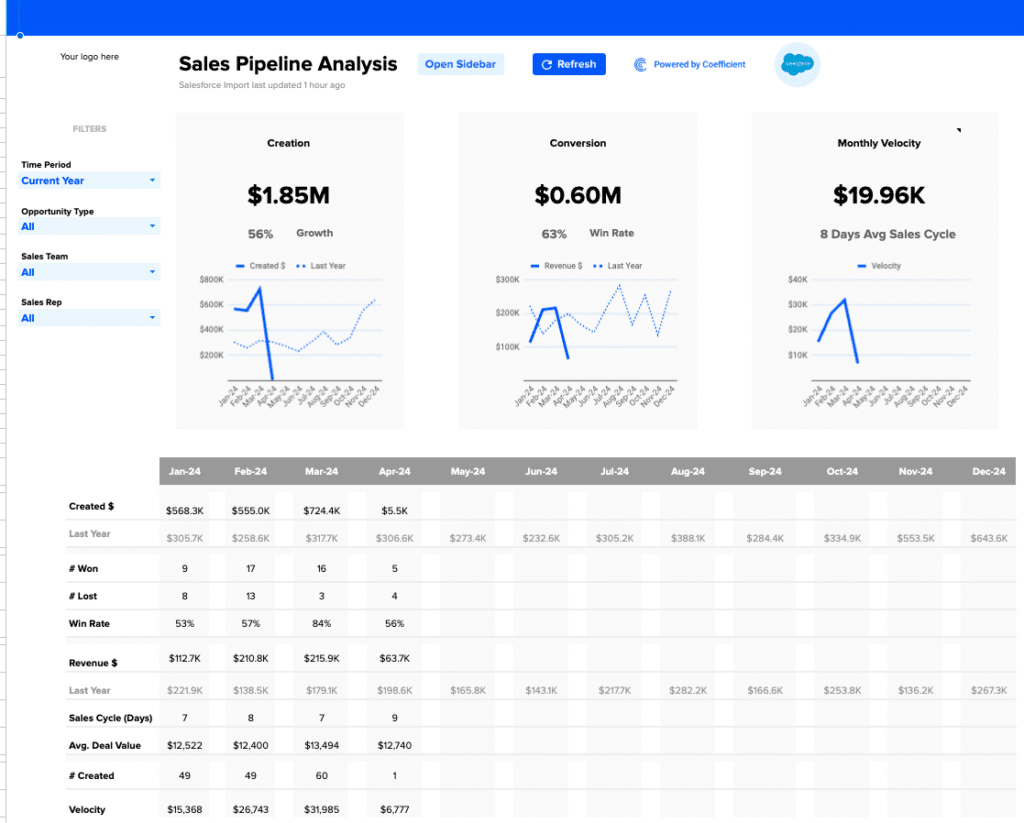
- Understand pipeline creation trends: Track the amount of pipeline generated each month and compare it to the previous year’s performance. This allows you to identify growth trends and seasonality in your pipeline generation.
- Evaluate pipeline conversion effectiveness: Monitor the percentage of pipeline that converts to won deals each month and compare it to the previous year. Use this insight to assess the health of your sales process and identify areas for improvement.
- Optimize your sales cycle: Keep an eye on the average number of days it takes for a deal to move through your sales cycle each month. This metric, known as sales velocity, helps you identify bottlenecks and optimize your sales process for faster closes.
- Perform in-depth pipeline analysis: Dive into the granular revenue operations data provided in the table beneath the graphs. This detailed data on pipeline creation, conversion rates, revenue, sales cycle length, deal value, and more allows you to pinpoint specific areas for improvement and take targeted action.
The Sales to Target Dashboard
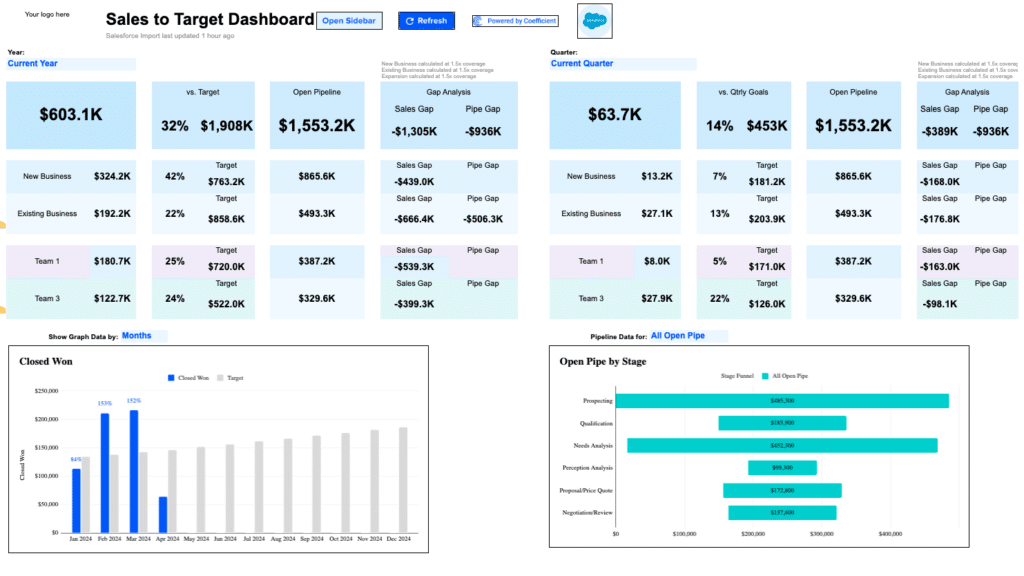
- Monitor performance against targets: Quickly see how you’re performing against your targets for key metrics like revenue, new business, existing business, and team-level performance. This at-a-glance view helps you stay on track and identify areas that need attention.
- Identify the sales gap: Compare your actual sales performance to your targets and see the gap between the two. This insight helps you prioritize efforts to close the gap and hit your goals.
- Ensure sufficient pipeline coverage: Check if you have enough open pipeline to meet your targets. The “Gap Analysis” section shows you the difference between your current open pipeline and the amount needed to reach your goals, informing your prospecting efforts.
- Monitor closed won deals: Track your progress towards hitting revenue goals by keeping an eye on the amount of closed won business each month compared to your targets. This graph helps you identify trends and make data-driven decisions.
- Analyze pipeline composition: See how your open pipeline is distributed across each stage of your sales process. This breakdown helps you identify where deals are getting stuck, so you can allocate resources effectively and improve your forecasting accuracy.
What is the Ideal Pipeline Coverage Ratio for B2B?
While there’s no one-size-fits-all answer, the overarching goal is predictability. Sales managers and leaders aim for a figure that ensures consistent achievement of revenue goals every sales cycle.
Effective pipeline management is the cornerstone of accurate sales forecasting, allowing for strategic adjustments to ensure sales goals are consistently met.
What is 3x Pipeline Coverage or 4x Pipeline Coverage?
A 3x pipeline coverage ratio indicates that the total value of opportunities in the pipeline is three times the sales quota, while a 4x pipeline coverage suggests that the total value is four times the sales quota.
Understanding pipeline coverage goes beyond these benchmarks. It’s about recognizing the nuances and intricacies of the sales cycle.
How Does Pipeline Coverage Influence Our Sales and Forecasting Strategies?
Effective pipeline management is foundational for accurate forecasting. It’s about gauging where you stand in relation to your sales goals. By being vigilant about sales forecasts, strategies can be quickly adjusted to ensure revenue targets are achieved.
How to Track Sales Pipeline Coverage Accurately?
Sales Pipeline Coverage Templates
Monitoring pipeline coverage accurately requires the integration of robust tools such as HubSpot and Coefficient. These platforms help salespeople bridge gaps in their reporting, track pipeline metrics accurately and consistently, ensuring everything you need to know is at your fingertips.
Checkout Coefficient’s free Sales Pipeline template!
5 Common Missteps in B2B Pipeline Management
1. Over-Reliance on a Few Big Deals
In B2B sales, it’s tempting to focus on a handful of high-value deals, thinking they’ll be the ticket to meeting quotas. However, this strategy can be a double-edged sword.
While big deals can significantly boost revenue, putting all your eggs in one basket can jeopardize predictability. It’s essential to diversify the pipeline with various deal sizes, ensuring a more stable and predictable sales outcome.
2. Sales and Marketing Misalignment
A common pitfall in many organizations is the disconnect between marketing teams and sales teams. Each department might be operating with different objectives, leading to disjointed efforts and missed opportunities.
To ensure a seamless sales process, it’s crucial for both teams to have aligned goals, collaborate closely, and share insights. This alignment can bridge the gap and drive more cohesive pipeline management strategies.
3. Poor CRM Hygiene
A sales pipeline management tool or CRM, like Salesforce, is the backbone of effective pipeline management. However, its efficacy diminishes if not regularly updated. Outdated or incorrect data can lead to missed opportunities and misinformed strategies.
To maximize the benefits of a CRM, sales reps should be diligent in maintaining its hygiene, ensuring that all data is current and accurate.
4. Inconsistent Follow-Ups
The importance of consistent communication in sales cannot be overstated. Without a structured follow-up process, potential clients might slip through the cracks, leading to missed opportunities or even a loss of trust.
Implementing a consistent follow-up schedule, aided by CRM reminders, can ensure timely communication, nurturing leads towards becoming closed deals.
5. No Lead Nurturing
Focusing solely on leads that appear ready to buy can be a short-sighted approach. Many qualified leads might need more time, information, or persuasion before they’re ready to commit.
Neglecting these leads means potentially losing out on deals that, with a bit more effort, could have been sealed. A robust lead nurturing strategy, involving regular check-ins and content sharing, can warm up these leads, increasing their likelihood to convert.
6. Over-Optimism
Setting ambitious sales targets can be motivating for sales reps. However, being overly optimistic can backfire. If sales targets are consistently unrealistic and unmet, it can demoralize the sales team and skew pipeline management strategies.
It’s essential to set realistic targets based on past performance, market conditions, and current capabilities, ensuring that they’re both challenging and achievable.
9 Strategies to Boost Pipeline Coverage in B2B Sales
Our experts recommend a combination of lead generation and enablement tactics to enable optimal sales efficiencies. The importance of automation and pricing adjustments is also highlighted, along with an emphasis on refining the sales process and improving conversion rates.
Let’s dive into each.
1. Enhanced Prospecting
To effectively reach the right audience, it’s essential to harness the power of intent data. Engaging in social selling, employing lead scoring, and utilizing targeted remarketing can further refine your prospecting efforts, ensuring you’re connecting with potential clients who are genuinely interested.
2. Referrals: Building Trust through Existing Connections
Referrals are a goldmine in B2B sales. By leveraging satisfied customers and partners, you can expand your network and tap into high-quality leads that come with an inherent level of trust.
3. Affiliate Programs & Partnerships: Collaborating for Growth
Establishing meaningful partnerships, especially with consultants, can open doors to new opportunities. By leveraging their networks and expertise, you can amplify your reach and tap into new customer bases.
4. Cross-Selling and Upselling: Maximizing Existing Relationships
Your existing customer base is a treasure trove of opportunities. By identifying areas for cross-selling and upselling, you can not only increase your sales quota but also solidify and deepen your relationships with clients.
5. New Market Expansion: Diversifying Sales Territories
Expanding into new regions or industries can be a strategic move to diversify your sales territories. This approach not only spreads risk but also uncovers fresh revenue streams, ensuring sustained growth.
6. Channel Experimentation: Broadening Sales Strategies
Diversifying your sales strategies can lead to unexpected success. If you’ve been primarily focused on either inbound or outbound tactics, consider blending the two. This hybrid approach can reach a broader audience and bring in diverse leads.
7. Better Sales Training: Investing in Your Salespeople
Your sales team is only as good as their training. By equipping them with the latest strategies, tools, and insights, you’re investing in their success, boosting your company’s performance.
8. Improving Sales Enablement: Streamlining the Sales Process
A well-equipped sales team is a successful one. Streamlining the sales process by providing your team with the necessary resources, tools, and information ensures they can close deals efficiently and effectively.
9. Thought Leadership: Establishing Market Authority
Positioning your brand as a thought leader can set you apart in a crowded market. Collaborate with recognized industry entities like Forrester, G2, and McKinsey to bolster your brand’s authority and trustworthiness.
Weighted vs. Unweighted Sales Pipeline
Both the weighted and unweighted sales pipelines are crucial metrics that businesses use to predict future sales and revenue. However, they approach this prediction from different perspectives.
By comparing the unweighted and weighted sales pipelines, businesses can gain insights into the quality of their leads and the effectiveness of their sales strategy. The disparity between the two values can also shed light on potential challenges in the sales cycle and areas for improvement.
How is the Unweighted Sales Pipeline Calculated?
An unweighted sales pipeline simply adds up the value of all deals in the pipeline, irrespective of their stage or likelihood of closing.
- List all active deals: Begin by listing out all the deals currently in your pipeline.
- Assign a value to each deal: This is typically the potential revenue from each deal.
- Sum up the values: Add together the values of all the deals.
Example:
- Deal A is worth $10,000
- Deal B is worth $15,000
- Deal C is worth $5,000
Unweighted Sales Pipeline = Deal A + Deal B + Deal C = $30,000
How is the Weighted Sales Pipeline Calculated?
The weighted sales pipeline takes into account the stage of each deal and assigns a probability to each stage. This provides a more realistic view of the potential revenue, as not all deals will close.
- List all active deals: As with the unweighted pipeline, start by listing all deals.
- Assign a value to each deal: Determine the potential revenue from each deal.
- Assign a closing probability to each deal: Based on the deal’s stage in the sales funnel. For instance, a deal in the “Prospect” stage might have a 10% chance of closing, while one in the “Negotiation” stage might have an 80% chance.
- Multiply the deal value by its closing probability: This gives you the weighted value of each deal.
- Sum up the weighted values: Add together the weighted values of all the deals.
Example:
- Deal A is worth $10,000 and is in the “Prospect” stage with a 10% closing probability. Weighted value = $10,000 * 0.10 = $1,000
- Deal B is worth $15,000 and is in the “Negotiation” stage with an 80% closing probability. Weighted value = $15,000 * 0.80 = $12,000
- Deal C is worth $5,000 and is in the “Proposal” stage with a 50% closing probability. Weighted value = $5,000 * 0.50 = $2,500
Weighted Sales Pipeline = $1,000 + $12,000 + $2,500 = $15,500
Master Pipeline Coverage for Predictable Sales
By following the pipeline coverage best practices outlined in this guide, businesses can ensure a more streamlined, efficient, and effective sales process. These strategies not only provide clarity on the journey from prospect to profit but also make it more predictable and manageable.
Try Coefficient for free today to see how it can streamline your pipeline coverage analyses and more.
About the Experts
Emerson McCuin, RevOps Manager at HAAS Alert:
Emerson is a seasoned RevOps professional with a passion for CRM and automation tools like HubSpot. With a keen focus on collaborating with GTM leaders, Emerson’s expertise lies in strategizing around goals, KPIs, and action plans. He’s an active member of the RevOps community, sharing insights and knowledge to elevate businesses by optimizing expenses and costs and maximizing revenue. (LinkedIn)
Saahil Dhaka, Founder and CEO, Clientell:
Saahil is an entrepreneur dedicated to helping business leaders harness the power of machine learning for smarter decision-making. With a background spanning startups to AI in sales, he offers a scientific approach to sales processes and pipeline management. Saahil is passionate about crafting competitive GTM strategies that give revenue teams an edge. (LinkedIn)
Cody Kimball, RevOps and GTM Leader, Entrata:
With over a decade of experience in data and technology, Cody is a corporate development leader specializing in analytics, operations optimization, and preparing organizations for enterprise growth. He’s adept at aligning organizations with business processes backed by relevant KPIs. Cody’s strengths encompass data analytics, leadership, and brand cultivation. He’s known for bridging the gap between technical and business aspects, ensuring seamless integration of technology, strategy, and operations. You can tap on his skills at getthedataguy.com (LinkedIn)


