Get a 360° View of Your Funnel with Our Free Sales Pipeline Template
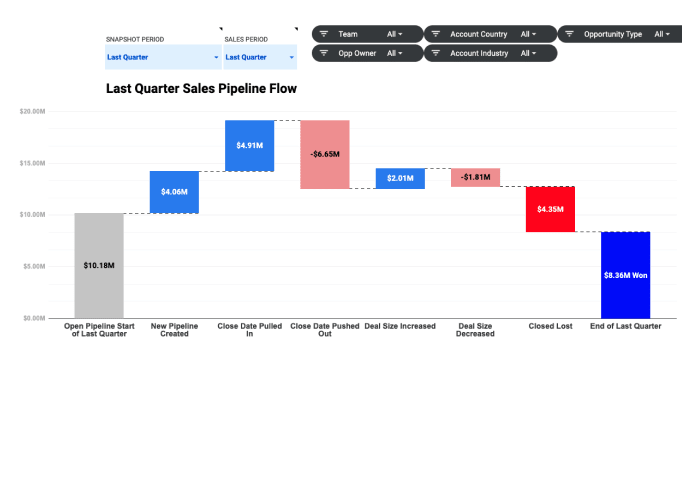
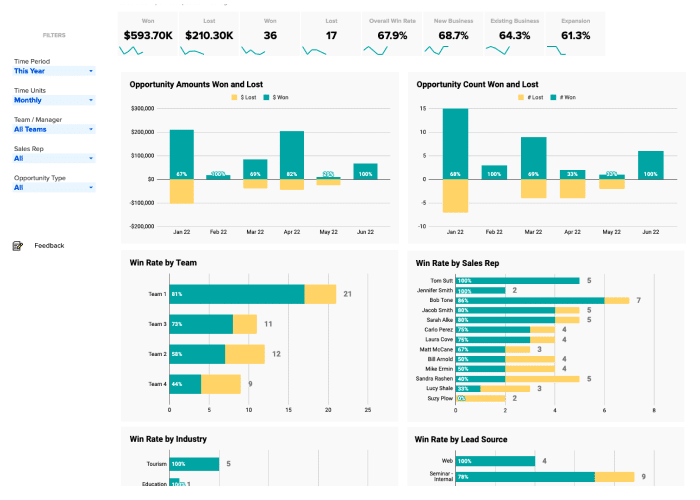
Get your sales pipeline management process started in seconds with our pre-built sales funnel template, purpose-built to help you understand your core sales operations metrics.
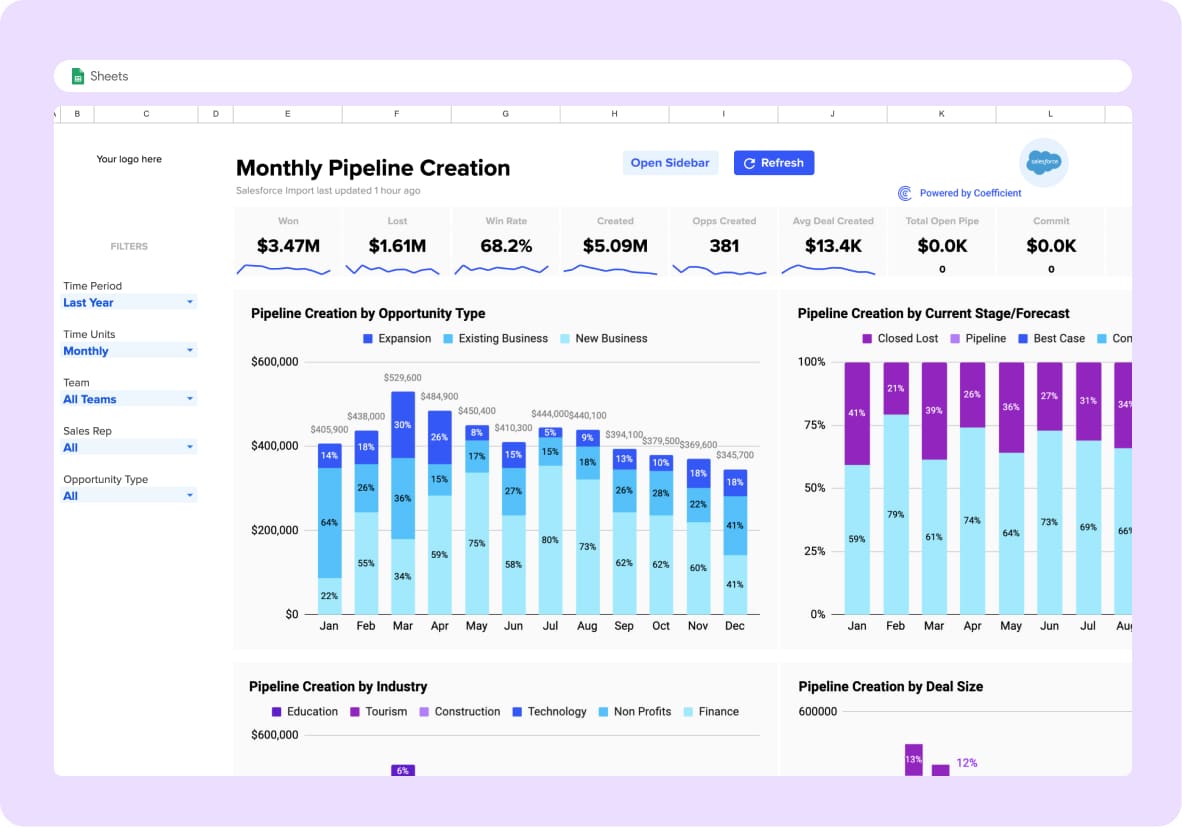
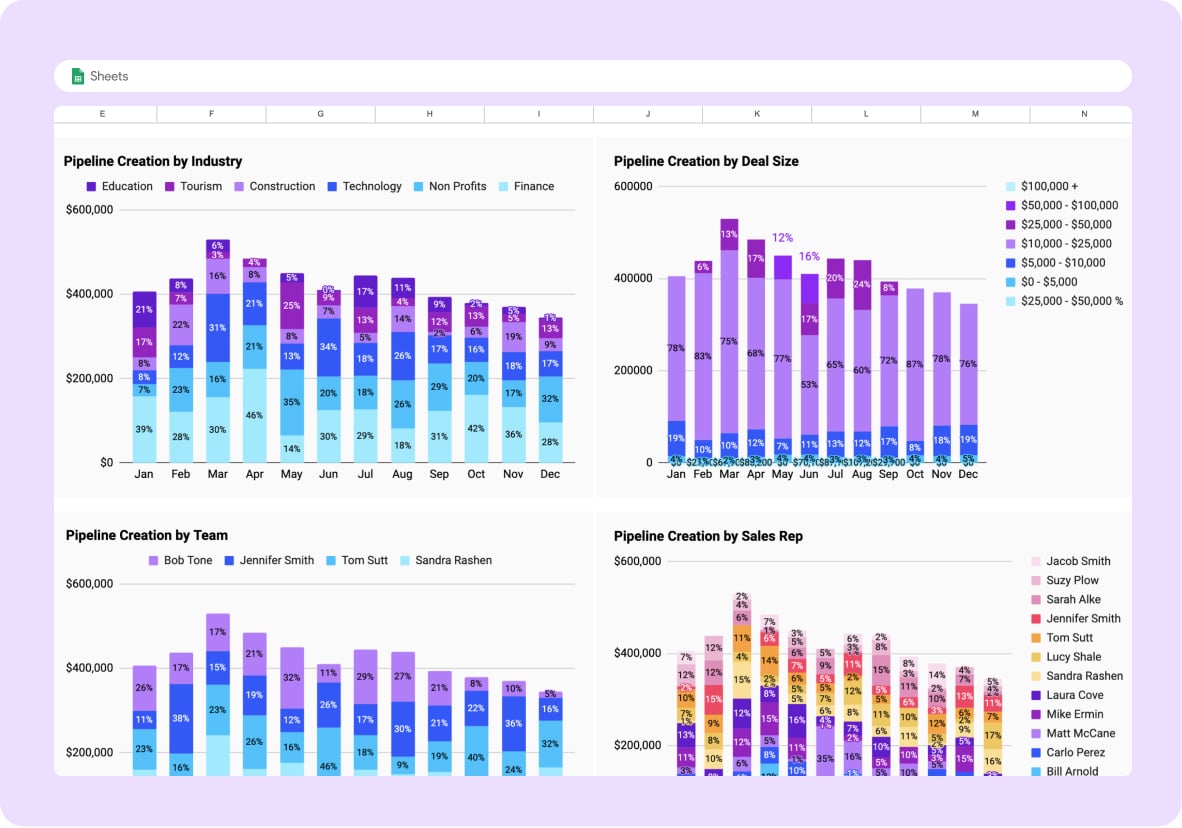
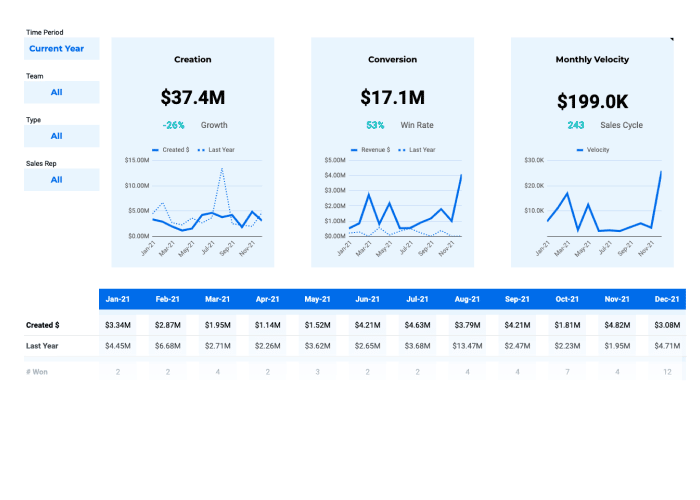
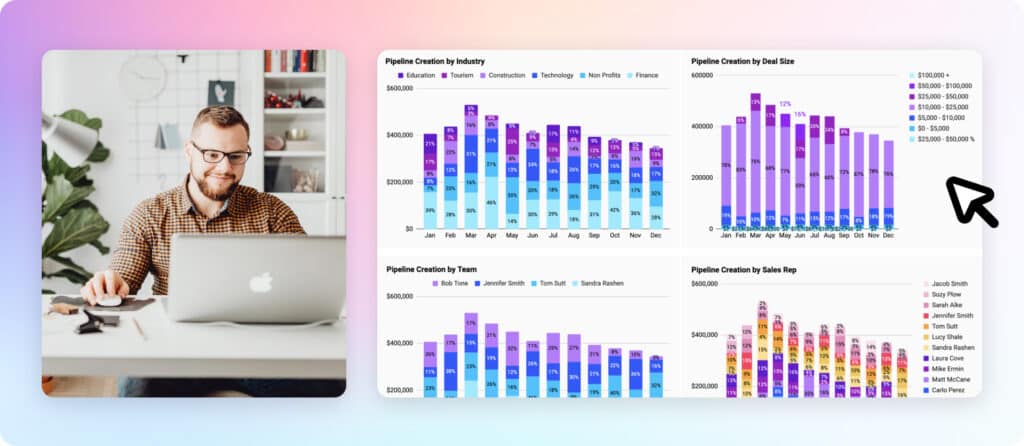
Harness a 360° view of pipeline creation in a single click. Visualize key pipeline creation metrics by day, week, or month, so you can adjust prospecting tactics, create a surplus of opportunities, and reach your sales goals.
Coefficient’s Pipeline Creation Dashboard makes it easy to filter your sales activities data by sales team members, sales cycle, time period, opportunity type, or more directly in Google Sheets.
- Visualize all the core metrics of pipeline creation with pre-built dashboards, by team or by sales rep.
- Track pipeline creation by opp type, industry, deal stage, source, and other critical segments.
- Monitor overall pipeline performance, including win rate, opportunities created, closed won/lost, and more.
- Automatically connect to real-time data in Salesforce to access fresh metrics.
What is a Sales Pipeline Dashboard?
A sales pipeline dashboard is a visual interface that provides a comprehensive overview of all sales opportunities at various sales pipeline stages.
It offers real-time insights into key metrics such as deal size, deal stage, and expected close date by sales rep. Sales pipeline dashboards facilitate proactive pipeline management by allowing teams to track progress, identify bottlenecks, and strategize effectively.
Dashboards are crucial for team collaboration and help salespeople track sales, pursue new leads or new business, and reach their sales goals.
What Should be in a Sales Pipeline Report?
A sales pipeline report should include key metrics that reflect the health and performance of the sales pipeline. These include the following segmented by individual and team performance:
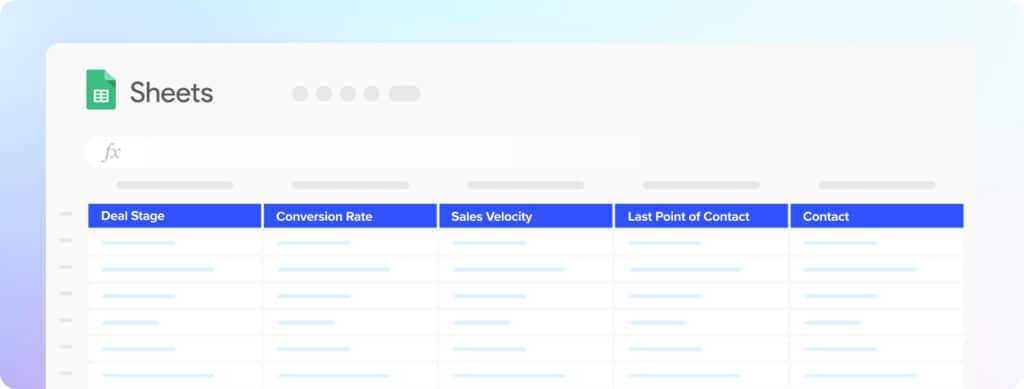
- Number of deals at each stage
- Average deal size
- Conversion rate
- New sales leads
- Sales velocity
It should also include historical data for trend analysis and future sales forecasting.
Fortunately, solutions like Coefficient allow you to streamline your analysis workflow while ensuring accuracy and saving time. With a suite of integrated apps and follow-up capabilities, you can manage potential customers efficiently and optimize your lead generation process.
