Maximize Wins. Cut Losses. Accelerate Revenue.
Coefficient’s Win-Loss Template empowers sales professionals to monitor conversion rates across all sales units and reps using a centralized, pre-built Salesforce dashboard in Google Sheets to better inform your decision-making process. Accelerate revenue growth by reinvesting in winning initiatives, and cutting losing strategies quickly.
Launch our free Win-Loss Analysis Template in one click.
- Pinpoint how company, team, and individual win rates fluctuate over time.
- Identify performance trends early to double-down on wins or adjust your sales process where you have lower win rates.
- Generate a clean list of recently lost opportunities and why they failed.
- Receive a Slack or email alert every time a new deal is lost.
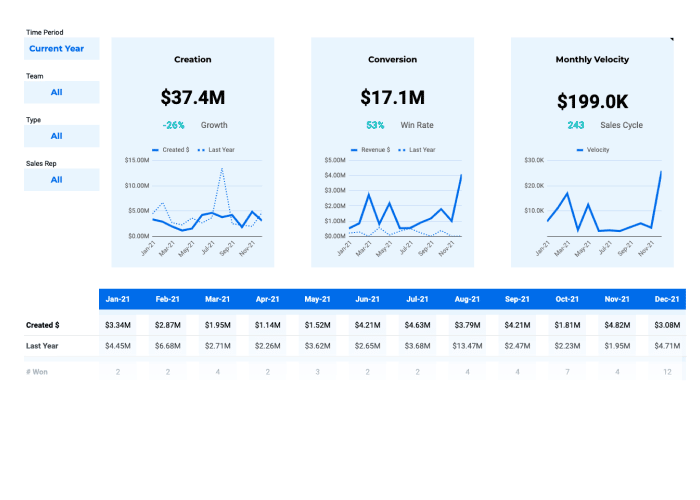
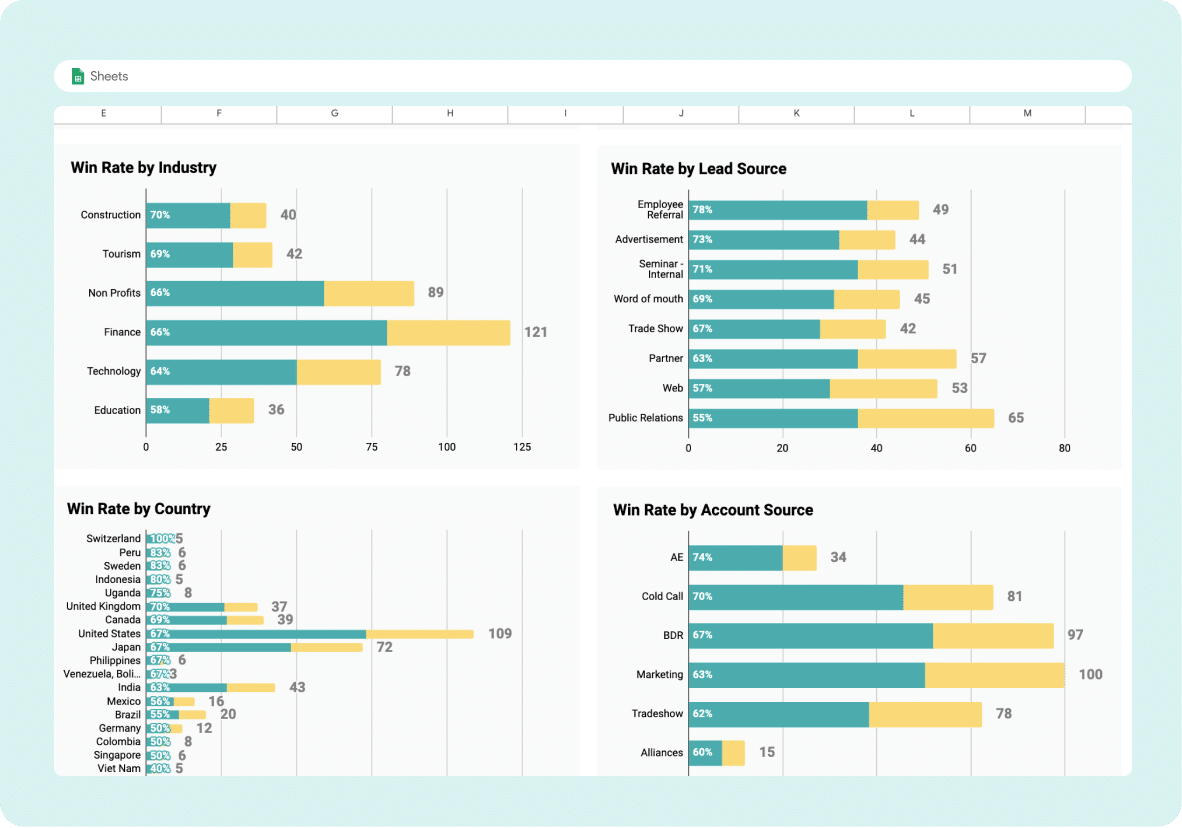
Metrics tracked in the template
Your complete win-loss command center.
This template automatically pulls and visualizes the metrics that matter most from your Salesforce data:
- Total opportunity amounts – Track both won and lost deal values over time to understand revenue impact
- Opportunity counts – Monitor the volume of won vs. lost deals to spot velocity changes
- Overall win rate – See your company-wide conversion percentage at a glance
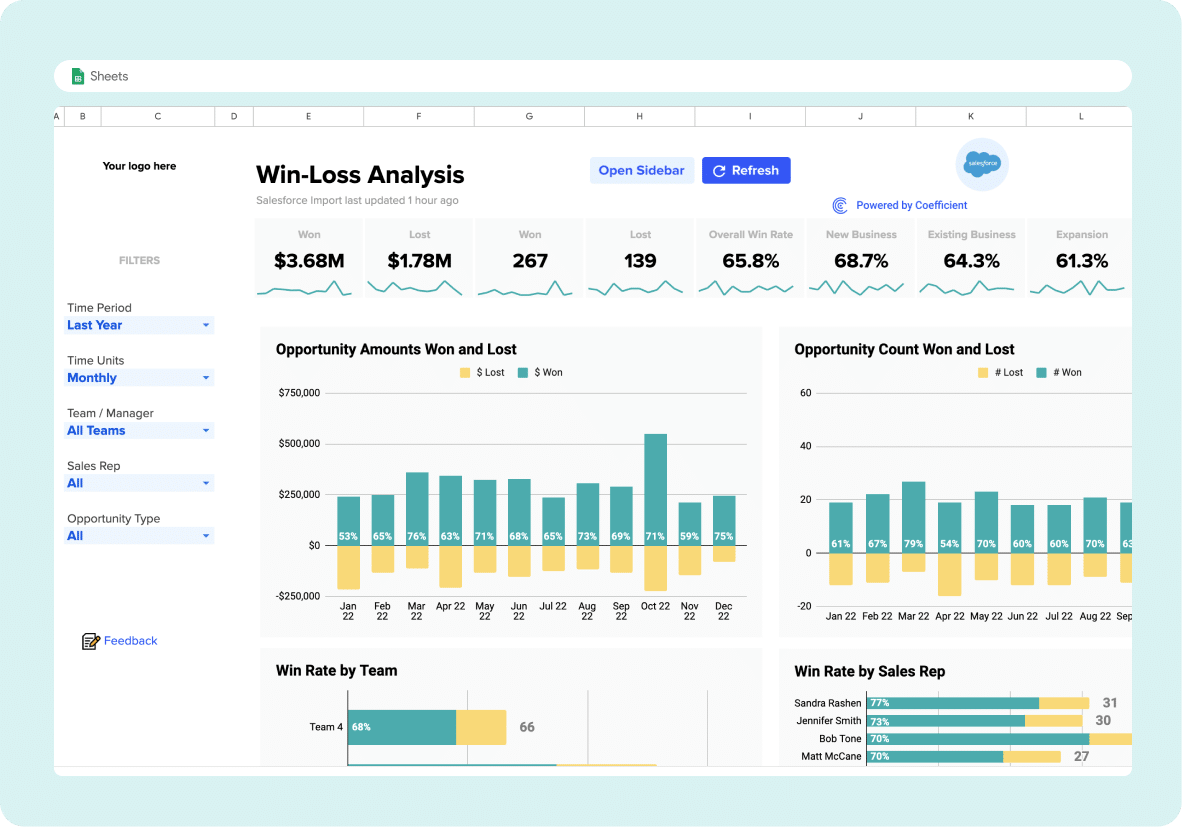
- Win rate by team – Compare performance across different sales teams to identify top performers
- Win rate by sales rep – Track individual rep conversion rates and rankings
- Win rate by industry – Discover which verticals yield the highest success rates
- Win rate by lead source – Understand which channels generate the most winnable opportunities
- Win rate by country – Analyze geographic performance patterns
- Win rate by account source – Compare conversion rates across different account types
- Win rate by opportunity size bucket – See how deal size impacts close probability
- Win rate by opportunity age – Understand how time-to-close affects win likelihood
- Recently lost opportunities list – Review detailed records of recent losses for immediate analysis
Every metric updates automatically. No manual calculations. Just instant visibility into what drives wins and losses.
How to use the win loss analysis template
Getting started takes minutes. Not hours.
- First, click “Get Free Template” and make a copy in your Google Sheets account. The template comes pre-built with all formulas, charts, and formatting—no setup required on your end.
- Next, connect your Salesforce data using Coefficient’s one-click connector. Simply authenticate your Salesforce account, select the Opportunity object, and choose which fields to import. The template automatically maps your data to the right cells and calculations.
- Configure your analysis parameters by selecting date ranges, teams, and segments you want to track. The dashboard updates instantly as you adjust filters, giving you real-time insights into win-loss patterns across any dimension.
- Set up automated refreshes to keep your analysis current. Schedule daily, weekly, or custom refresh intervals so your dashboard always reflects the latest opportunity data. Enable Slack or email alerts to notify stakeholders when specific thresholds are met—like win rates dropping below target levels.
- Finally, share the dashboard with your team for collaborative analysis. Grant view or edit access to sales managers, RevOps, and executives who need visibility into performance trends. Everyone works from the same real-time data source.
Who is this template built for?
Sales leaders use this template to track team performance and identify coaching opportunities. They can quickly spot which reps need support and which strategies drive the highest win rates across their organization.
RevOps teams rely on it to optimize the entire sales process. The template reveals pipeline bottlenecks, conversion trends, and deal velocity metrics that inform process improvements and resource allocation decisions.
Sales reps leverage the analysis to understand their personal performance patterns. They can see which deal types they win most often and adjust their approach to focus on high-probability opportunities.
Marketing teams extract insights about competitive positioning and messaging effectiveness. Loss reason data shows where prospects choose competitors, informing campaign strategy and sales enablement materials.
Executives gain visibility into revenue predictability and sales efficiency. The template provides the performance metrics needed for board reporting, forecasting accuracy, and strategic planning decisions.
Why is it Important to do a Win-Loss Analysis?
Win-Loss analyses are a crucial part of any sales strategy as they help leaders understand what strategies are working – and which aren’t. This understanding provides valuable insights into team performance and can help increase win rates.
In addition to helping leaders refine their tactics, an in-depth analysis of wins and losses can help inform decisions to improve your organization’s products, services, messaging, or sales enablement efforts. They can also help give a sense of your competitive landscape and competitive advantages within your market.
When to use the win-loss analysis
- After every quarter ends – Review quarterly performance within the first week to identify trends while context remains fresh. Compare results against targets and previous periods to spot emerging patterns that require immediate attention. Use these insights to adjust tactics for the upcoming quarter.
- During pipeline reviews – Pull up win-loss data during weekly pipeline calls to add context to current deals. Historical patterns reveal which opportunities mirror past wins or losses, helping reps prioritize efforts on high-probability deals while addressing risk factors early.
- Before major strategic decisions – Analyze win-loss trends before launching new products, entering markets, or restructuring territories. Past performance data validates assumptions and highlights potential challenges, ensuring strategic moves are grounded in actual customer behavior rather than speculation.
Win Loss Analysis Best Practices
If used correctly, a win-loss analysis can serve as a powerful tool for continuous learning and improvement.
Follow these five best practices to ensure you’re getting the most out of your win-loss program:
- Regular Review and Update: Continually review and update your analysis to reflect current market conditions and business strategies. Coefficient’s Auto-Refresh functionality ensures your data remains up-to-date, providing accurate insights.
- Involve Relevant Stakeholders: Win-loss analysis should be a collaborative effort involving all relevant stakeholders. This includes not only the sales team but also marketing, product development, and customer service teams. Each team can provide unique perspectives that can enhance your analysis.
- Consistent Methodology: Use a consistent methodology for evaluating wins and losses. This ensures the accuracy and reliability of your analysis. Consistency in your approach allows for more accurate comparisons and trend identification over time.
- Objectivity: Be objective in your analysis and avoid bias to ensure you look at data from all different angles. This includes considering any factor that could’ve influenced the outcome of a deal, including product features, pricing, competition, and sales tactics.
- Automation and Data Integrity: Leverage automation tools like Coefficient to save time, reduce errors, and ensure data integrity. Automating data sync between Salesforce and Google Sheets improves data accuracy and allows you to focus more on analysis and strategy.

How do I do Win-Loss Analysis in Google Sheets?
There are two simple ways to do win-loss analysis in Google Sheets,
1. Manually export – Exporting your CRM data manually as a CSV every time, upload it into your sheet, and then calculate your win and loss rates.
2. Pre-built connector – Using a solution like Coefficient to automatically pull data regularly from your CRM directly into Google Sheets for analysis.
What is a Good Win-Loss Ratio in Sales?
A good win-loss ratio is unique to every company, depending on its industry and specific goals. However, a ratio above 50% is generally considered good, indicating that more deals are being won than lost.

That said, benchmarking your win-loss ratio against industry averages is useful. The average win rate across industries is 47%.