


Table of Contents
![]()
- 1. 10 B2B Sales Dashboards for RevOps Teams in 2026
- 2. How to build a lead generation dashboard in Google Sheets
- 3. Sales Performance Dashboard: Free Spreadsheet Template
- 4. How to Build a Sales Dashboard in Google Sheets
- 5. Sales KPIs Dashboard: 4 Free Google Sheets Templates
- 6. Free Sales Templates: SalesOps Dashboards for Google Sheets
- 7. 5 Sales Tracking Spreadsheet Templates for Reporting
- 8. Opportunity History Template: Track Sales Forecast Changes


Building Salesforce dashboards to track sales forecast changes is arduous. Salesforce’s native reporting capabilities are often limited and inflexible. But that doesn’t change the fact that leadership needs the dashboards right now. Or that you have a dozen other “urgent” tasks on your plate.
Coefficient’s Opportunity History Template for Google Sheets, shown below, eliminates all these headaches in a matter of clicks. The template instantly launches pre-built Salesforce dashboards in Sheets to track sales forecast fluctuations over the past day, week, month or quarter. Now you can finally unlock the full potential of the Salesforce Opportunity History Report.
And the best part? Coefficient automatically updates the dashboards, so they’re always up-to-date with your live Salesforce data. And you can also set up Slack or email alerts so you get notified immediately when an opportunity is edited and significantly affects your forecast.
Read on to learn about our Opportunity History Template, including how to set it up and start using it.
Salesforce Opportunity History Field Tracking
In Salesforce, Opportunity History Field Tracking is a robust report that tracks the change history of key opportunity fields, including old and new values and edit dates. Object information types include History Data, Opportunity Fields, and Opportunity Owner Information. The report is not enabled by default.
However, the report’s rich potential is restricted by Salesforce’s cumbersome reporting capabilities. Limitations with summary formulas and inline calculations, difficulties cross-referencing objects in reports, and constant filter logic configurations are just a few of the familiar challenges of Salesforce reporting.
That’s where Coefficient’s pre-built dashboard templates come in.
Opportunity History Template: Automate Salesforce Insights in Google Sheets
Coefficient’s pre-designed templates take the work of building Salesforce dashboards off your plate. Templates instantly launch Salesforce dashboards in Google Sheets. In a few clicks, templates import live Salesforce data into Sheets, and automatically generate visualizations that give you fresh insights into your sales data.
Coefficient’s Opportunity History Template enables you to track sales forecast changes directly from Google Sheets. The template shows how new sales pipelines, lost opportunities, changing close dates, and up-sells impact your bottom-line revenue streams.
Forget analyzing your sales data for hours. With Opportunity History Template, you can access these insights in just a few clicks. The template unleashes the full potential of Salesforce’s Opportunity History Field Tracking:
- Track your sales pipeline over any period of time
- Identify opportunities with value changes or time frame modifications
- Set custom fiscal year periods and monitor changes by month, quarter, or year
- Slice and dice opportunity changes by sales team, opportunity type, or account details
- Identify changes to close dates, opportunity amounts, and other fields that affect sales forecast
You can launch our free Opportunity History Template in less than a minute. Give it a try! Here’s a step-by-step walkthrough on how to launch the template.
How to Set Up Opportunity History Template in Under 60 Seconds
Step 1: Enable Opportunity Field History Tracking
First, you’ll need to enable Opportunity Field History Tracking in Salesforce. Specifically, field history on the opportunity object needs to be enabled. If it’s already enabled in your org, you can skip this section.
If you’ve never turned on Opportunity Field History Tracking, you’ll have to wait a few days/weeks before the template will show significant data. Salesforce does not collect this data unless the feature is turned on.
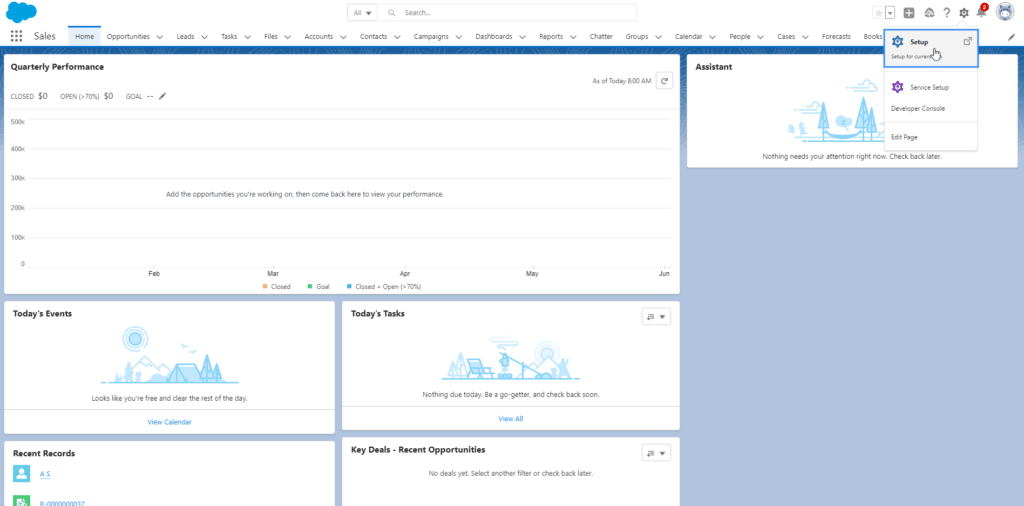
In Salesforce, navigate to Setup.
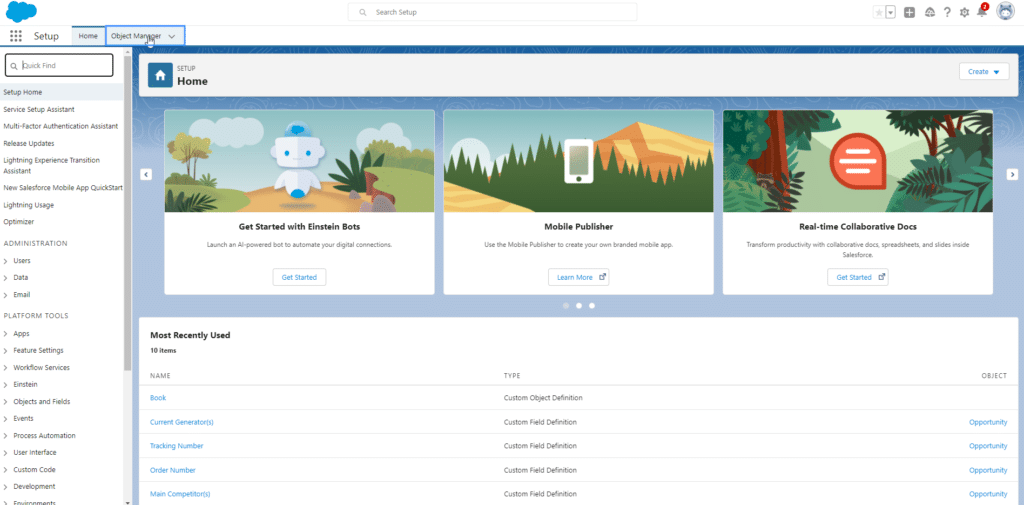
Now, click Object Manager located in the top menu.
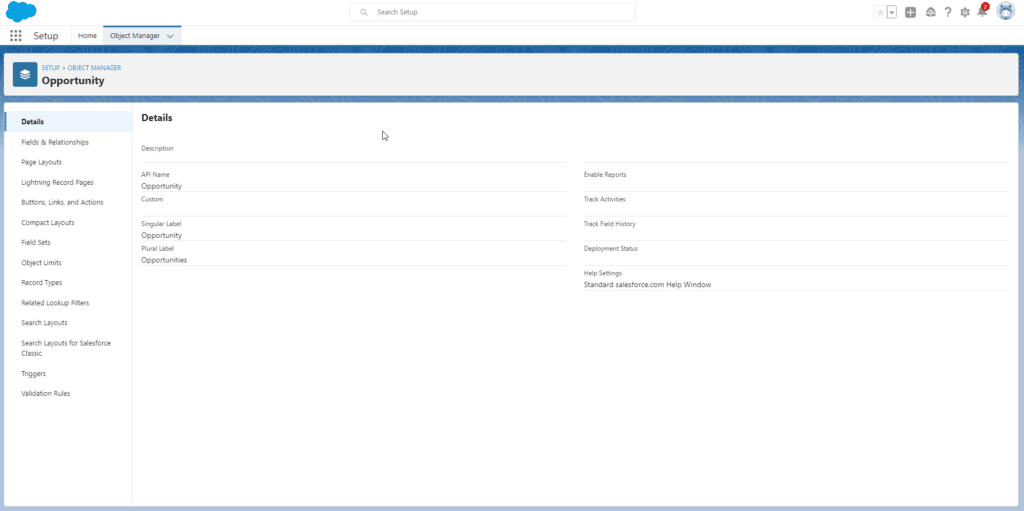
Select an Opportunity object.
Enter Fields & Relationships and use checkboxes to enable field history. You’ll need to check the box at the top-left which says Enable Opportunity Field History, then you’ll need to make sure that the following are included:
- Close date
- Stage
- Amount
- Quantity
- Forecast Category
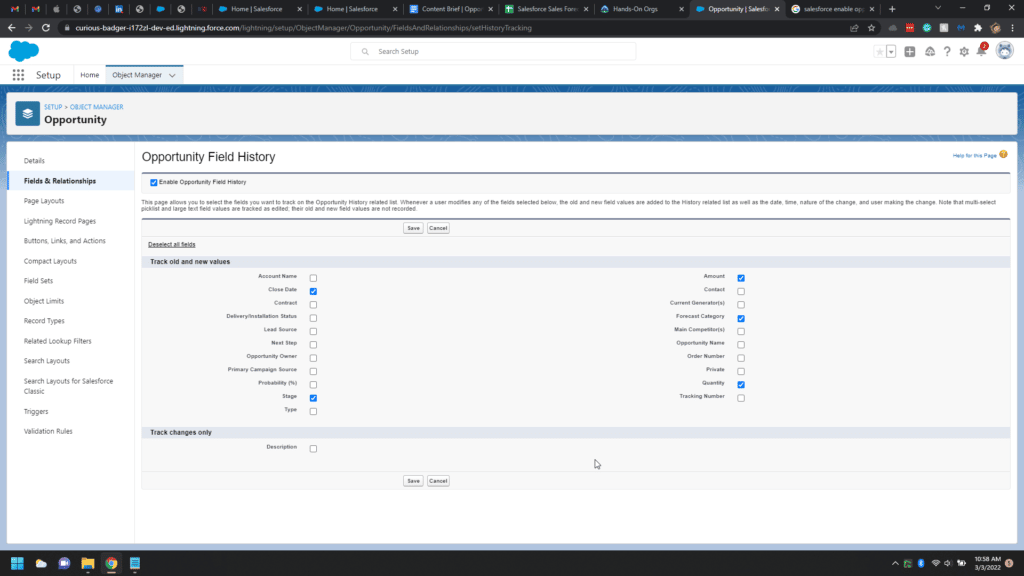
Click save and you’re done!
Step 2: Copy the Opportunity History Template
Next, navigate to the Opportunity History Template.
Go to File and click Make a copy.
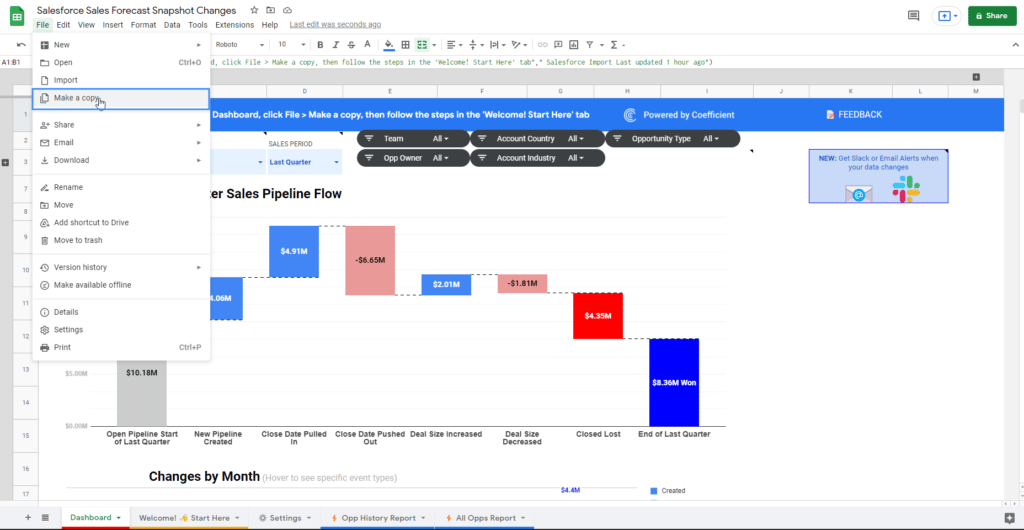
You’ll be asked where the document should be placed. You can place it anywhere in your Google Drive and rename it as desired. Then click OK.
Step 3: Install Coefficient
If you do not have the Coefficient app, you’ll need to install it. If you already have Coefficient, skip this step.
Open a Google Sheets page, go to Extensions, then Add-ons, and click Get Add-ons. You will see a modal window with the Add-on store. Type Coefficient in the search bar.
Select Coefficient from the displayed choices. Proceed by selecting the Install button. Approve the permission to install.
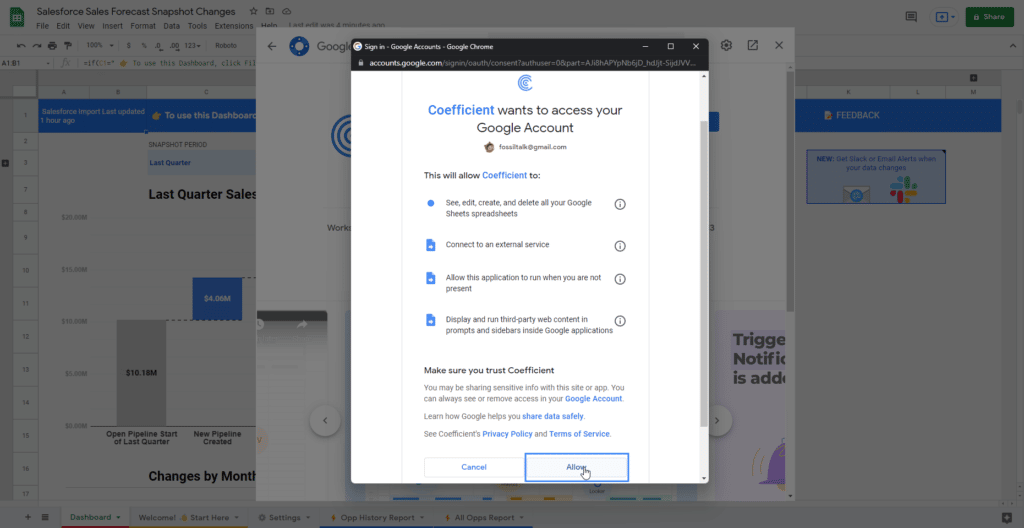
Next, you will be asked to select the Google account that you want to associate with Coefficient. After choosing your account, review the privacy information and click Allow.
Success! The screen will inform you that you have installed Coefficient.
Step 4: Connect Salesforce Data to Template
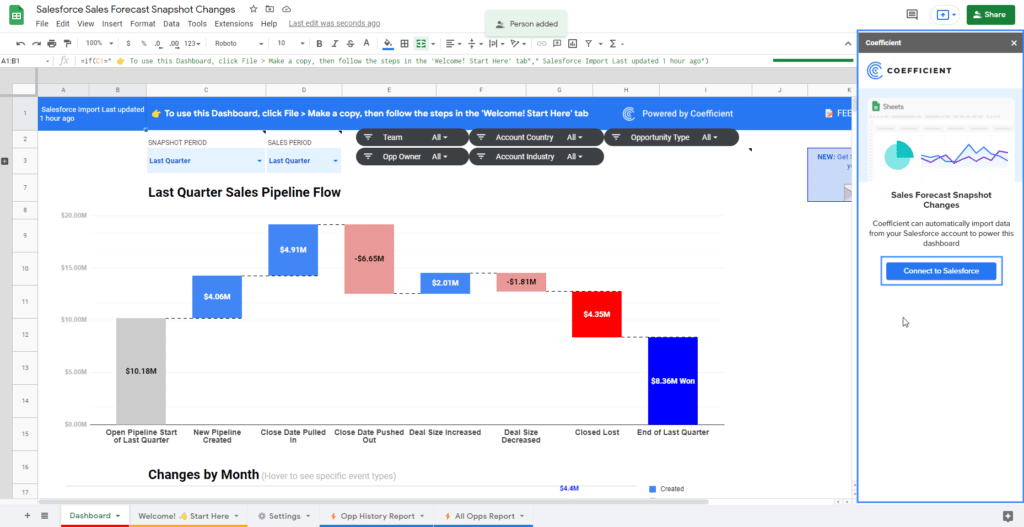
Now go to Extensions in the same top panel, scroll down to select Coefficient, then click Launch. You see a panel on your right-hand side with a Coefficient menu. Select Connect to Salesforce.
Authenticate through Salesforce. You will be taken to the log in screen for your org. Following that, approve the access request by clicking Allow. The connection is made directly between your Google Sheet and your Salesforce instance.
A success message will appear in the same panel. You’re connected! If you look again to the right, you will see that an opportunity report and opportunity history report will begin importing.
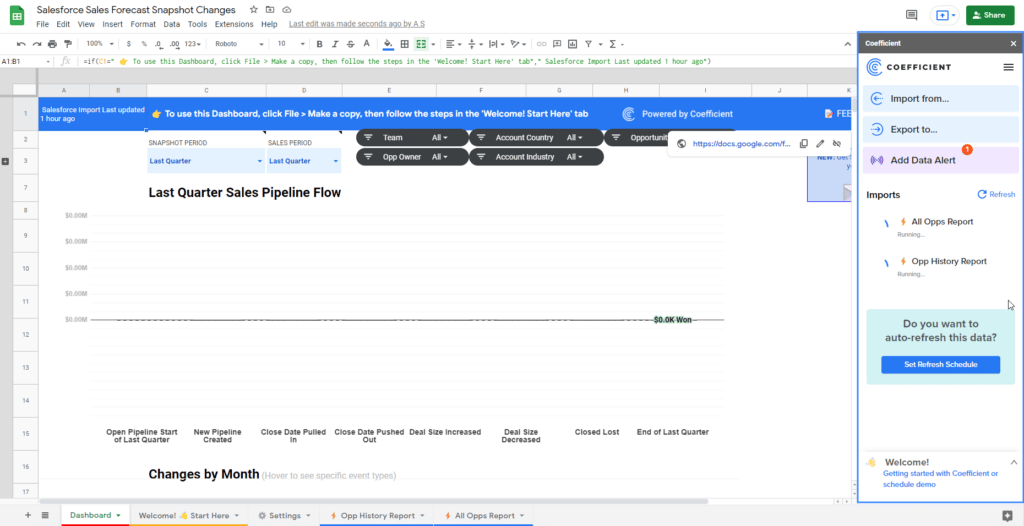
The dashboard will update with the new data.
Step 5: Set Up Automatic Data Refreshes
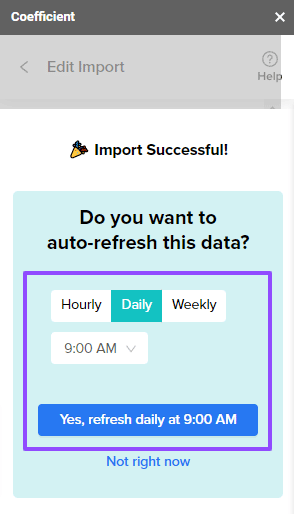
You should also schedule automatic data refreshes to ensure that the Salesforce data in your template always remains live.
Under the Import menu, click on Refresh Schedule.
You can schedule auto-refreshes data hourly, daily, or weekly. This enables your team to work with live and accurate data at all times. Your Opportunity History dashboards will always be up-to-date and ready-to-share.
Step 6: Schedule Data Alerts
Finally, schedule data alerts. Data alerts allow you and your team members to stay up to date on important changes in your spreadsheet directly from Slack and email. From the sidebar, click Add Data Alert.
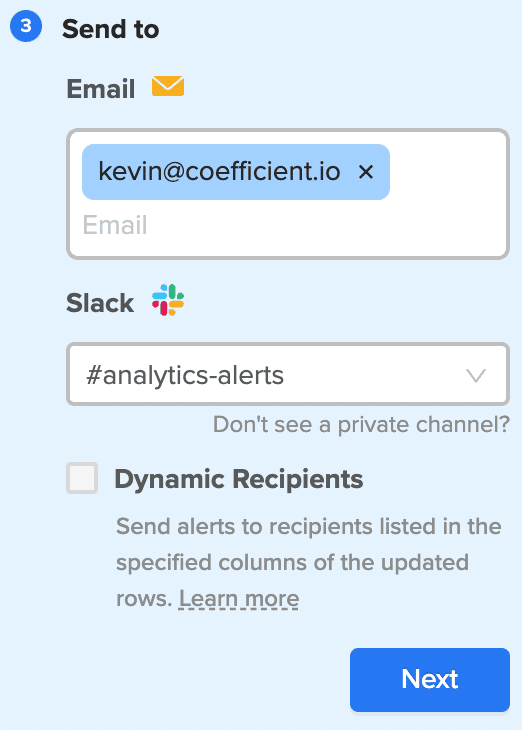
Choose the alert type: Weekly/Daily screenshot, When data changes, or When a new row is added. Select the frequency of the alert. Then enter the Slack or email address you want to send the alert to. Now your team can monitor Opportunity History dashboards directly from Slack and email!
Use Cases: Opportunity History Template
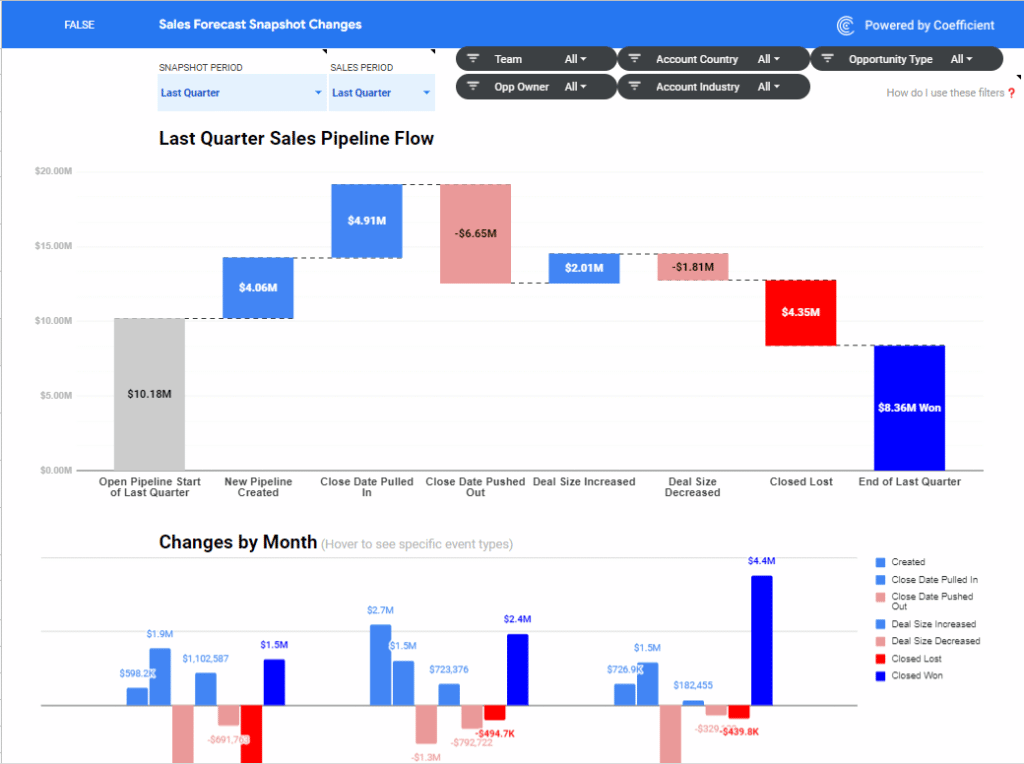
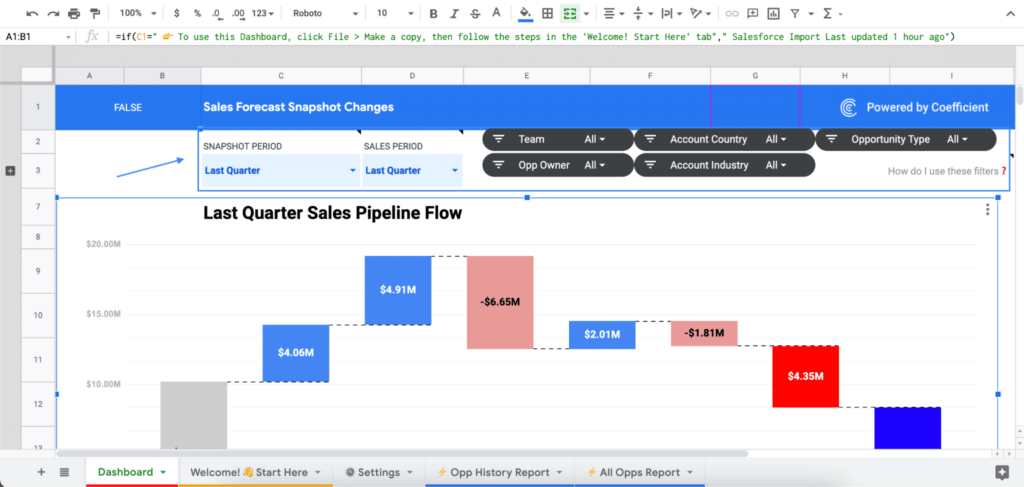
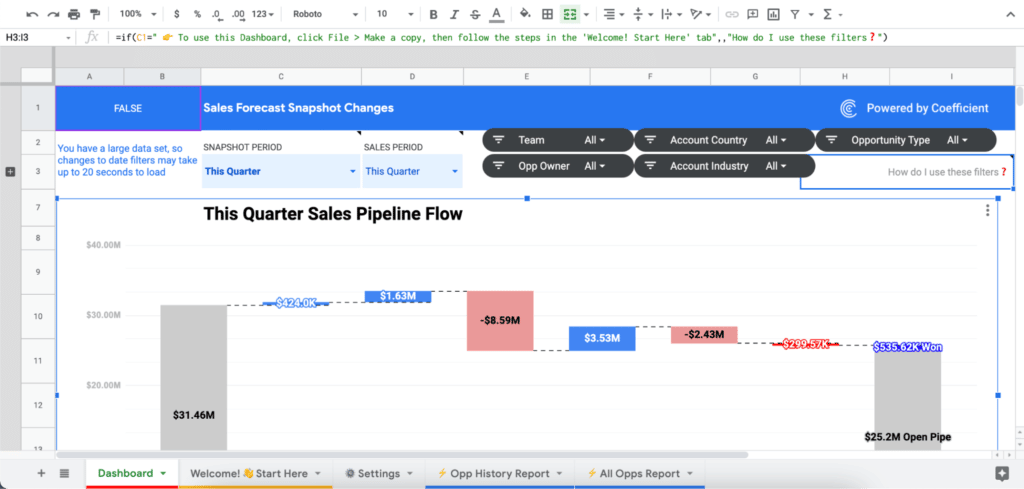
Sales Pipeline Flow
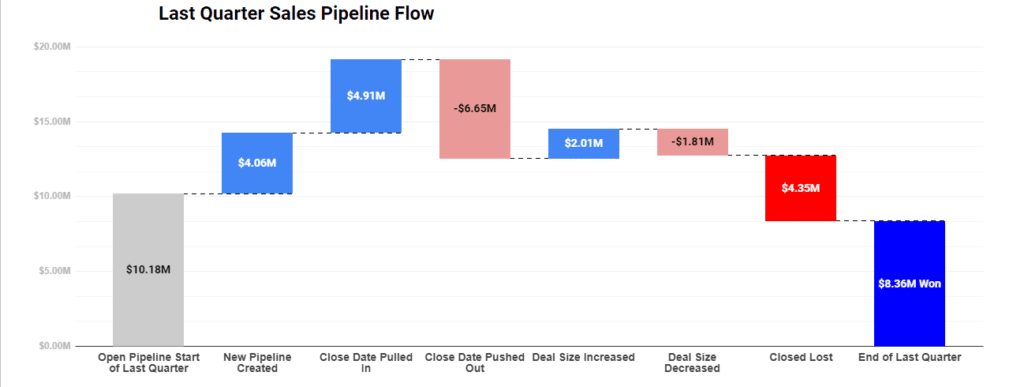
The Sales Pipeline Flow dashboard tells you how the size of your deals changes over time when significant events occur.
In the example above, we see the pipeline increased by $4.91m because of deal closures being moved into this quarter, but was also reduced by $6.65m because of close dates being pushed out.
Similarly, we see an increase in deal size creating an additional $2.01m in revenue, and a further reduction of $1.81m because of deal size reduction.
This dashboard gives us a great high-level overview of how all of our deals are doing and how they’ve been implemented by these significant events.
Changes by Month
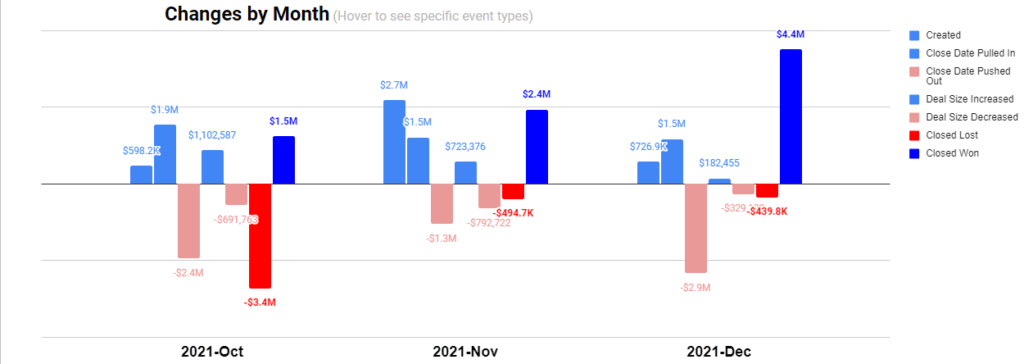
The Changes by Month dashboard gives us an even more detailed explanation about how our pipeline has changed. This dashboard doesn’t just track significant events in your sales pipeline. It also demonstrates how those events occurred over time.
The Changes by Month dashboard can help you directly attribute significant changes in deal size to major events in and out of the company. These could be changes to staffing, market changes like sourcing, supply chain constraints, or changes to product offerings, all entirely within Google Sheets.
Forecast Changes by Date
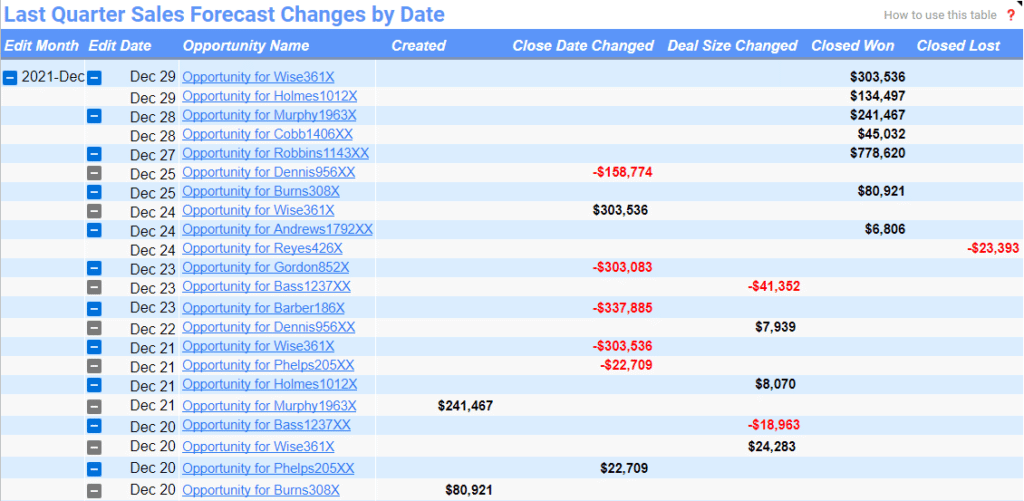
Forecast Changes by Date measures changes by day, so you can really drill into how the data changes over time. The list offers links to each individual Salesforce record, so you can examine in the most granular detail why a specific Opportunity value changed.
Cool Things You Can Do with Opportunity History Template
Updating Data Filters
In addition to displaying your quarterly data for your sales personnel, you can also filter that data down to see how a team’s deals have been impacted. You can also hide certain data that’s obstructing the overall perspective.
For instance, maybe the product line has been eliminated and those related deals were closed. You probably don’t want to include that data, and the template gives you the ability to filter it out in real-time.
Let’s see an example:
At the top of your template, you will see a panel with all the options available.
Look at how the data automatically changes when we modify the snapshot period and sales period to this quarter.
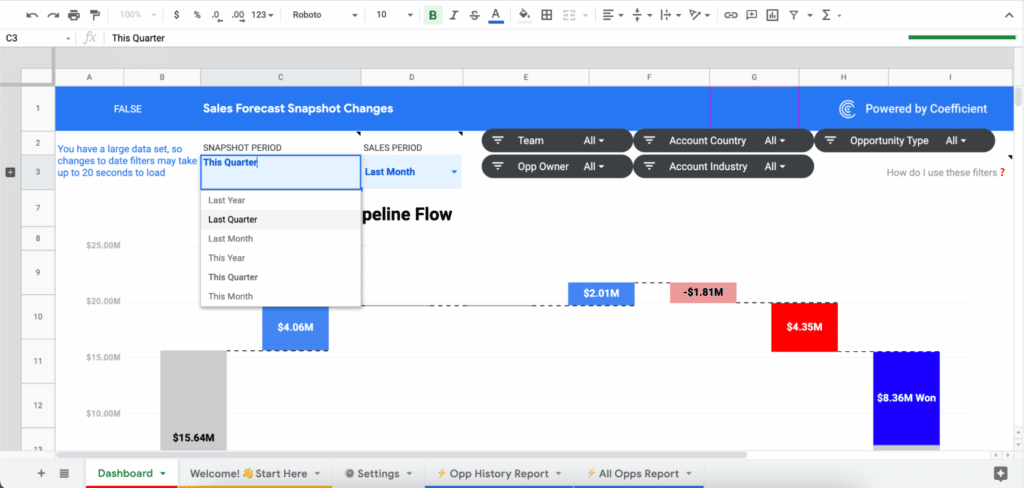
Our pipeline flow updates in real-time, and now reflects the desired data sets:
Next, let’s take a look at the filtering options to the right. These may look quite familiar to you, as you may have seen them in Salesforce reports tools.
As you can see, there are many filtering and data sorting options pre-designed for you, and you can use them immediately.
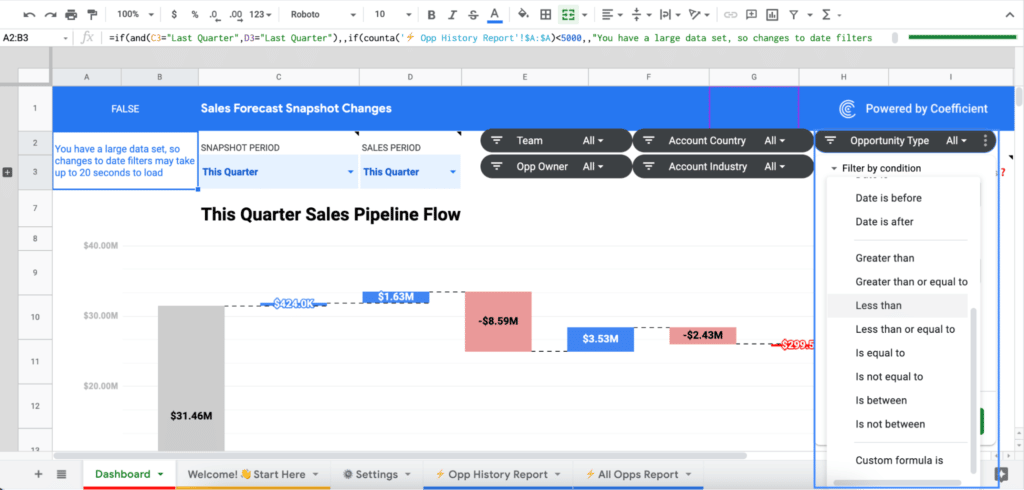
Create New Data Filters
If there’s a filter you need in the template, but you can’t find, you can add new data filters from custom fields on your reports by replacing the ‘placeholder’ filters “Opportunity Type,” “Account Country,” and “Account Industry.”
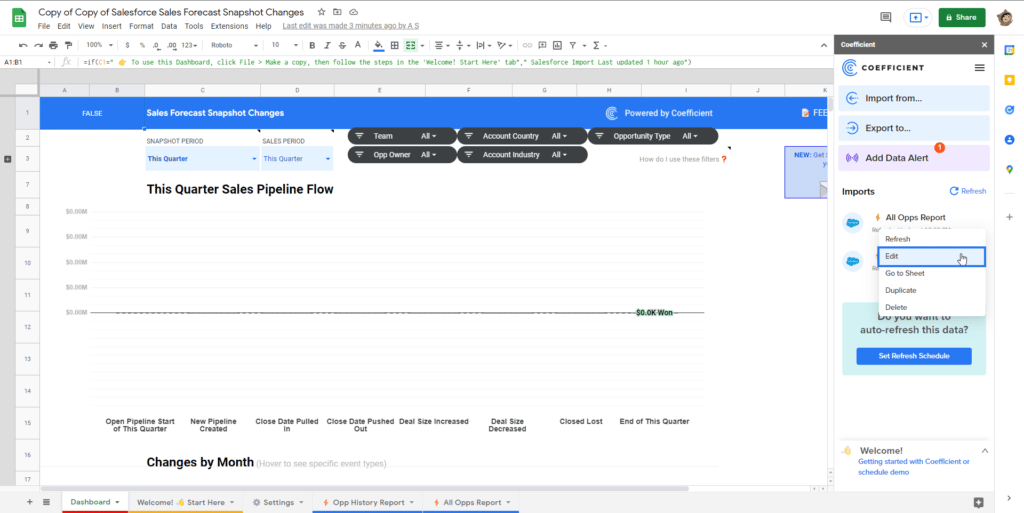
Launch the Coefficient Sidebar and click the three dots next to the “All Opps Report” import, and click Edit.
Remove one of the placeholder fields you don’t need by unchecking the box next to it (Opportunity Type, Account Country, or Account Industry).
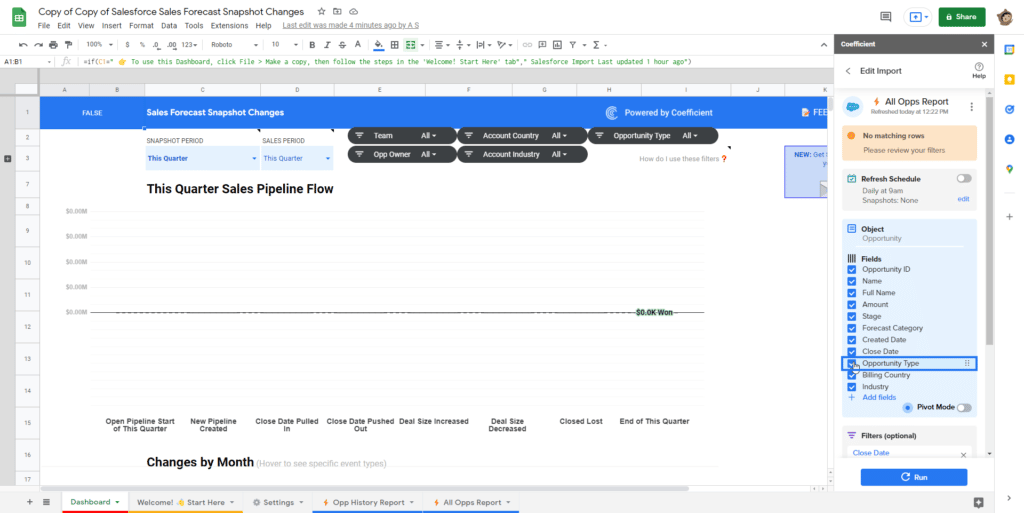
Click Add fields, select the field you would like to use as a filter, and then click Done Selecting Fields.
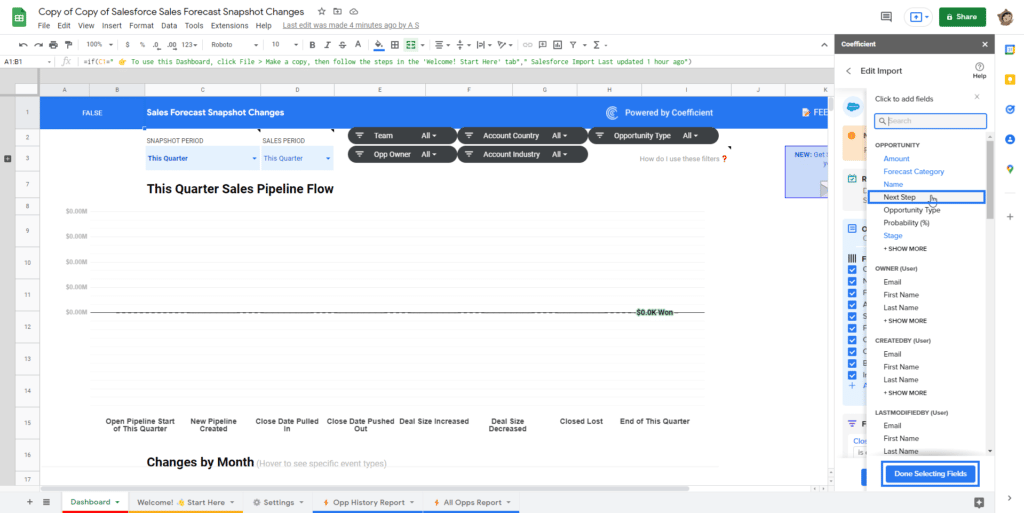
Click Save and Run.
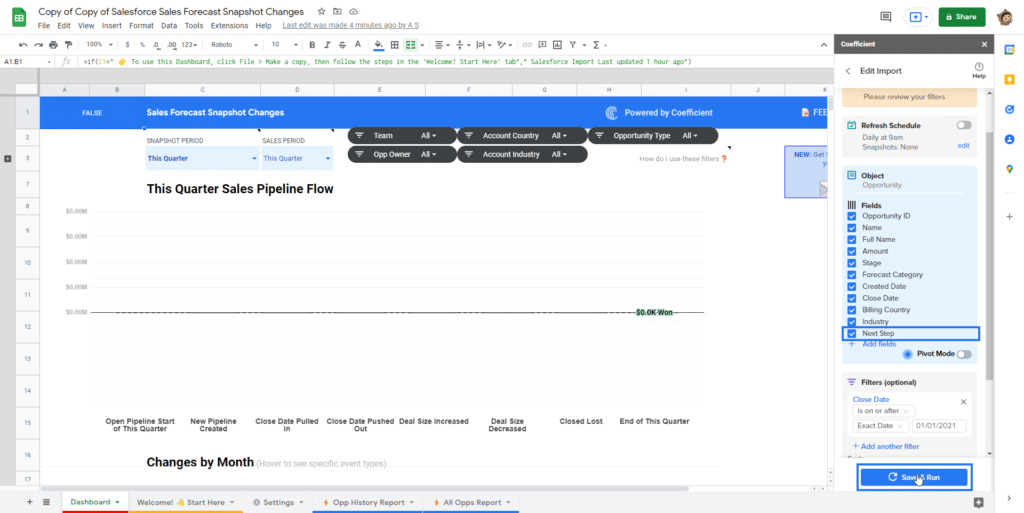
The data will refresh and your new filter will appear at the top!
Build New Dashboards Analytics on Top of the Template
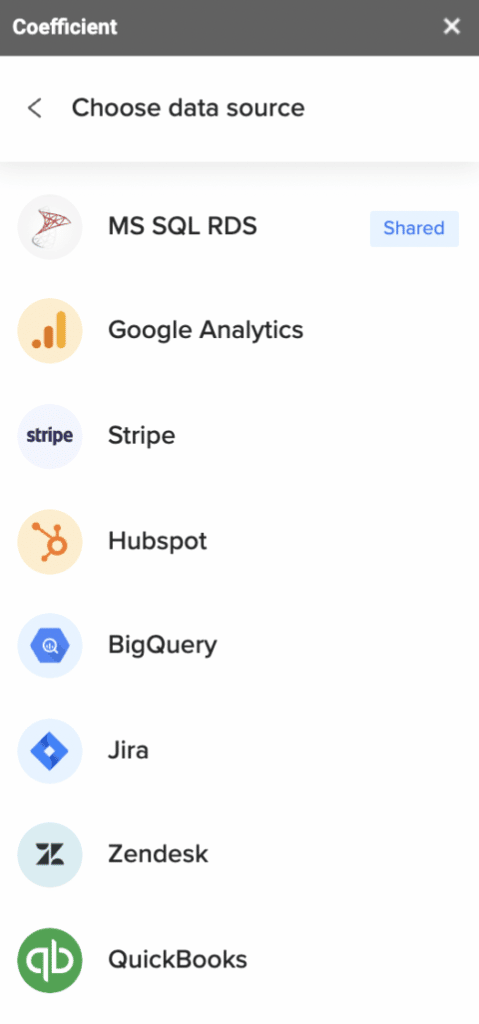
A huge boon of using Coefficient to import your data and create visualizations into Google Sheets is that now you’re in control of your data! If you want to add additional visuals to your report, you can. You can update Coefficient’s import to include additional fields, import data from other platforms like Google Analytics or Looker, and combine it with the data we’ve imported.
Try Coefficient’s Opportunity History Template Now!
Salesforce reporting is often clunky, difficult to work with, and simply insufficient. But with Coefficient’s Opportunity History Template, you can bypass all the busy-work and get straight to the insights you need.
So what are you waiting for?
Try our free Opportunity History Template right now! And please let us know if you have any requests for future templates.
