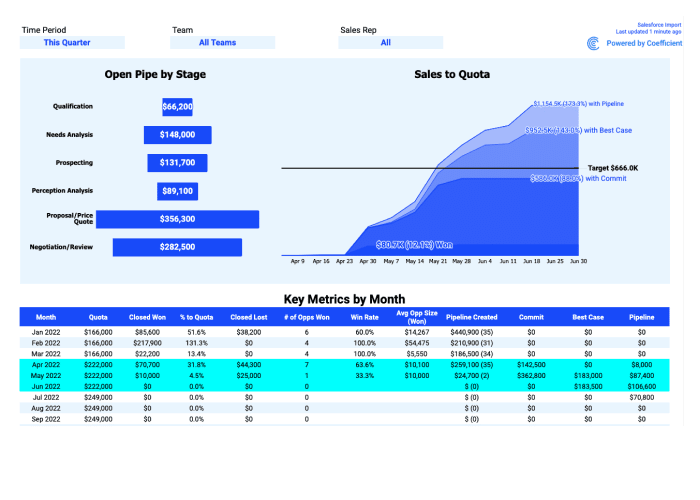
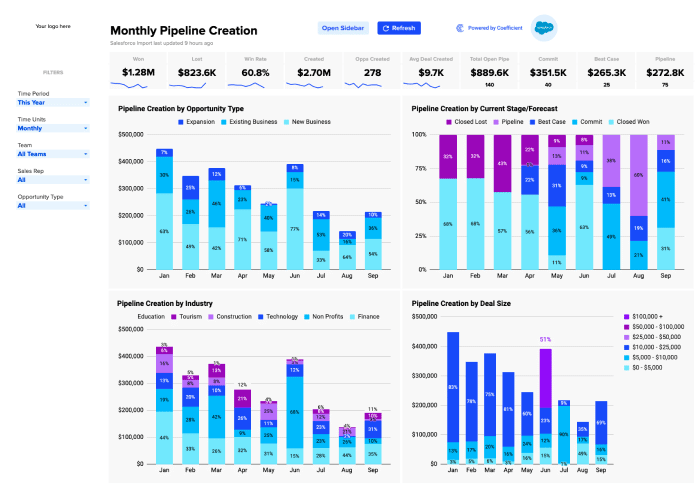
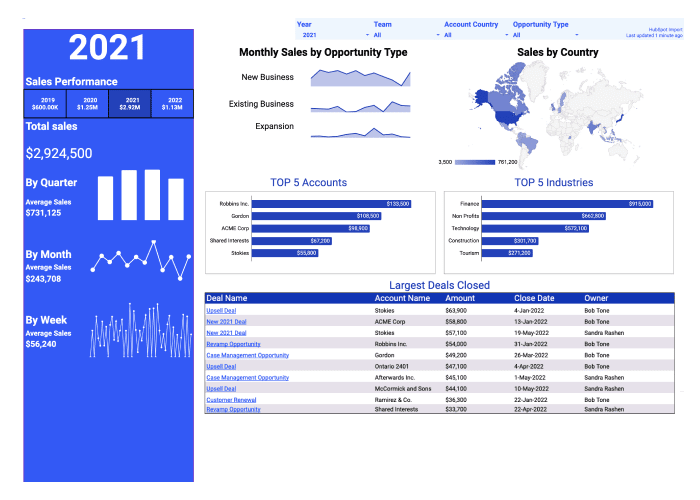
Free, pre-built Salesforce Opportunity History Changes Dashboard
This sheet pulls in data directly from your Salesforce Org to help you keep track of changes to your sales pipeline throughout the quarter. Sales managers and analysts frequently face challenges making sense of Salesforce’s historical datasets to gain meaningful insights. Create a live connection to your own Salesforce data in seconds and gain an instant understanding into how your sales forecast has fluctuated over the past day, week, month or quarter. Quickly identify where Close Dates have been pushed out of the quarter or where Opportunity Amounts have been increased or decreased.
This Opportunity Snapshot History Dashboard will help you:
- Automatically populate this dashboard with live data from your Salesforce Org
- Identify any significant changes to close dates, opportunity amounts and other fields that affect your sales forceast
- Slice and dice opportunity changes by sales team, opportunity type or account details to see the data that’s most relevant to you
- Setup weekly Slack or Email alerts and Coefficient will keep you updated on every edit you need to know about


