- Excel
- Sales
- Salesforce
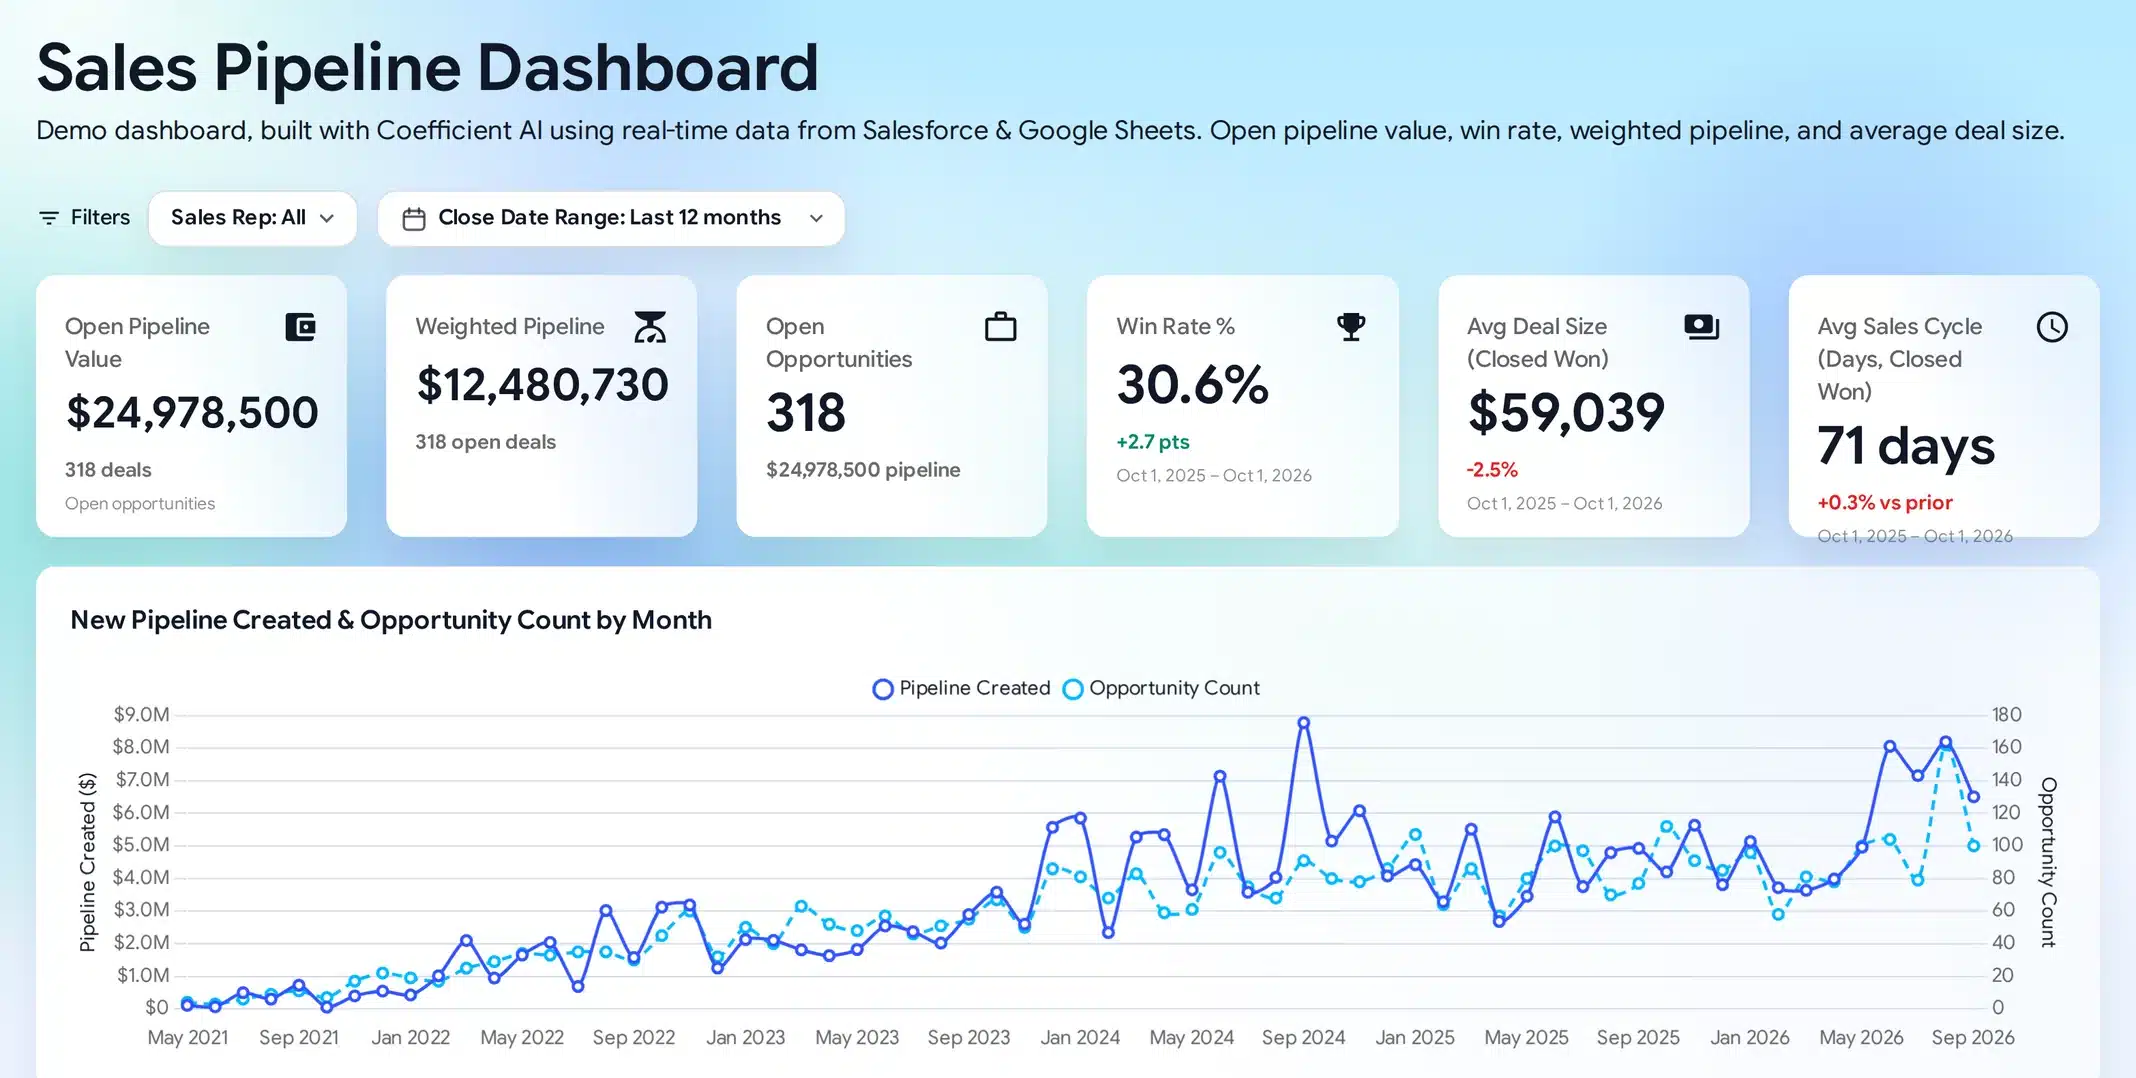
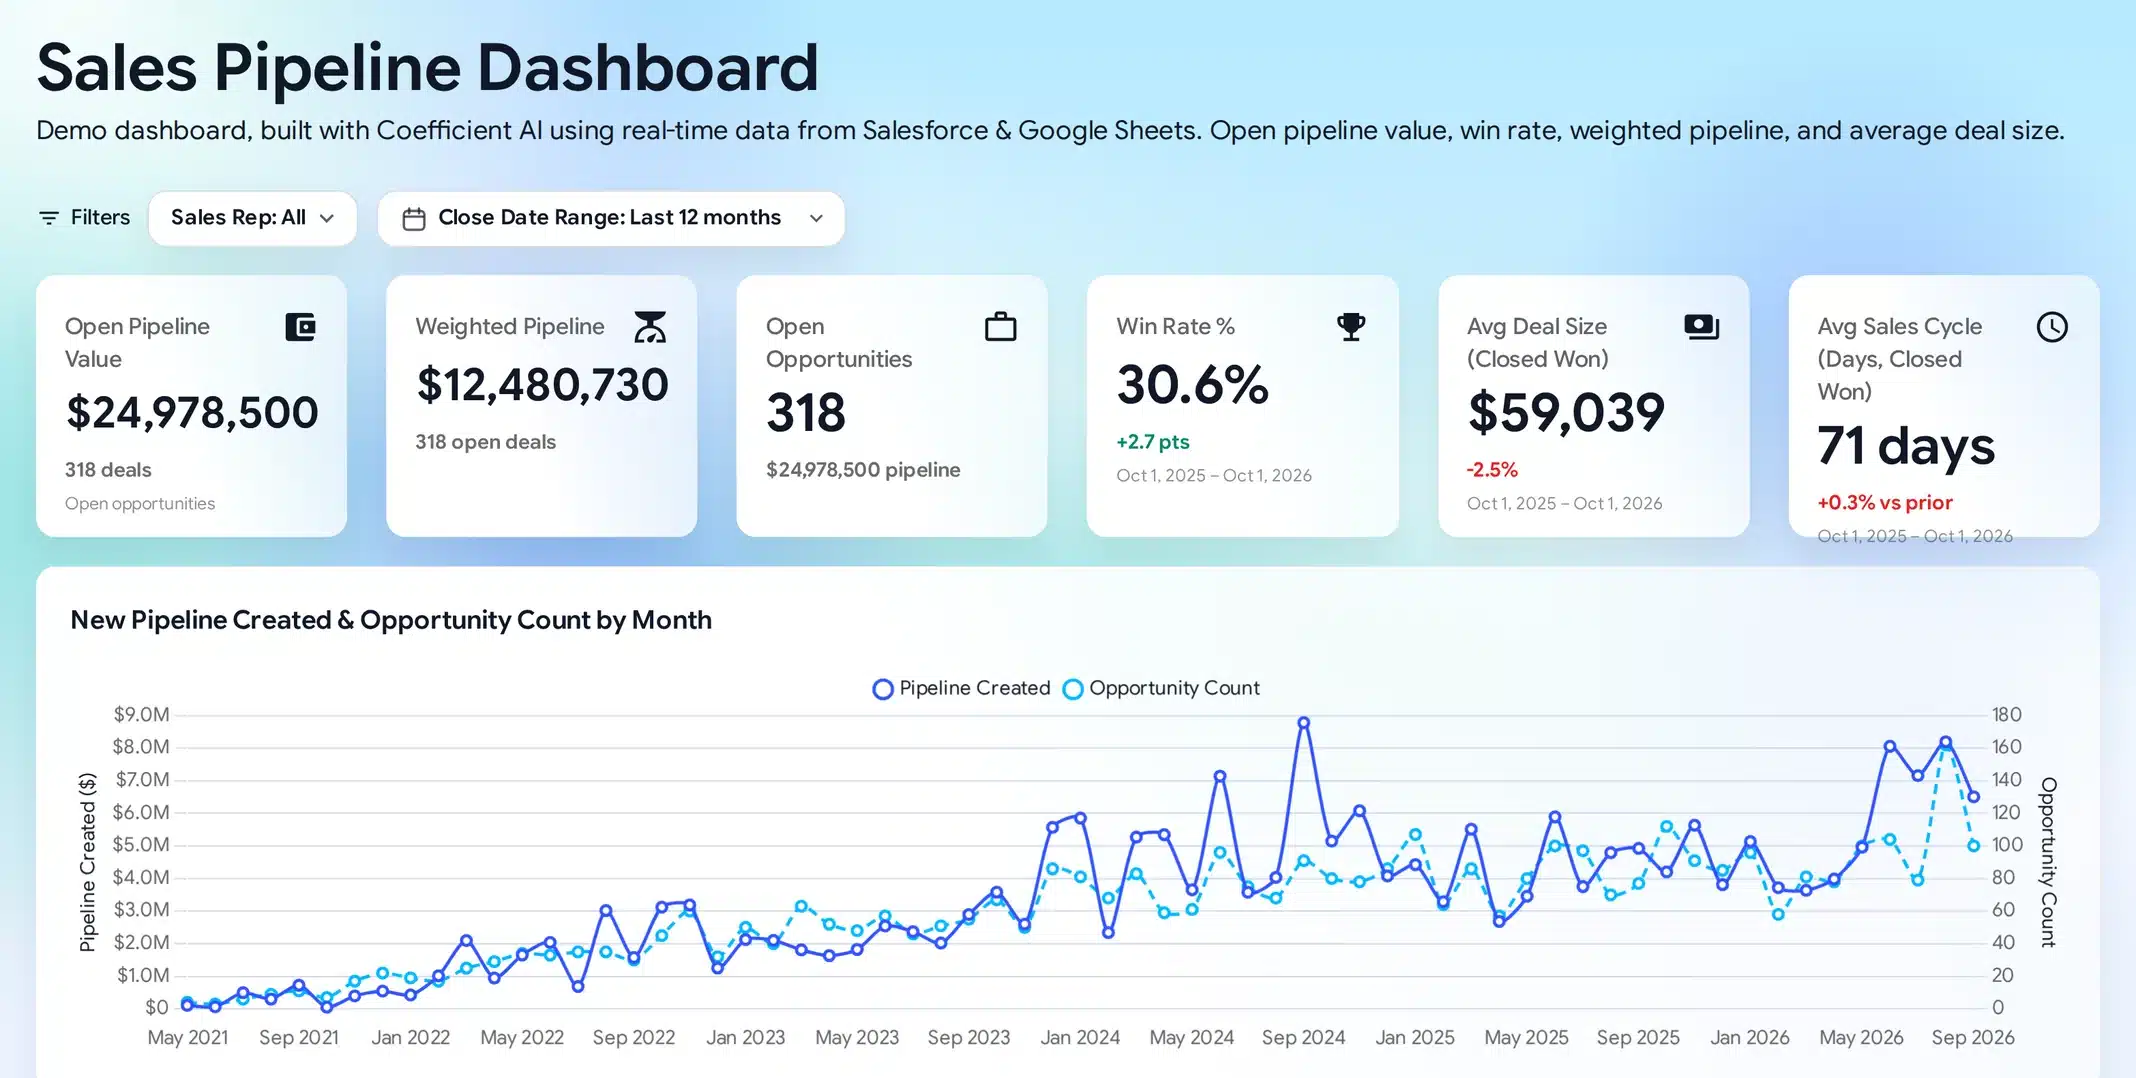
Sales Pipeline Dashboard Example. Build Yours in Minutes
Describe what you want in plain English. Coefficient turns CRM & Sales data in your spreadsheet into a live, BI-quality pipeline dashboard at a shareable URL. Ask Coefficient AI for insights and set AI alerts to Slack, Teams or email.
Free Salesforce pipeline template for Google Sheets
Not ready to build with AI?
Start from the pre-built Google Sheets template.
Connect Salesforce with Coefficient and pull your CRM data directly into the template directly for plug and play use.
How to build Sales Pipeline Dashboard with Coefficient AI
No BI tool, no SQL and no data team. If you can describe the report, you can build it.
Connect
Describe
Share
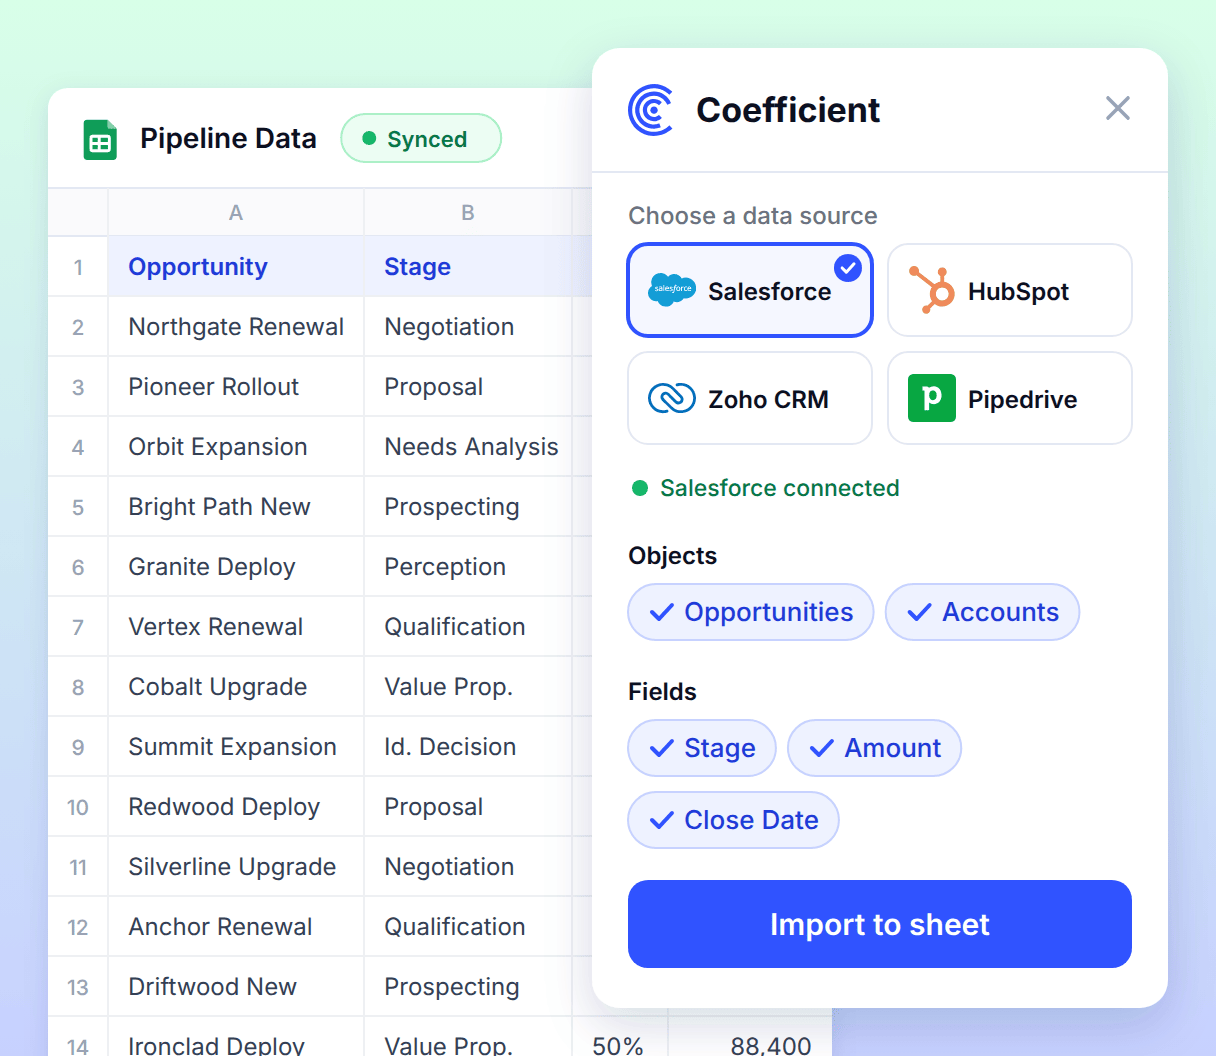
Connect your CRM using Coefficient - SFDC, HubSpot, Zoho & more
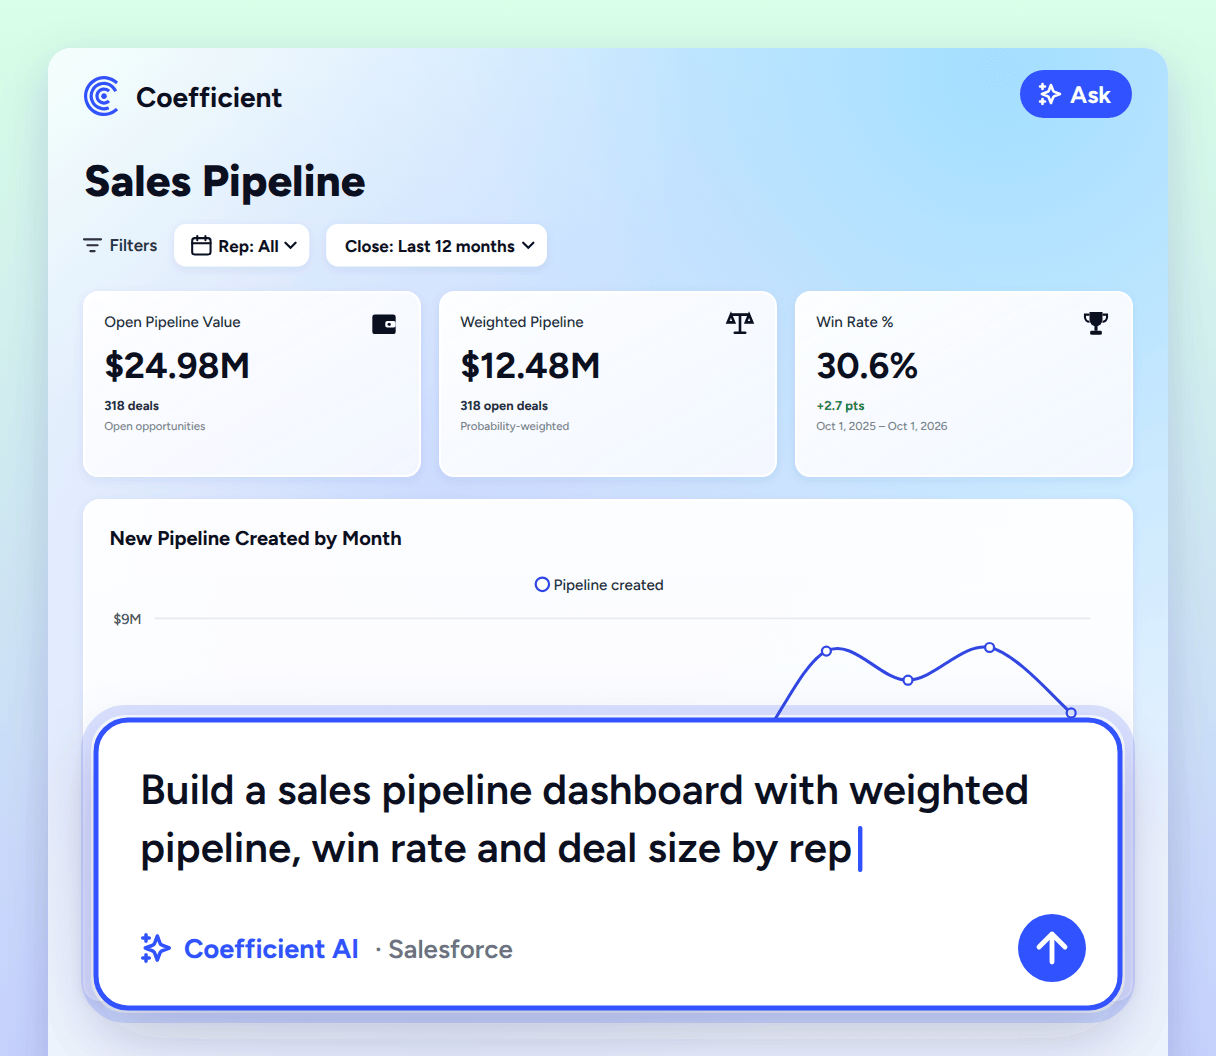
Describe the pipeline dashboard you want
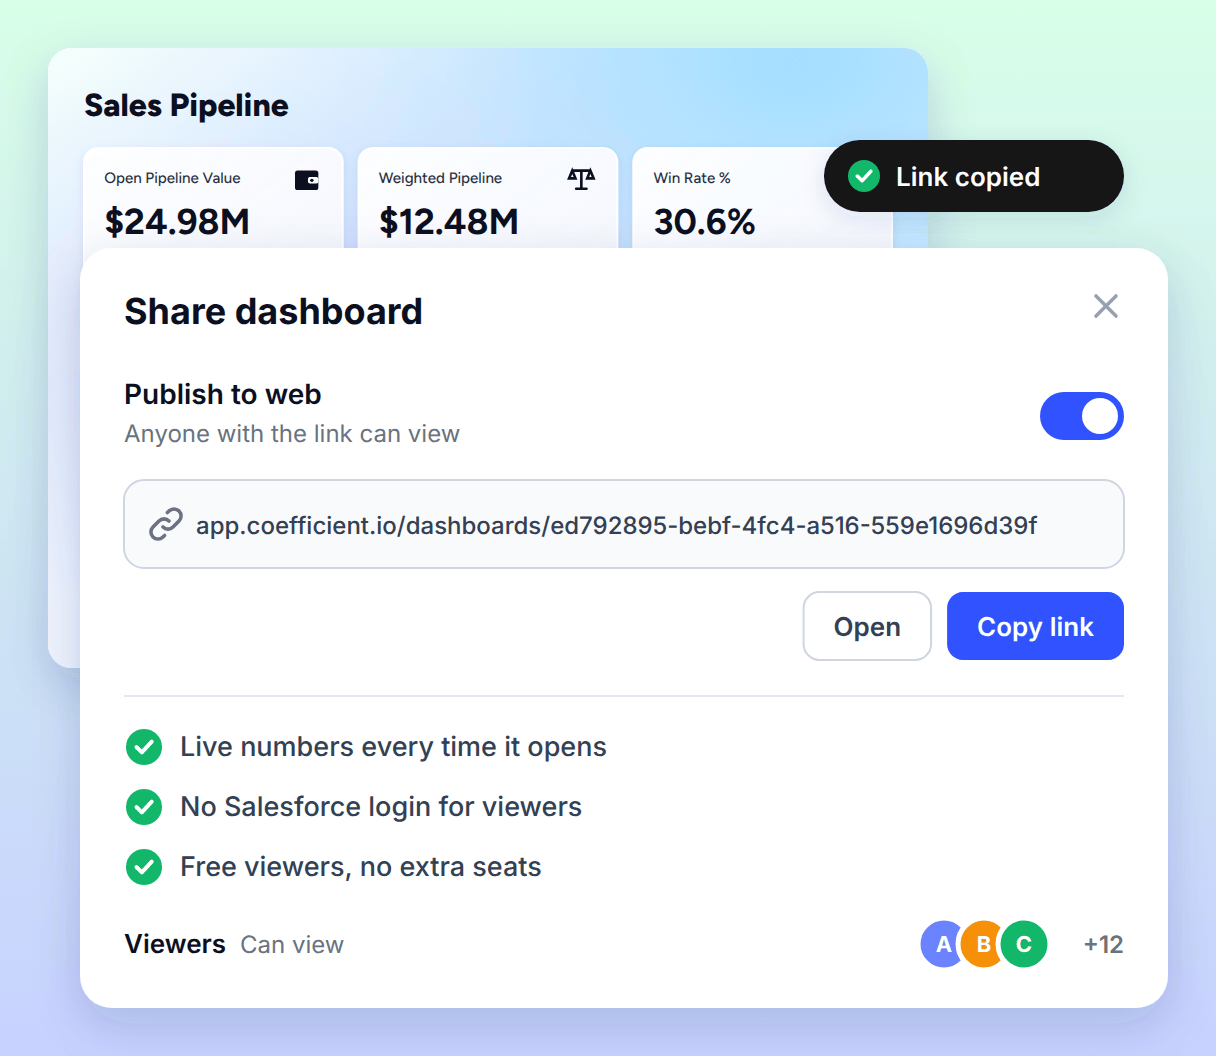
Share the live dashboard with anyone. Free View Access.
Connect
Connect your CRM using Coefficient - SFDC, HubSpot, Zoho & more
Describe
Describe the pipeline dashboard you want
Share
Share the live dashboard with anyone. Free View Access.

We are moving so much faster and with fewer dependencies. Coefficient makes building efficiently possible in ways I couldn't have predicted.

CRM data sources and connectors
Build this dashboard from Salesforce, HubSpot, Zoho CRM, Pipedrive, Bigin and more. Add call, billing or marketing data to the same sheet to see the full revenue picture.

- Source system
- Salesforce, HubSpot, Zoho CRM, Pipedrive, Bigin and more
- Objects pulled
- Opportunities or deals, accounts, owners, stages, forecast categories
- Refresh
- Hourly, daily or weekly
- Two-way sync
- Yes for Salesforce and HubSpot. Push updates from the spreadsheet back to the CRM
- Spreadsheet
- Google Sheets, Excel
Who uses a sales pipeline dashboard

Account Executive
"Which of my deals have sat in the same stage for over a month?"

RevOps Manager
"Which open deals have close dates already in the past?"

Sales Director
"Do we have enough pipeline to cover next quarter's quota?"

CRO
"Is this quarter's commit backed by late-stage deals?"

To have a dashboard that’s bookmarked on everyone’s Chrome, that they just click and go see, that’s huge. And they know it’s right.

What makes this sales pipeline dashboard different
Free viewer sharing
Drill down to the source record
Slack, Teams and email alerts
Row-level security
Metrics in this sales pipeline dashboard
Six metrics, each pulled live from your CRM, with the fields behind every number.
Open Pipeline Value
CRM · opportunity amount, stageTotal amount of every opportunity not yet closed.
Weighted Pipeline
CRM · amount, probabilityEach open deal's amount multiplied by its stage probability, summed.
Open Opportunities
CRM · opportunity stageCount of open deals in the selected close-date range.
Win Rate
CRM · closed won, closed lostClosed won deals as a share of all closed deals in the period.
Average Deal Size
CRM · amount, closed wonAverage amount of closed won deals.
Average Sales Cycle
CRM · created date, close dateAverage days from opportunity creation to close, for won deals.
Why not just build this in your CRM?
The two things people try first, and where each one stops.
| Coefficient | CRM reports | LLMClaude, ChatGPT | |
|---|---|---|---|
| What you get | Live dashboard at a URL | Report inside the CRM | A one-off chart or summary |
| Stays current | Scheduled refresh | Live in the CRM | Re-prompt each time |
| Multi-source | CRM, billing and calls in one view | One system | Whatever you paste in |
| Traceability | Drill down to the opportunity | Within the CRM only | No link back to source rows |
| Sharing | Link, no CRM seat needed | Needs a CRM license | Not built for team sharing |
| Per-viewer access | Row-level security | CRM roles and sharing rules | None |
Sales pipeline dashboard FAQs

Customize this sales pipeline dashboard with Coefficient
Change the metrics, add a second data source or rebrand it. Describe what you want in plain English and Coefficient rebuilds it on your live data.