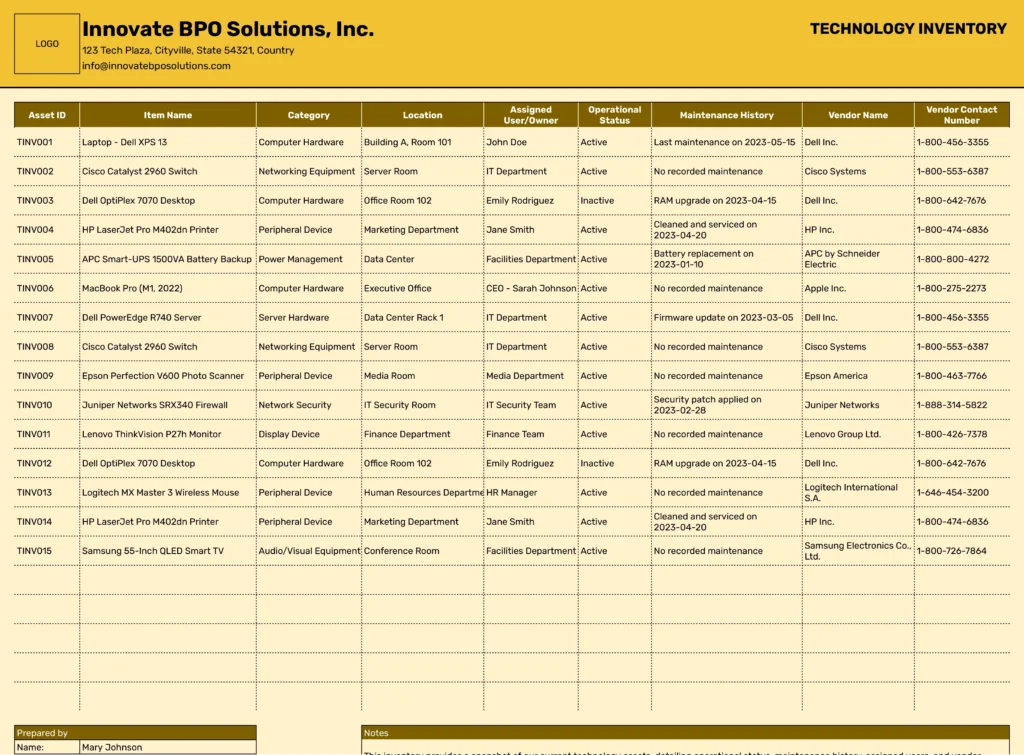
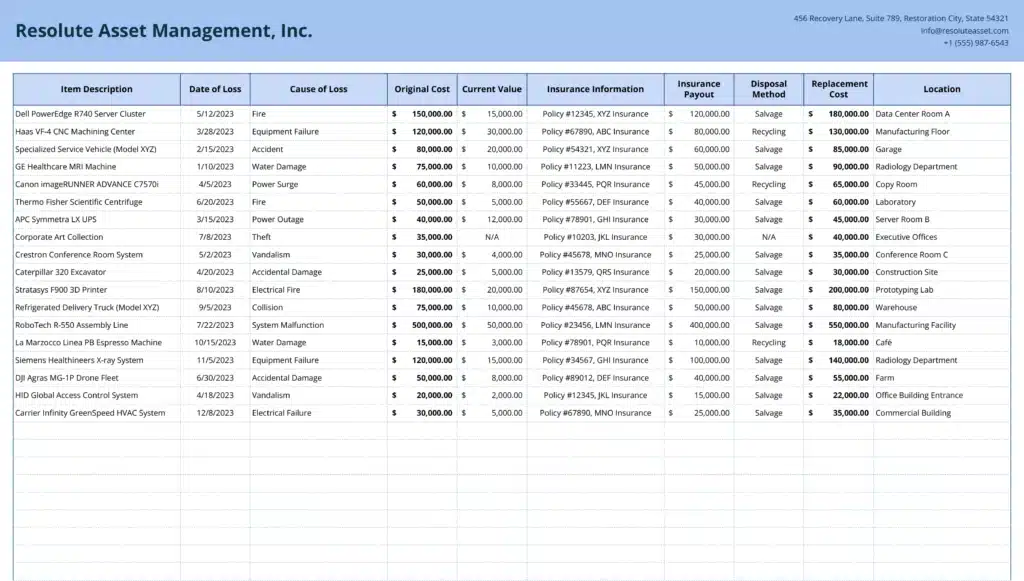
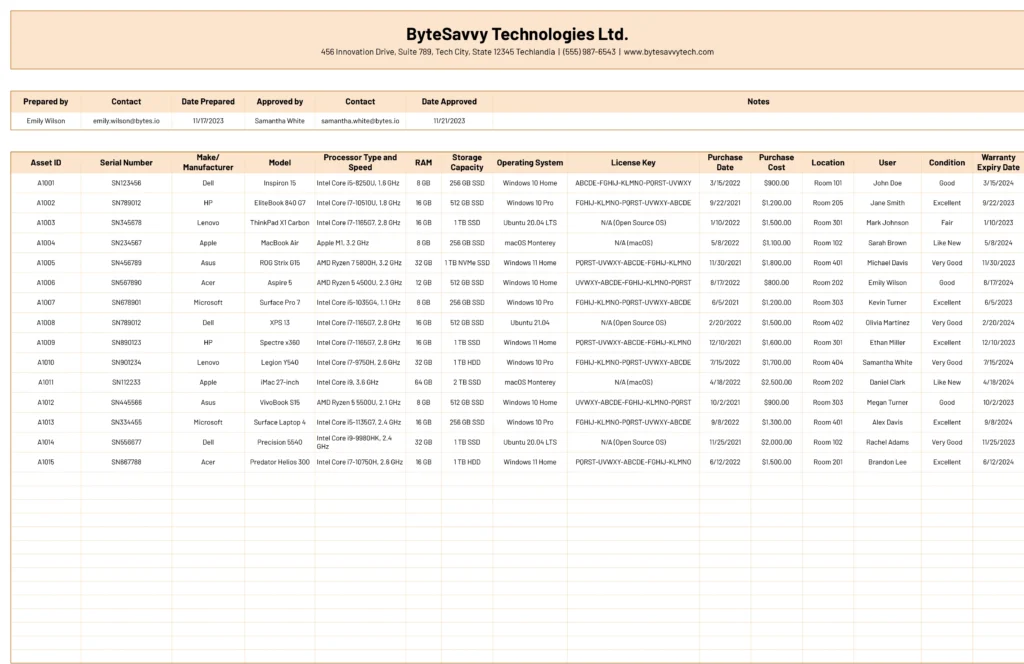
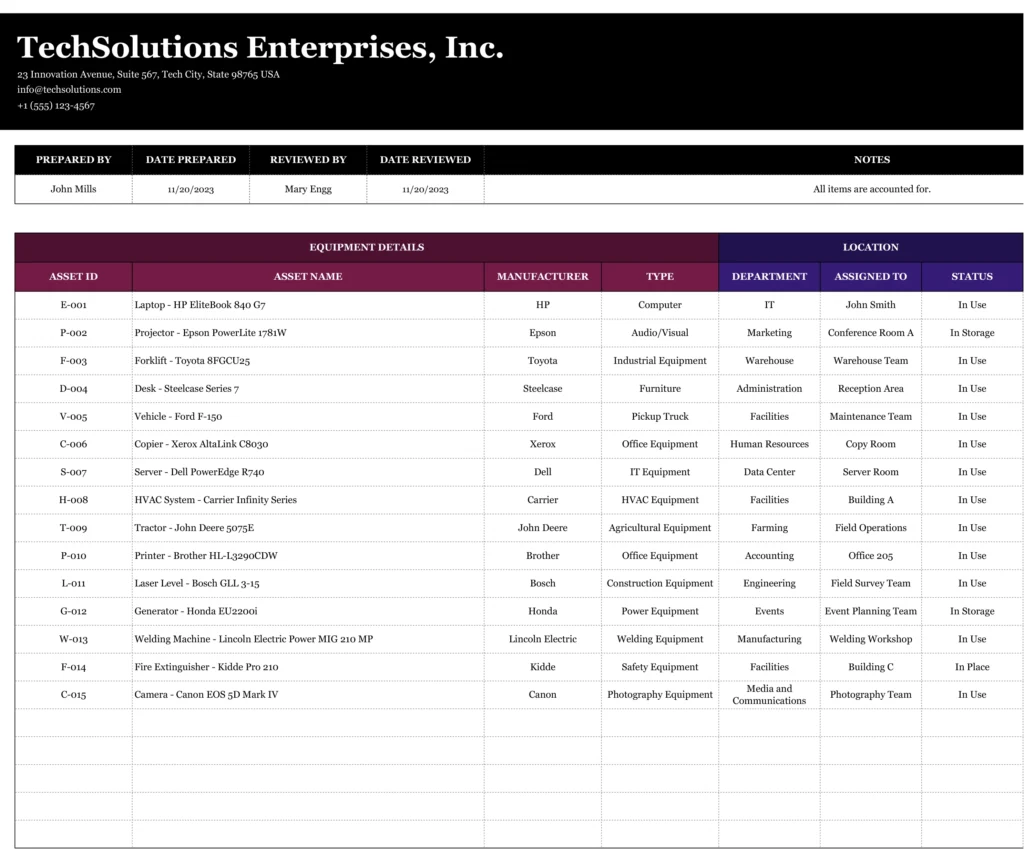
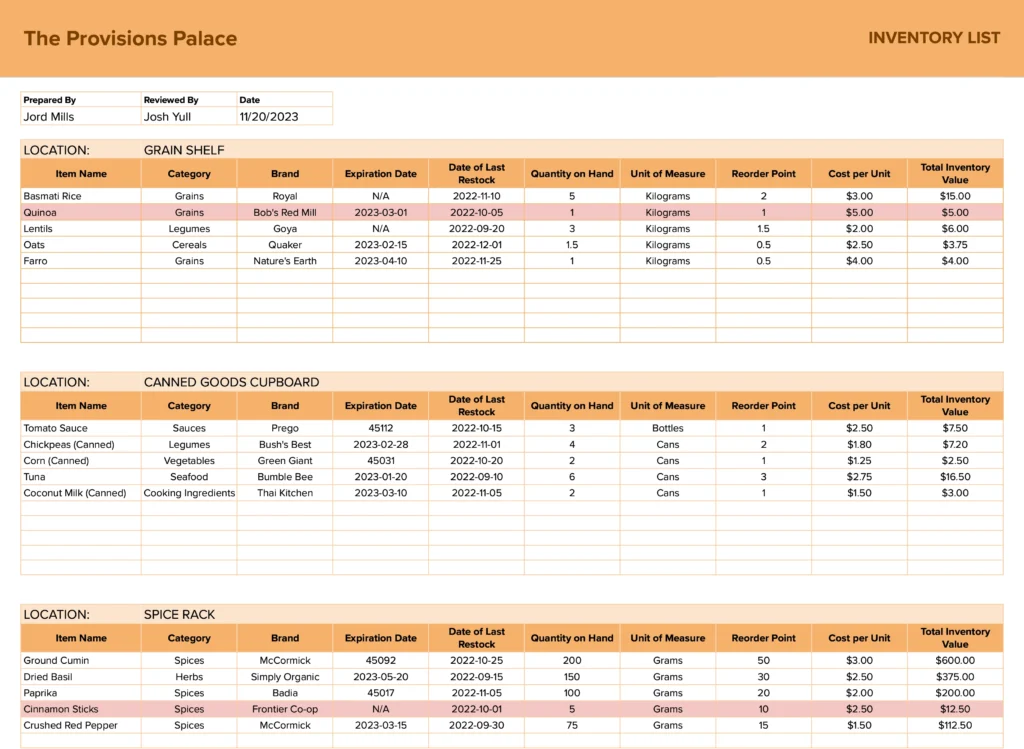
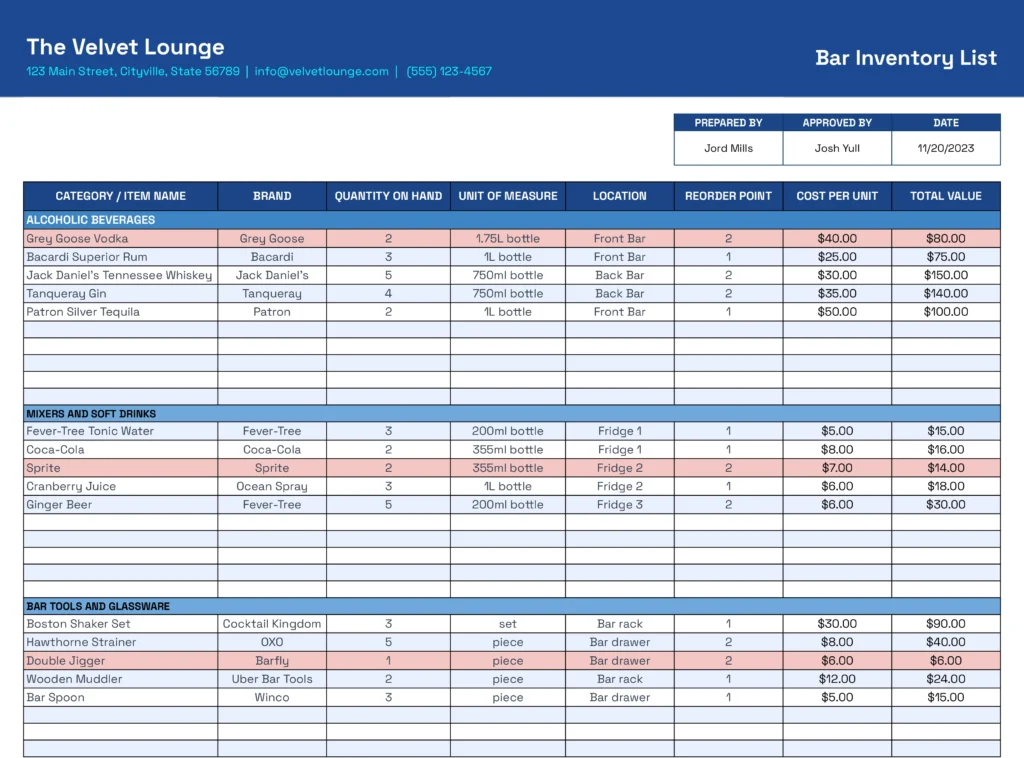
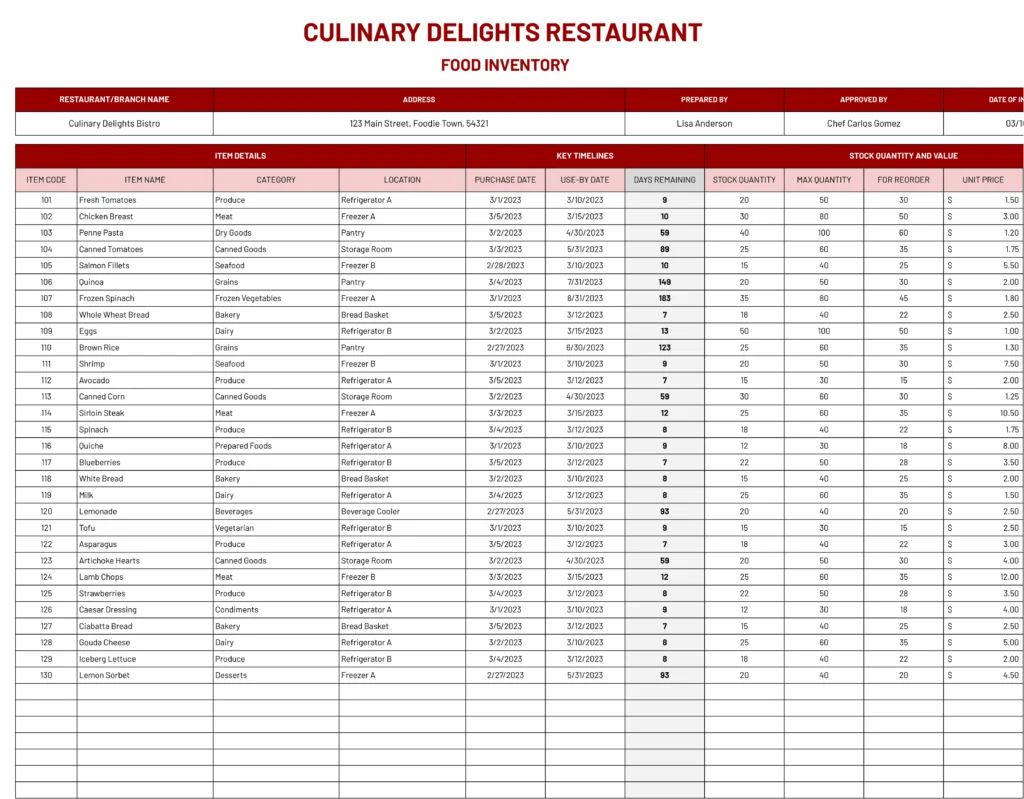
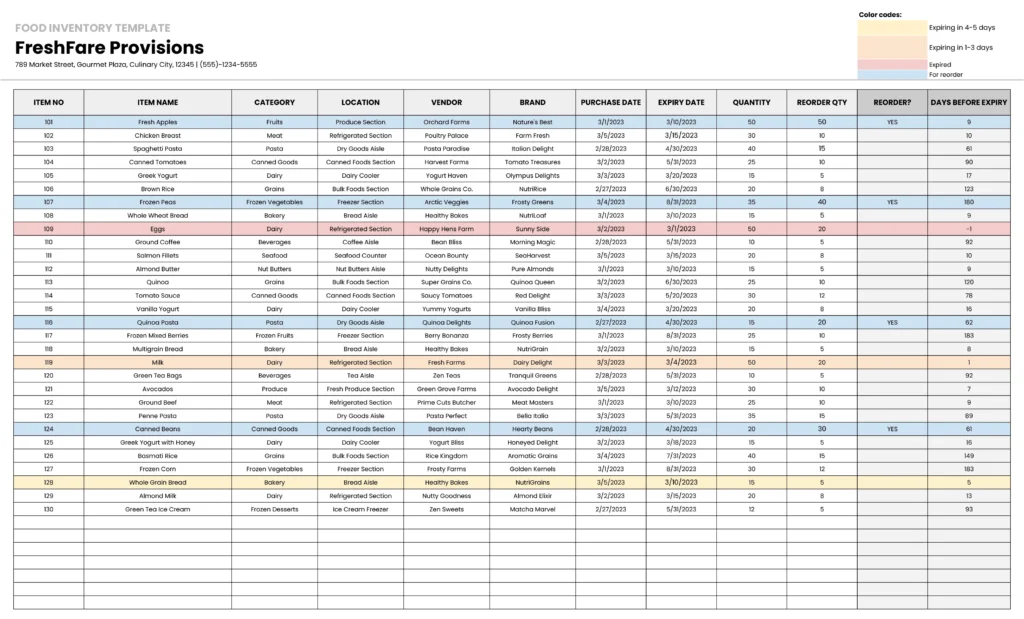
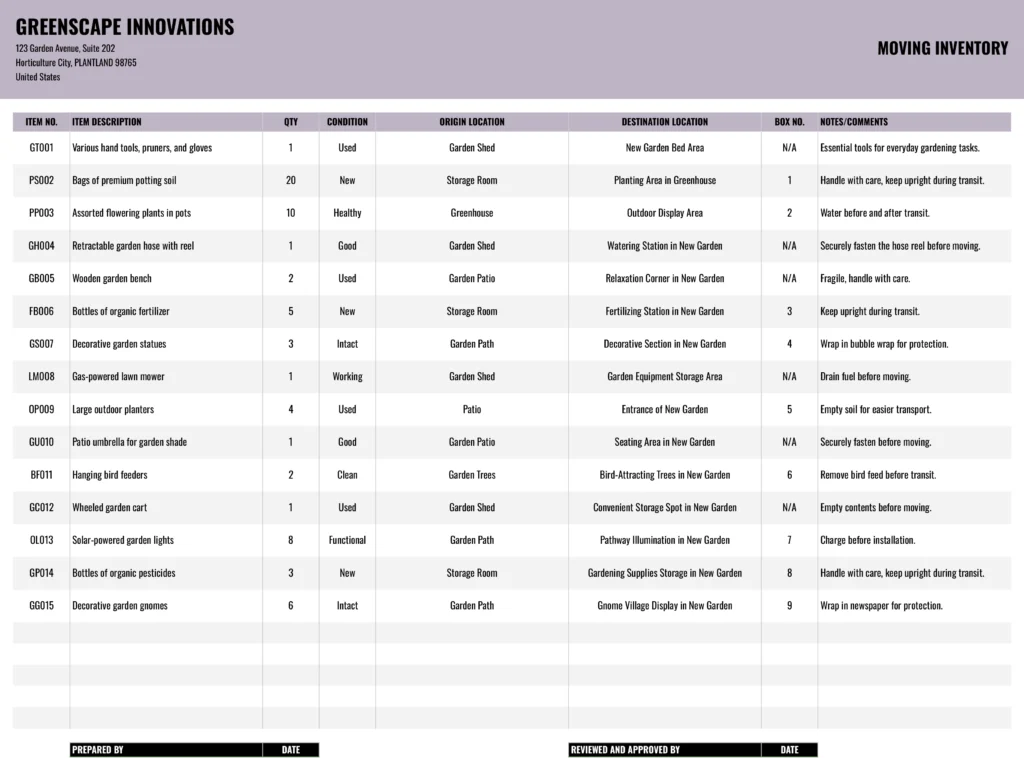
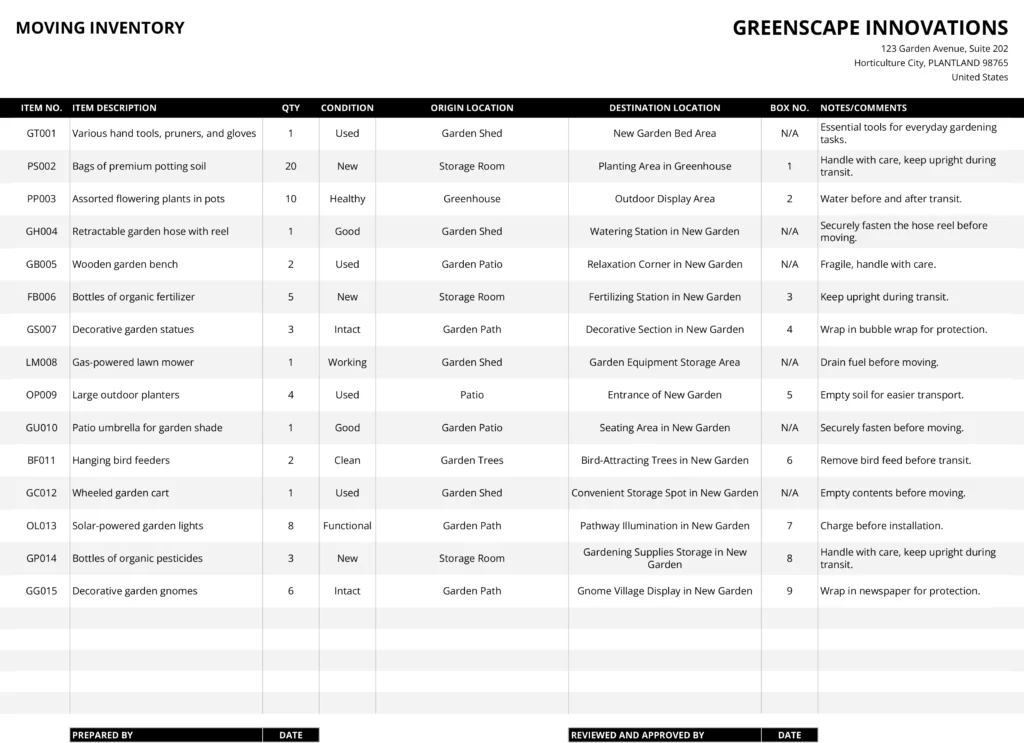
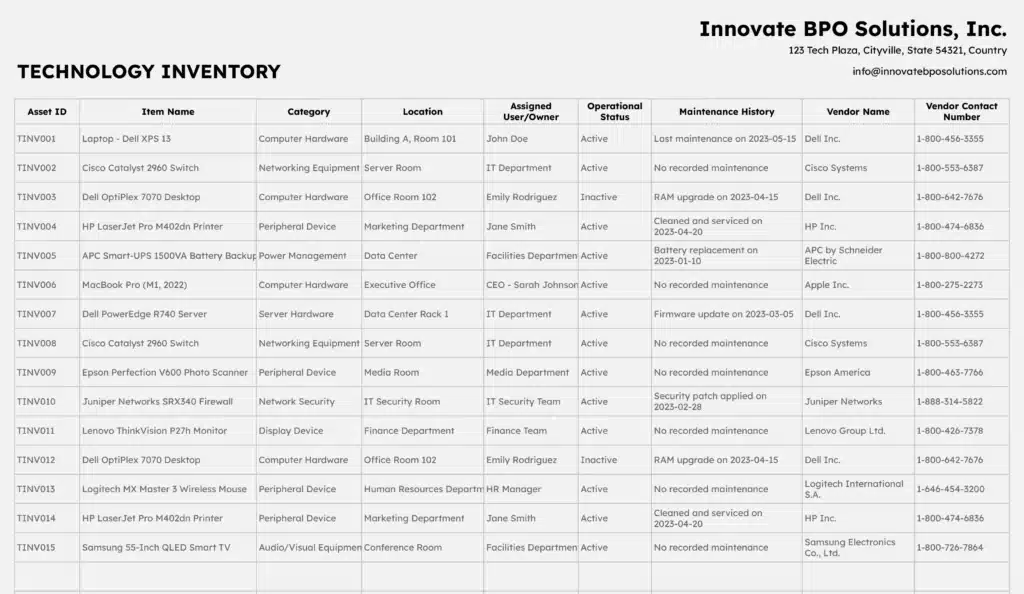
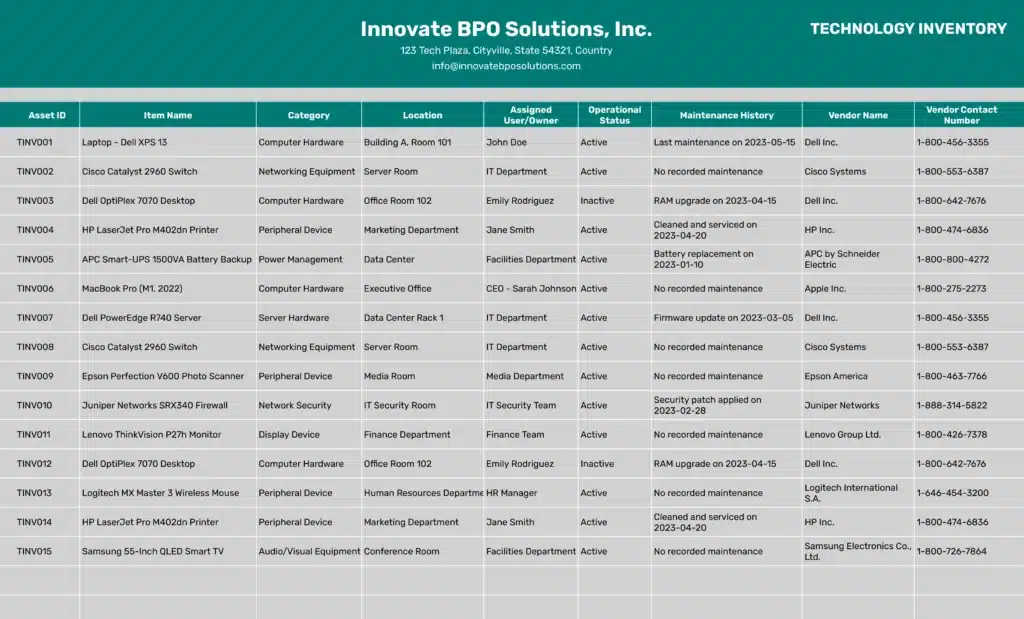
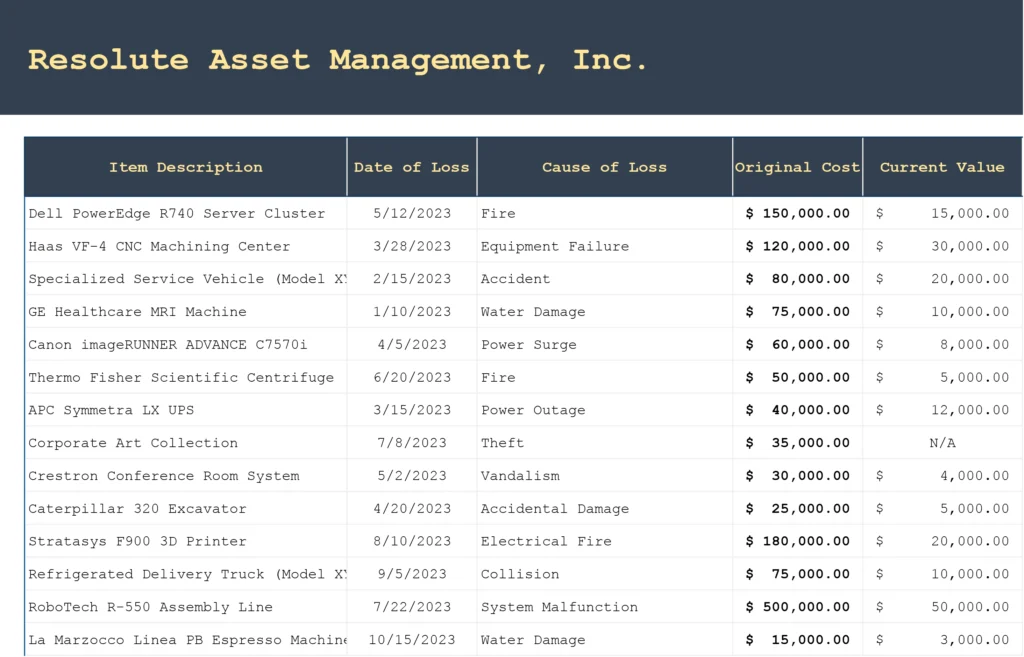
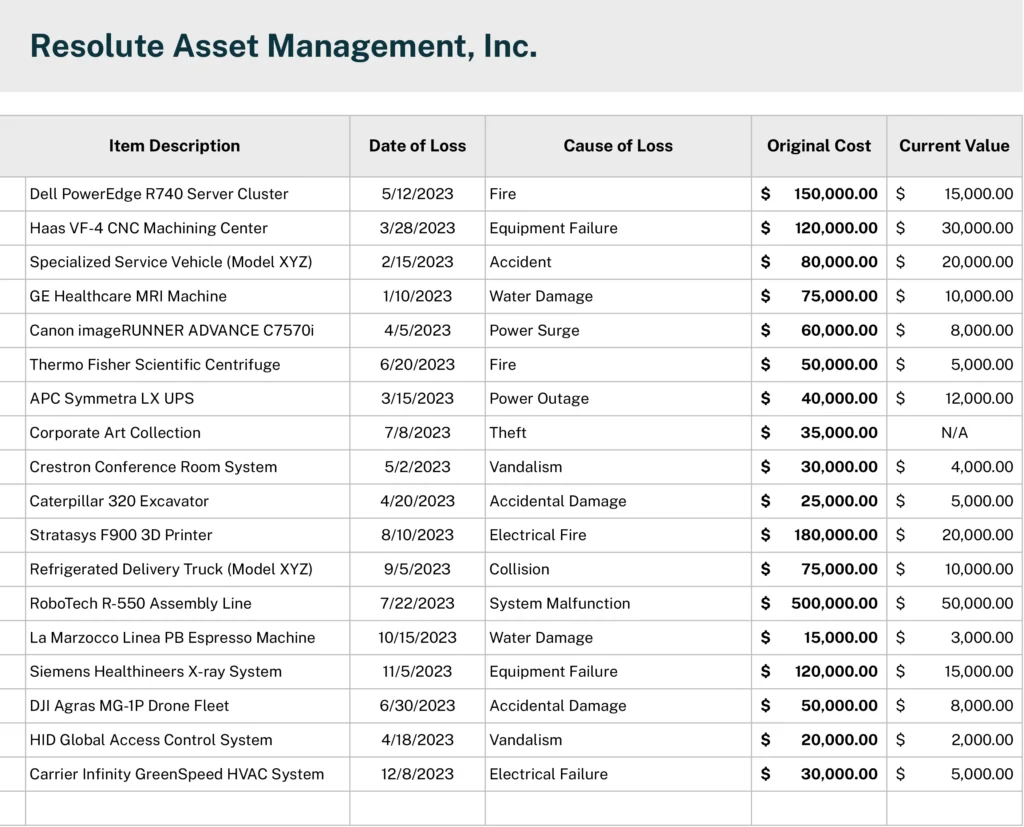
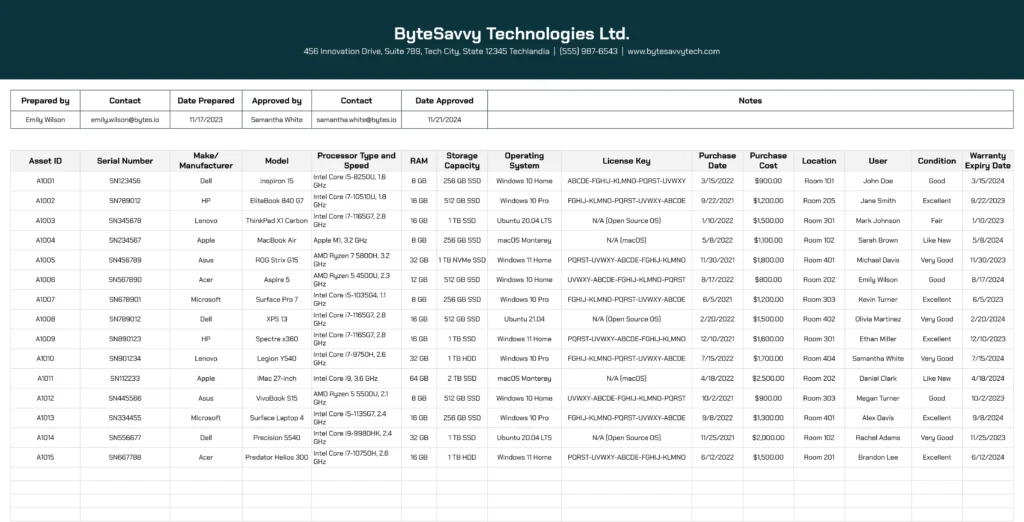
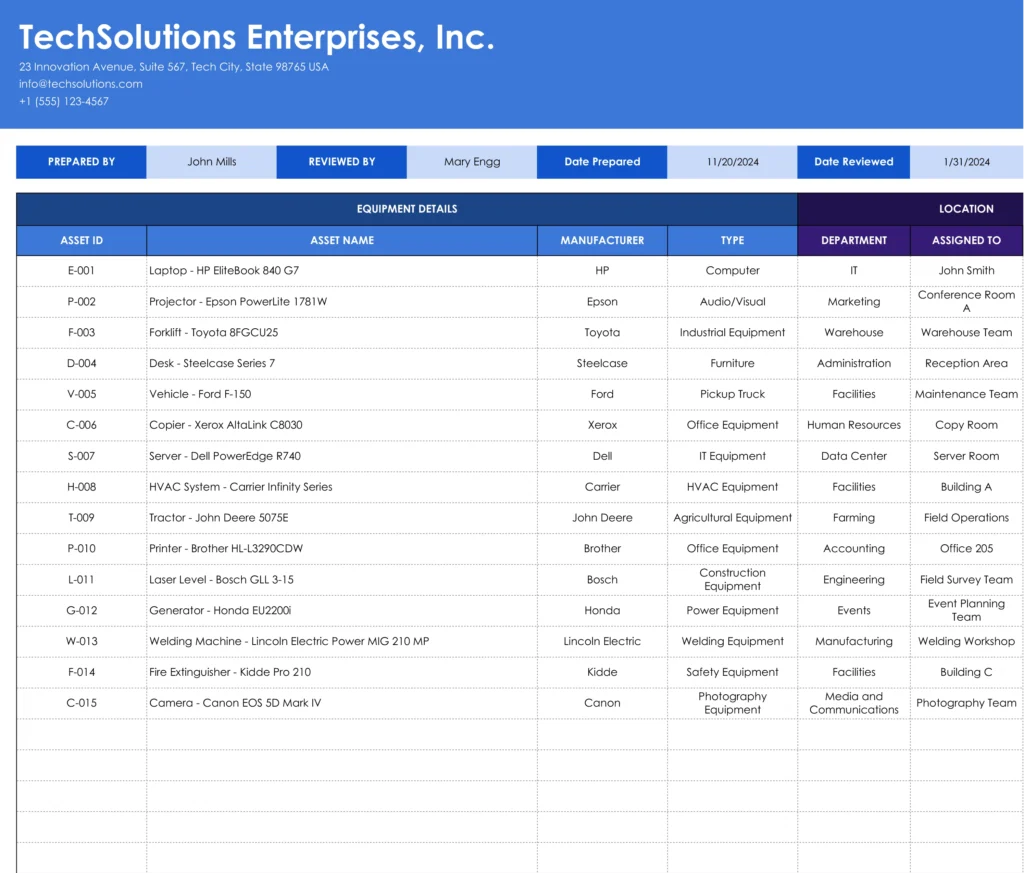
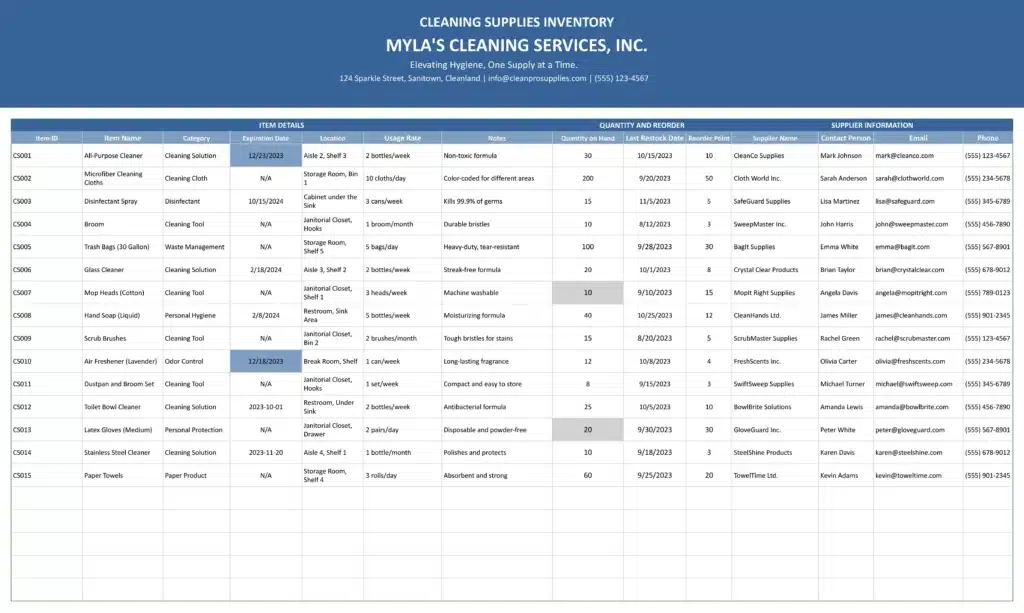
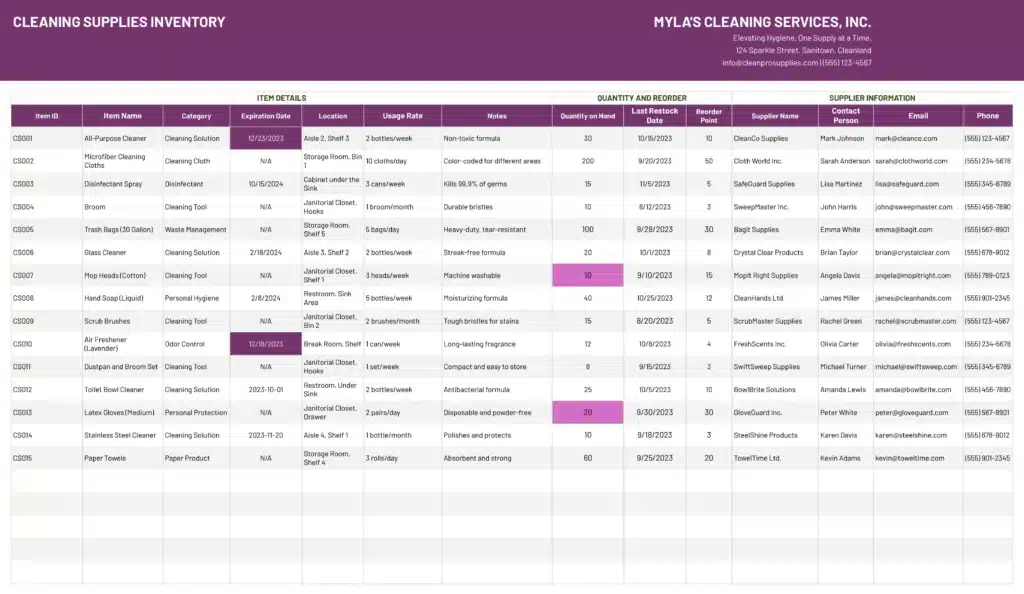
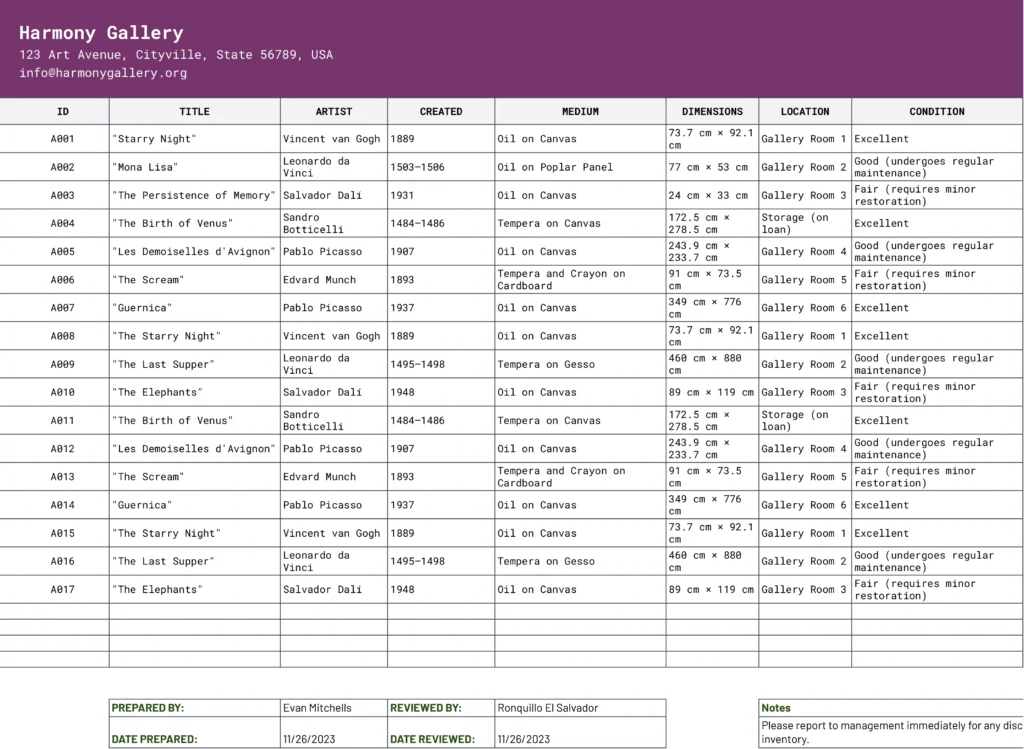
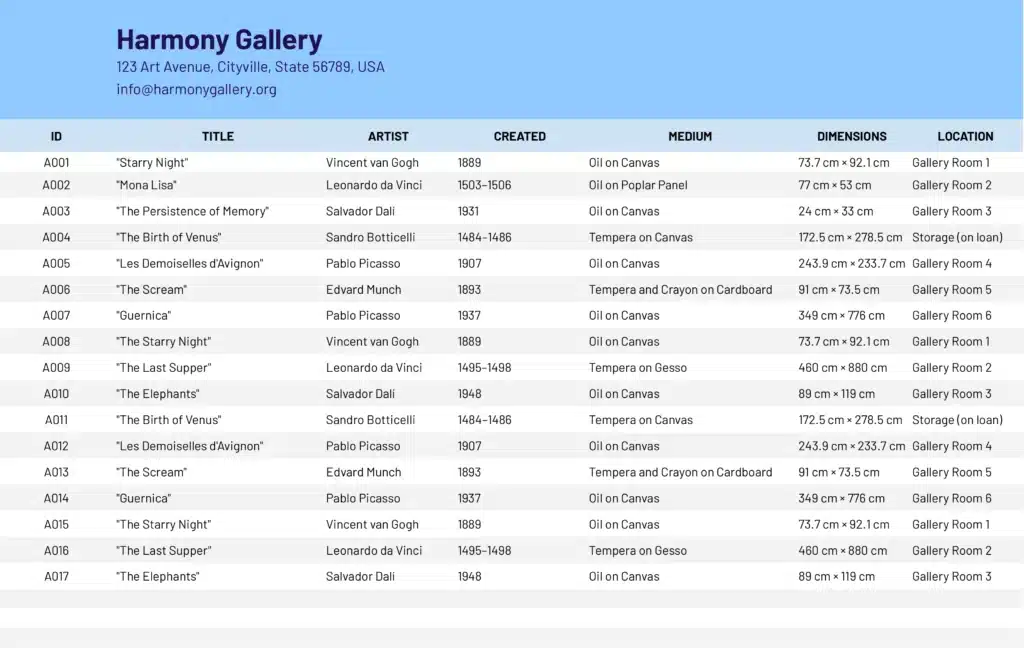
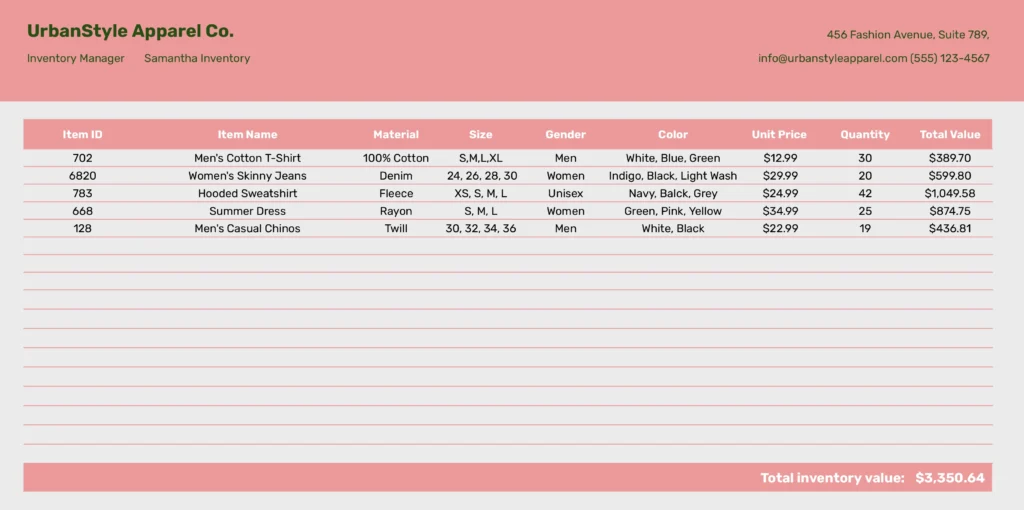
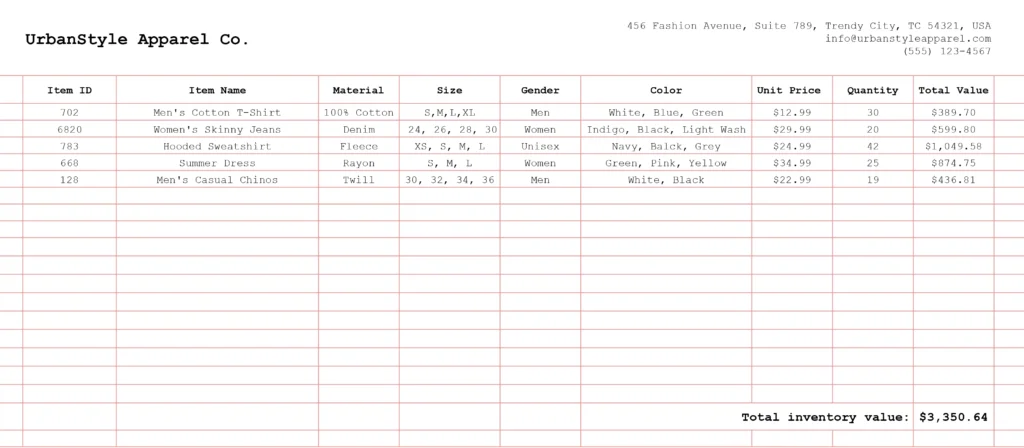
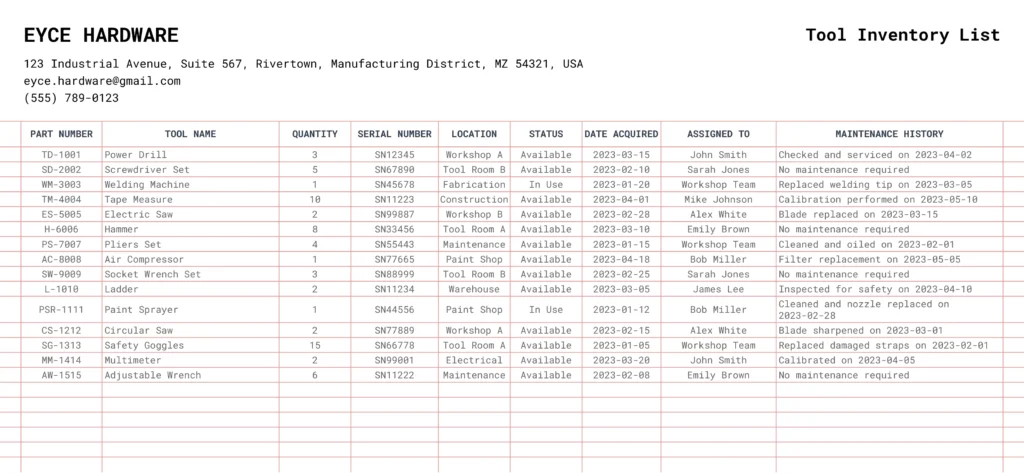
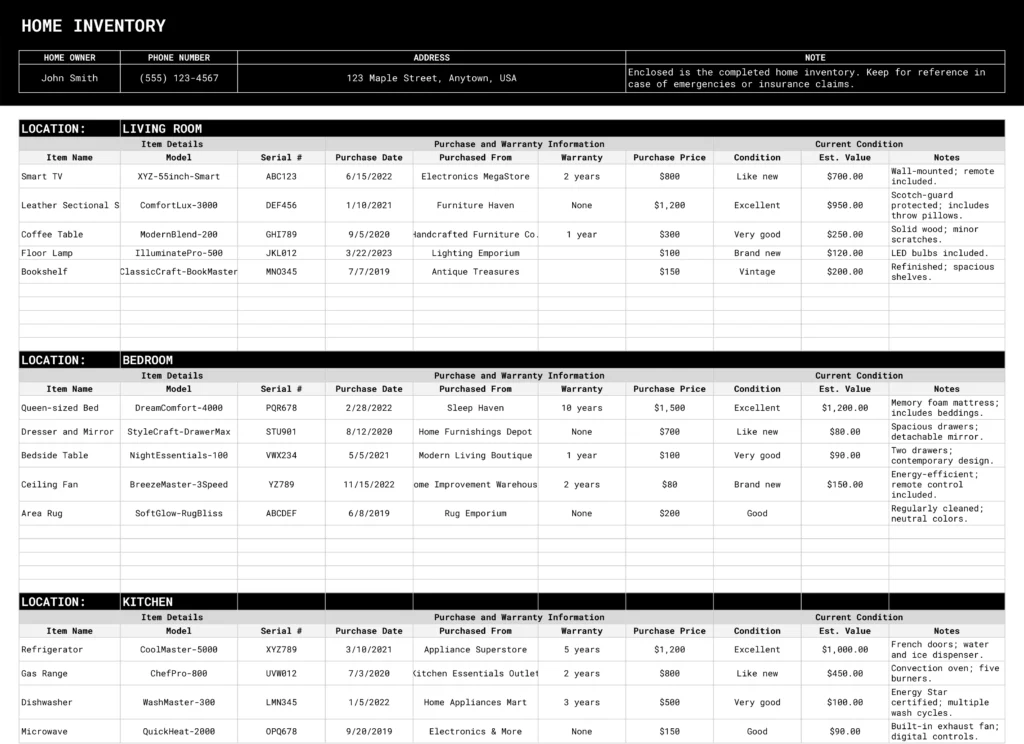
Keeping tabs on your inventory can be a daunting task, especially as your business grows. Coefficient’s free QuickBooks template for inventory tracking simplifies this process, giving you real-time insights into your stock levels and helping you make informed decisions.
What is an Inventory Tracking Report?
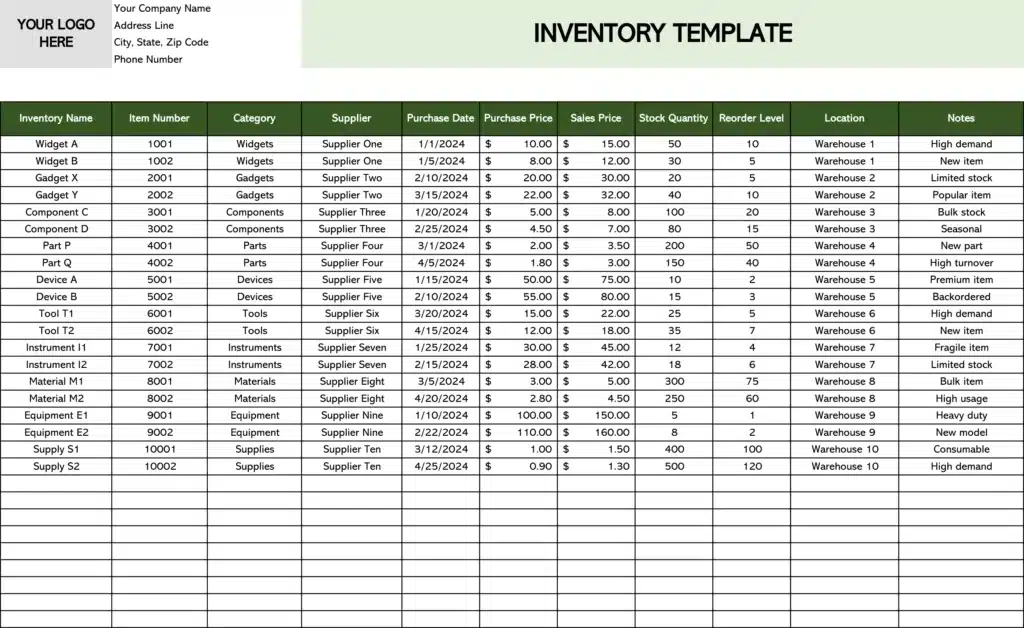
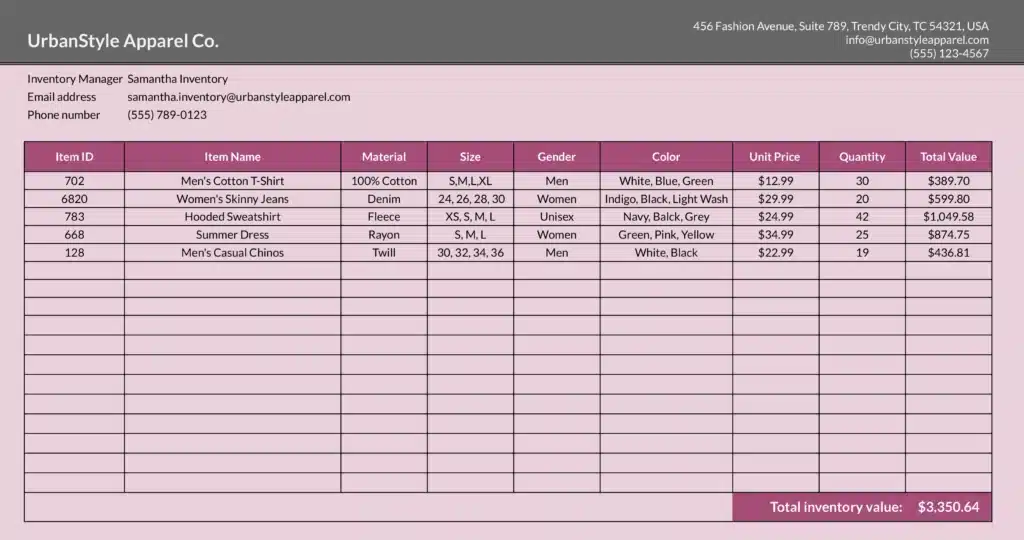
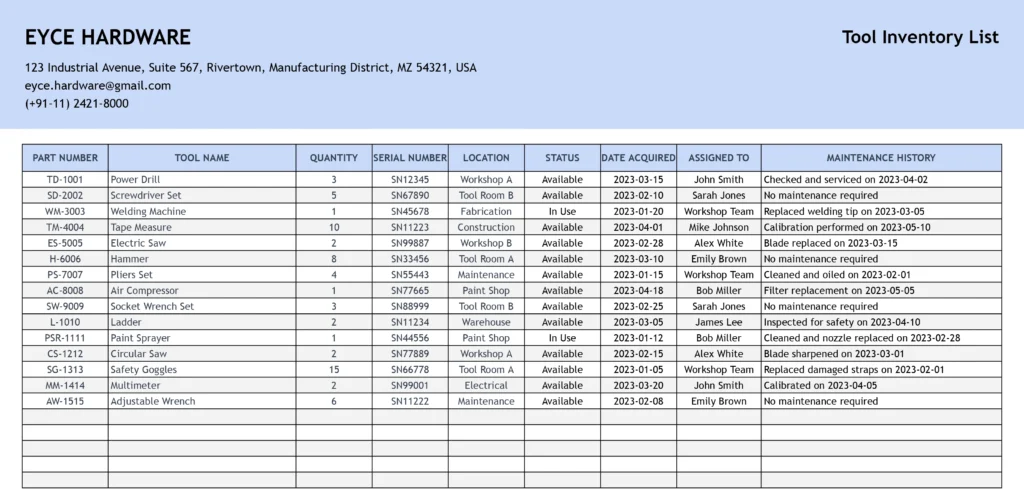
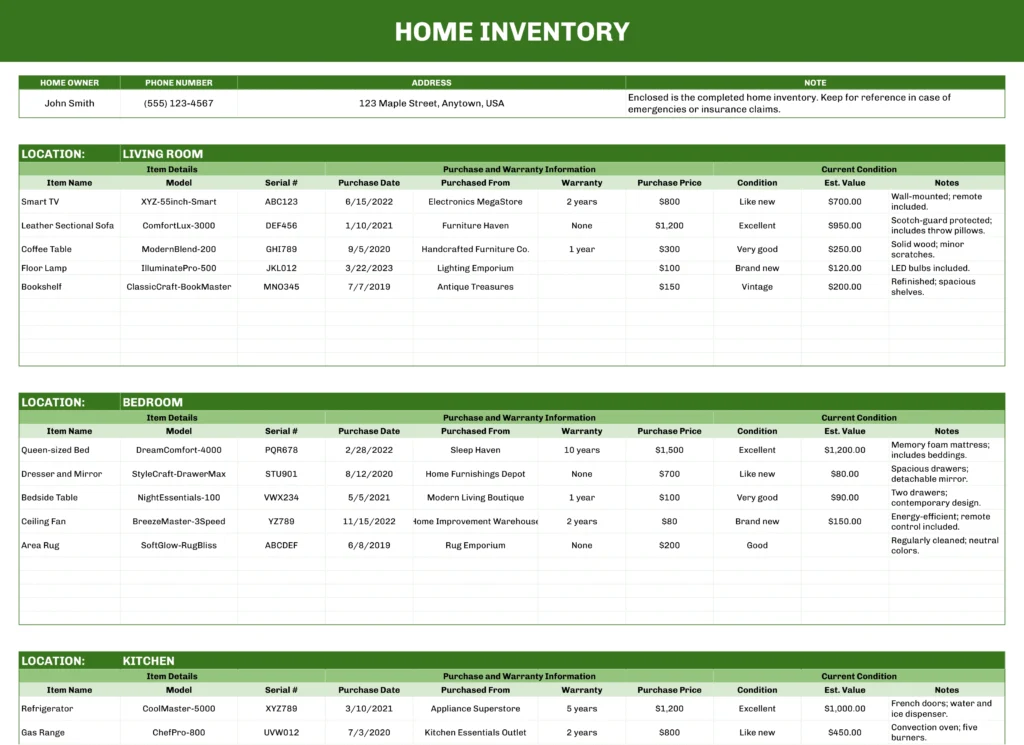
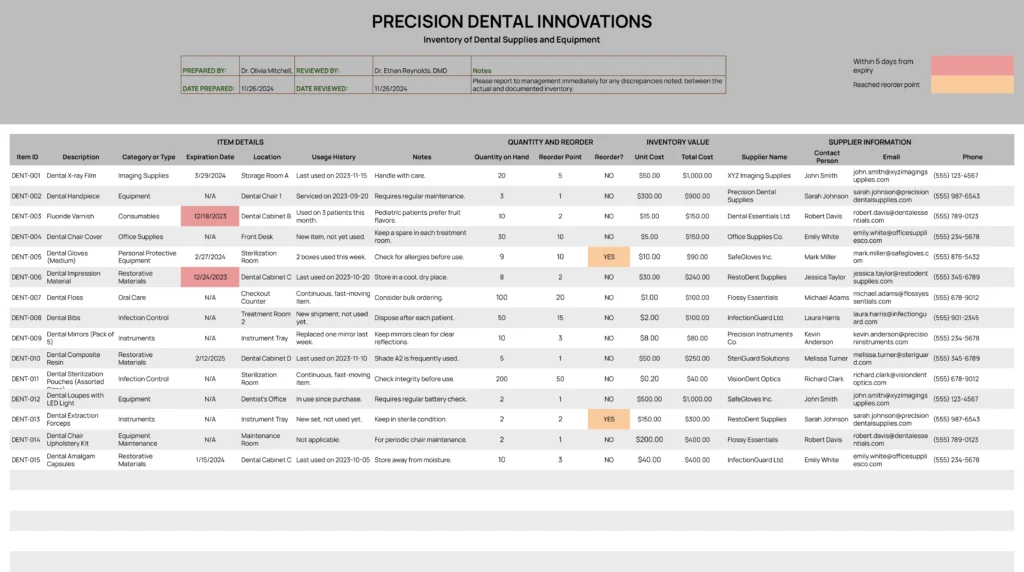
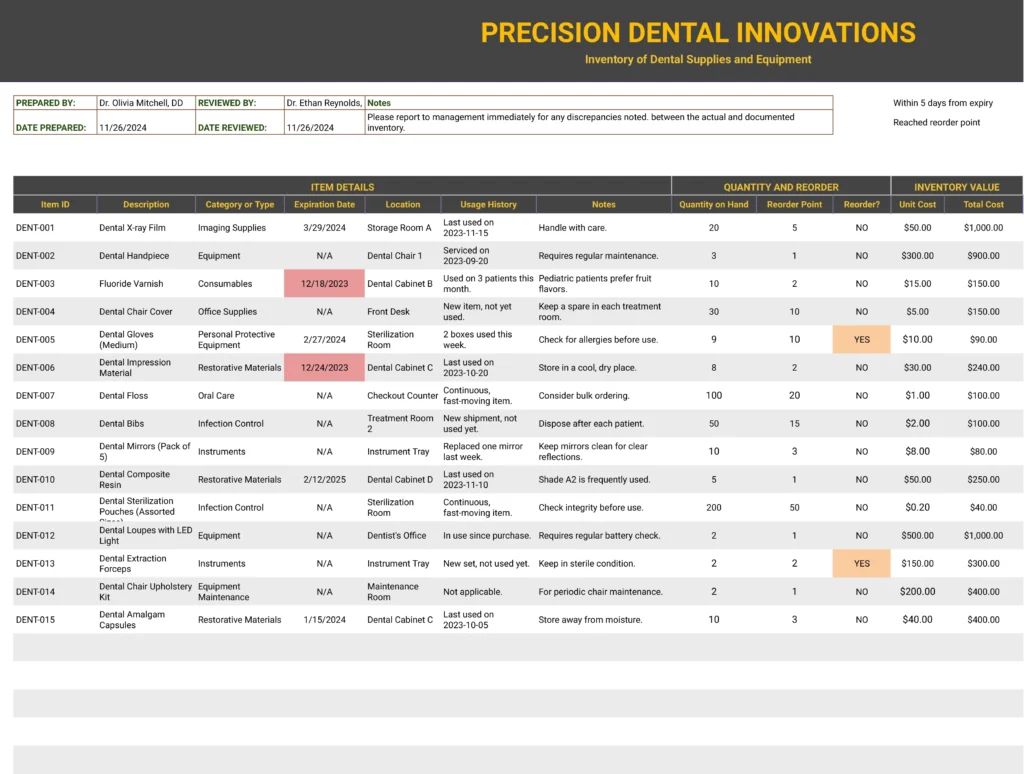
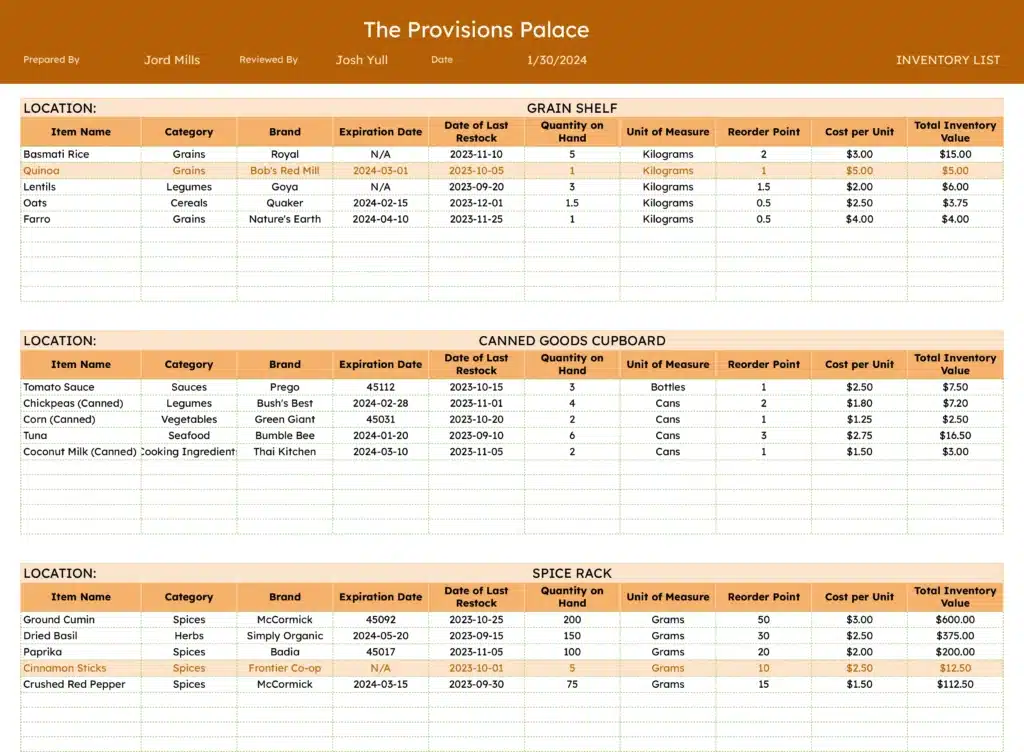
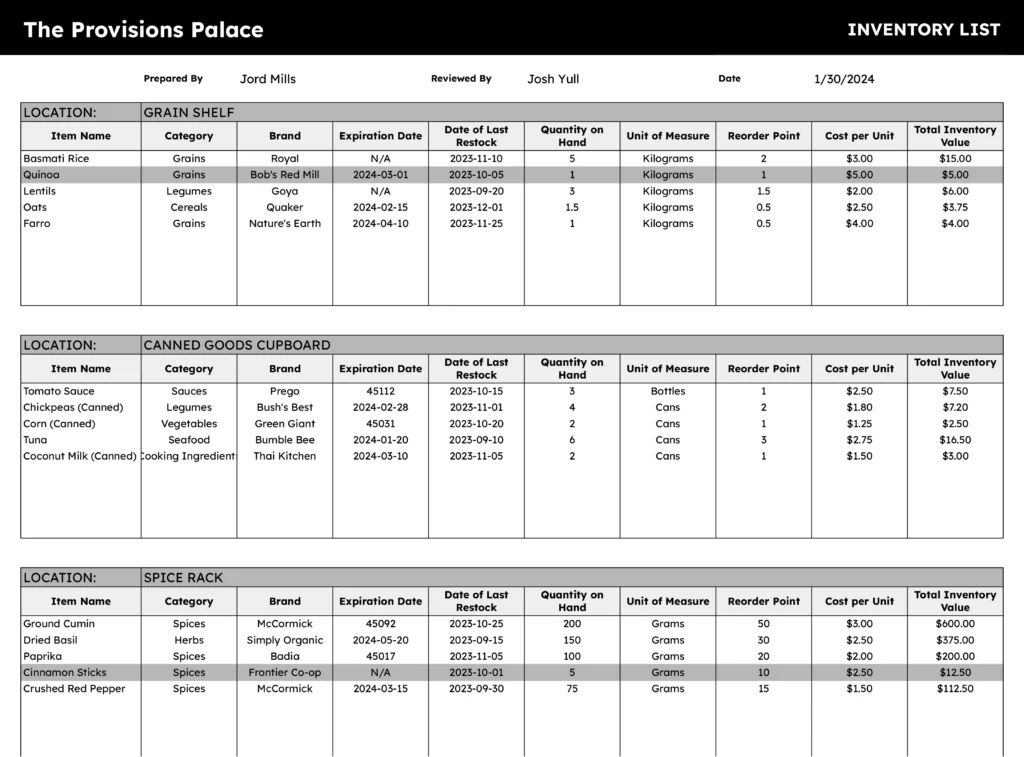
An inventory tracking report is a comprehensive document that provides a snapshot of your current stock levels, item details, and key metrics related to your inventory. It’s an essential tool for businesses of all sizes to monitor stock movements, prevent stockouts, and optimize inventory management.
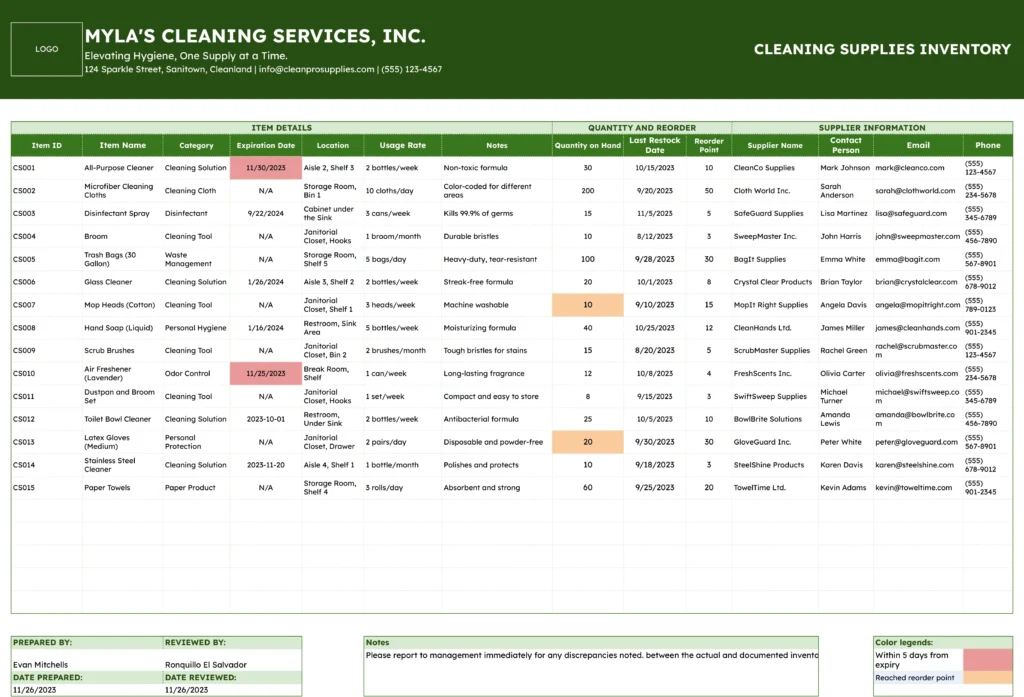
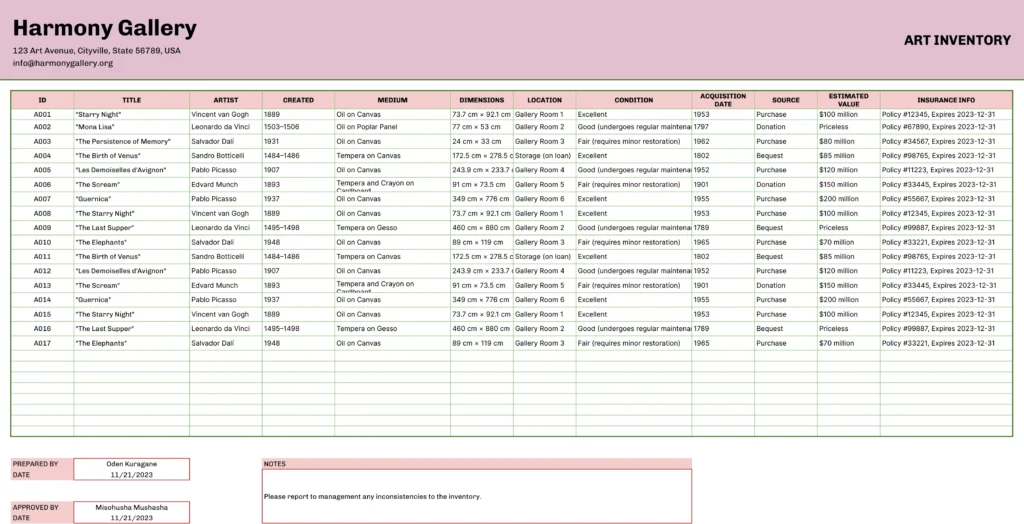
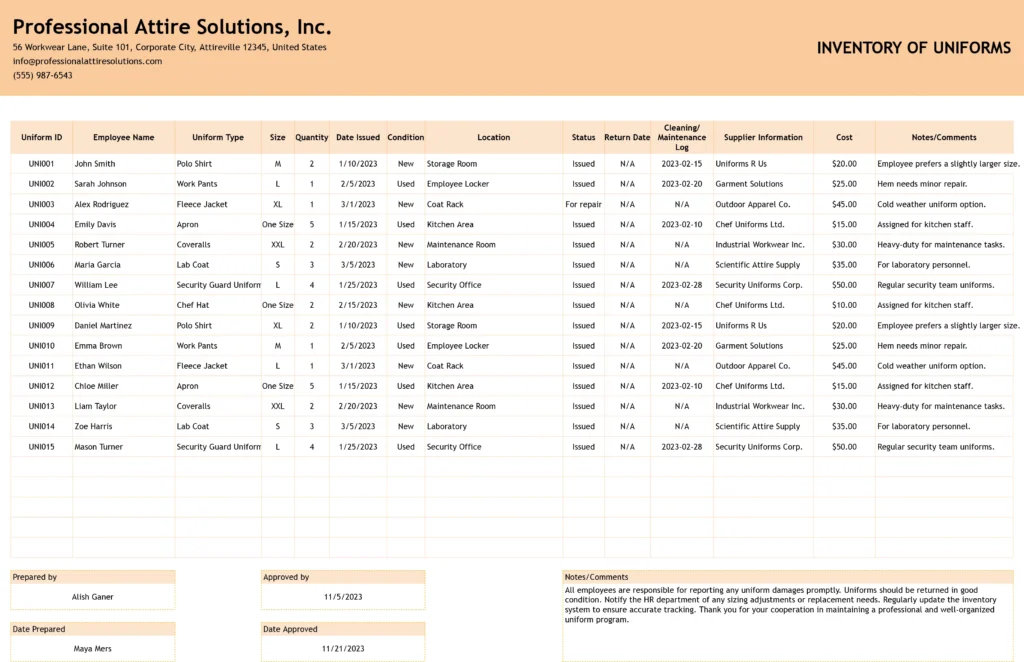
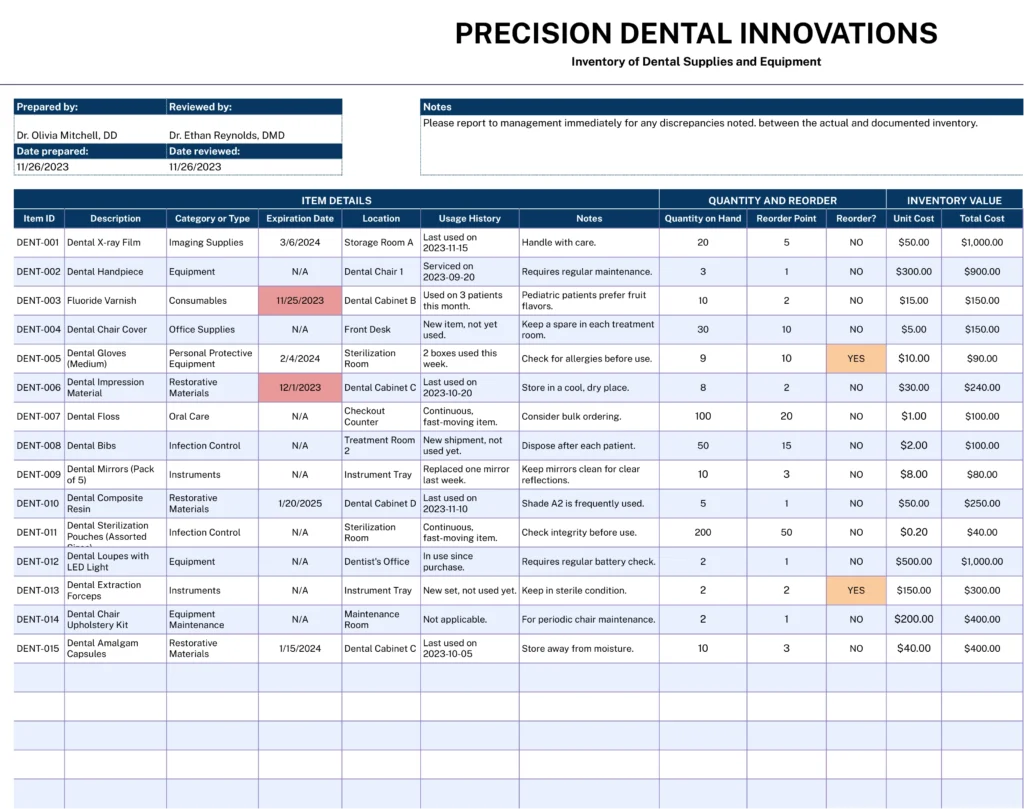
This report typically includes information such as item descriptions, quantities on hand, reorder levels, and inventory values. By maintaining an up-to-date inventory tracking report, businesses can ensure they have the right products in the right quantities at the right time, ultimately improving customer satisfaction and operational efficiency.
Who is the Inventory Tracking Template Built For?
This template is designed for:
- Small to medium-sized business owners
- Inventory managers
- Operations managers
- E-commerce entrepreneurs
- Retail store managers
Anyone responsible for managing inventory and making stock-related decisions will find this template invaluable.
What is the Primary Use Case for the Inventory Tracking Template?
The primary use case for this template is to provide a real-time, comprehensive view of your inventory status. It allows you to:
- Monitor stock levels across multiple locations
- Identify slow-moving or fast-selling items
- Calculate inventory values
- Set and track reorder points
- Analyze supplier performance
- Make data-driven decisions about stock replenishment
Benefits of Using QuickBooks Inventory Tracking Template
- Real-time data synchronization: The template automatically pulls the latest data from QuickBooks, ensuring your inventory information is always up-to-date.
- Customizable reporting: Tailor the report to your specific needs by adding or removing metrics as required.
- Time-saving automation: Eliminate manual data entry and reduce the risk of errors associated with spreadsheet management.
- Enhanced decision-making: With all your inventory data in one place, you can make informed decisions about stock levels, reordering, and supplier management.
- Improved cash flow management: By optimizing your inventory levels, you can reduce excess stock and free up capital for other areas of your business.
Metrics Tracked in the Report
- Item SKU/ID
- Item Description
- Category
- Location/Warehouse
- Quantity on Hand
- Reorder Level
- Reorder Quantity
- Unit Cost
- Total Value
- Supplier Name
- Lead Time
- Last Restocked Date
- Sales Rate (Units Sold per Period)
More Metrics to Track and Analyze on Google Sheets
With Coefficient’s QuickBooks integration, you can pull additional data and create custom reports:
- Profit & Loss statements
- Budget vs. Actuals comparisons
- Expenses by Vendor
- Accounts Payable and Accounts Receivable dashboards
- Month-over-Month growth analysis
- Consolidated financial reports across multiple entities


