The HubSpot MCP record limit, and how to build pipeline dashboards anyway
The HubSpot MCP is great for quick lookups. It is the wrong tool for a live pipeline dashboard, and the reason is a hard cap on how much data it returns per call.

The short version
The HubSpot MCP returns roughly 200 records per call. A pipeline dashboard needs thousands of rows, so Claude has to make hundreds of paginated calls through its context window, where requests time out, fail, or silently drop records. A direct API connector pulls the full dataset in one pass instead.
Why your Claude HubSpot dashboard stalls
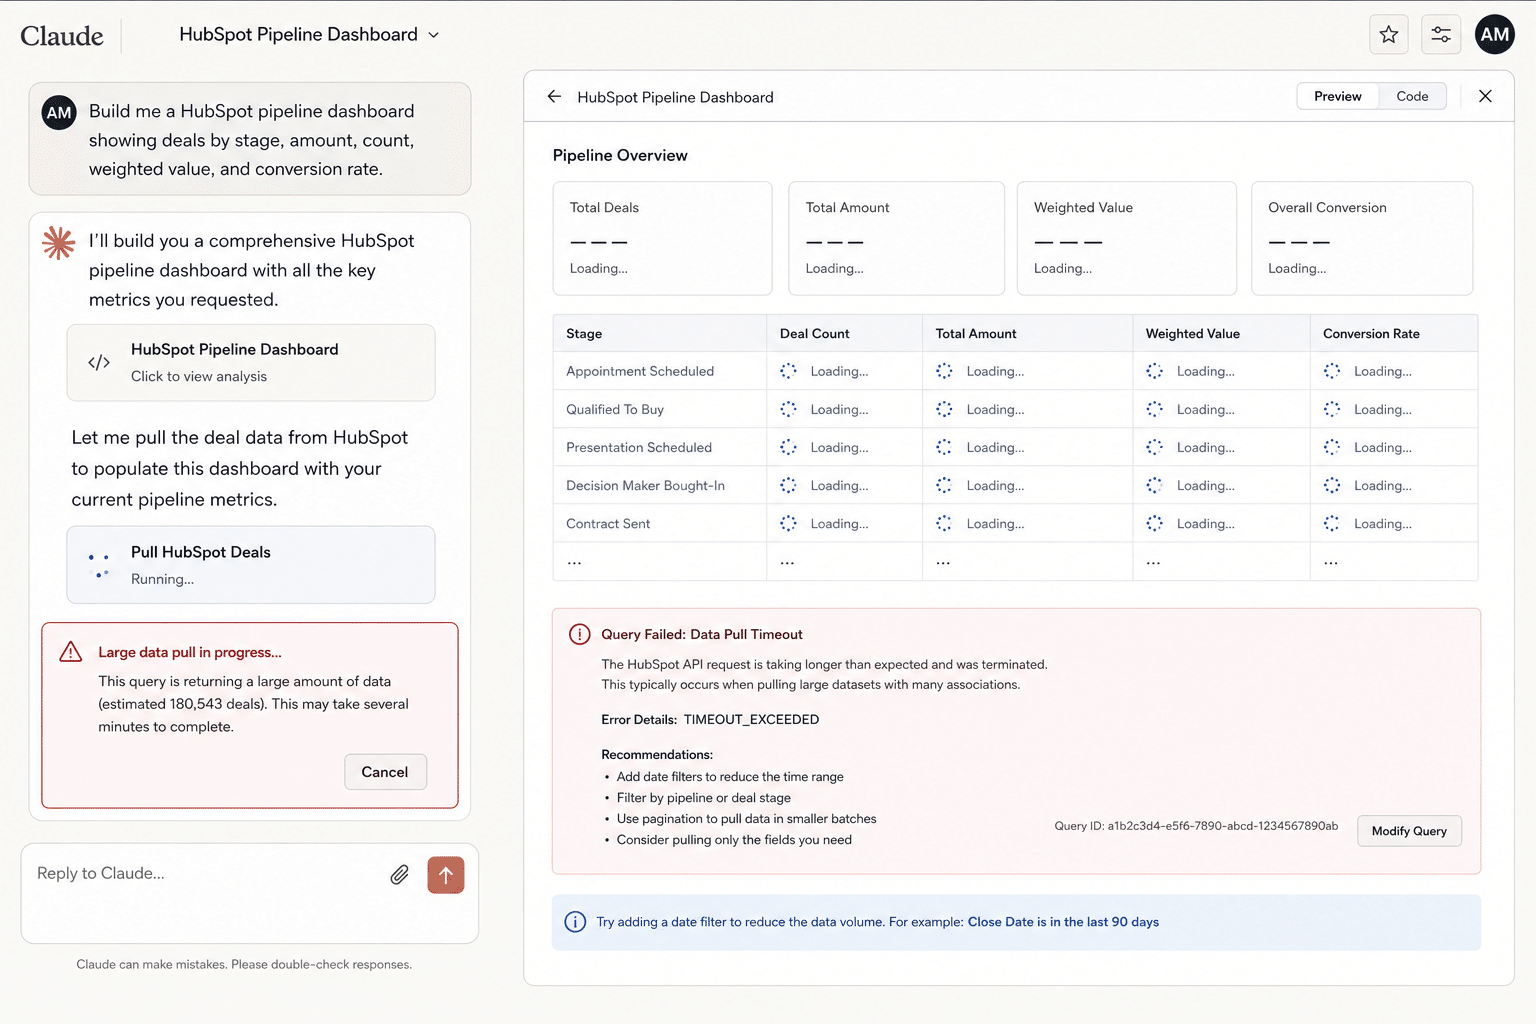
It starts well. You connect the HubSpot MCP to Claude, ask for a pipeline dashboard, and the first version looks great. Claude pulls a sample of deals, groups them by stage, and renders a clean breakdown in seconds.
Then you point it at the real pipeline. The thousands of open deals, every owner, every stage, the last twelve months. That is where it stops behaving. Claude churns, retries, returns partial numbers, or quietly gives you a subset and presents it as the whole.
The reports where it stalls first
The cap only bites when you need the whole dataset, which is exactly what real pipeline reporting requires. These are the views teams hit the wall on first:
- Pipeline by stage and owner: every open deal grouped and summed, not a sample.
- Weighted forecast: probability-adjusted value across the full pipeline.
- Deal velocity and stage aging: how long deals sit, which needs every deal's history.
- Win/loss and conversion rates: closed deals over months, far past 200 rows.
- Activity and rep productivity: calls, emails, and meetings logged across the team.
What the 200-record cap actually does
The HubSpot MCP returns about 200 records per call. That is fine for a lookup. It is a wall for reporting, because pipeline analysis needs the whole dataset, not a page of it.
To get thousands of rows, Claude has to paginate: call after call after call, stitched together inside its context window. Every one of those calls is a place something can go wrong.
What the cap costs: a worked example
Say Devon, a RevOps lead, asks Claude for a pipeline-by-stage dashboard across 5,000 open deals. Here is what actually happens:
- Claude starts paginating. At roughly 200 records a call, 5,000 deals is about 25 calls, each metered, just to load the data.
- A call fails partway. One request times out. The model does not always notice, so it keeps going with the rows it has.
- The totals come back light. The stage breakdown is missing a few hundred deals, but nothing flags the gap and the number looks plausible.
- Re-running changes the answer. Ask again and a different call drops, so the totals shift. There is no stable number to report.
- The dashboard never solidifies. What looked instant in the demo will not hold the full pipeline reliably enough to trust on a Monday forecast call.
The work was never the analysis. It was moving thousands of rows through a window that was never built to carry them.
- Volume: thousands of rows means hundreds of metered calls for a single refresh.
- Reliability: any call can time out or fail, and the model may not notice it dropped rows.
- Determinism: route data through an LLM and the same question can return different totals.
Does it get worse at scale?
It compounds. A 500-deal pipeline might limp through. A 50,000-deal one multiplies the page count and the failure points until a reliable refresh is out of reach. It is the same wall the rest of the series traces from tool to tool: see the full Claude Boomerang pattern for how the cost scales as the data grows.
This is the important part: it is not a prompting problem. No clever instruction raises the cap or makes pagination reliable. It is an architecture problem, so it needs an architecture fix.
| Pulling a 5,000-row pipeline | Claude + HubSpot MCP | Coefficient |
|---|---|---|
| Records per call | ~200, must paginate | Full dataset, one pass |
| Calls for one refresh | Hundreds | One scheduled job |
| Refresh | Manual re-run | Auto, hourly to monthly |
| Reliability | Calls can time out or drop rows | Deterministic, LLM never touches the data |
How to build the dashboard anyway
Take the data path away from the model. A HubSpot connector pulls the full dataset through the direct API into your spreadsheet in one pass, then keeps it fresh on a schedule you set. The AI still helps, it plans the view and writes the logic, but it builds on top of complete, trustworthy data instead of trying to carry that data through its context window.
The result is the dashboard Claude promised in the demo, except it holds every row and refreshes on its own.
When the MCP is still the right tool
The cap only hurts when you need full datasets. For small lookups and single-record actions, like checking one deal or updating a contact, the HubSpot MCP is genuinely useful. Reporting is just the wrong job for it.
Related reading: the full Claude Boomerang pattern and where Claude breaks on Salesforce dashboards.
Common questions
How many records can the HubSpot MCP return per call?
Why does my Claude HubSpot dashboard time out?
Can Claude build a reliable HubSpot pipeline dashboard?
When is the HubSpot MCP still the right tool?
What is the HubSpot MCP?
Can I raise the HubSpot MCP record limit?
How do I pull all my HubSpot deals into Google Sheets?
Build a HubSpot dashboard you can trust
Pull your full pipeline through a direct connection, trust every number back to the source, and share a live dashboard with anyone on the team, no CRM seat required.
Start Building for Free