The Claude Boomerang: why teams build dashboards in Claude and land on Coefficient
Claude wins the demo moment. Coefficient wins the job. Here is the 30-60 day cycle we watch teams run, and how to skip the painful part.

Definition
The Claude boomerang is the predictable 30-60 day cycle in which a team builds a dashboard or report in Claude, hits limits around data accuracy, live refresh, scale, sharing, and maintenance, and migrates the work to a dedicated AI dashboard tool such as Coefficient.
The cycle, day by day
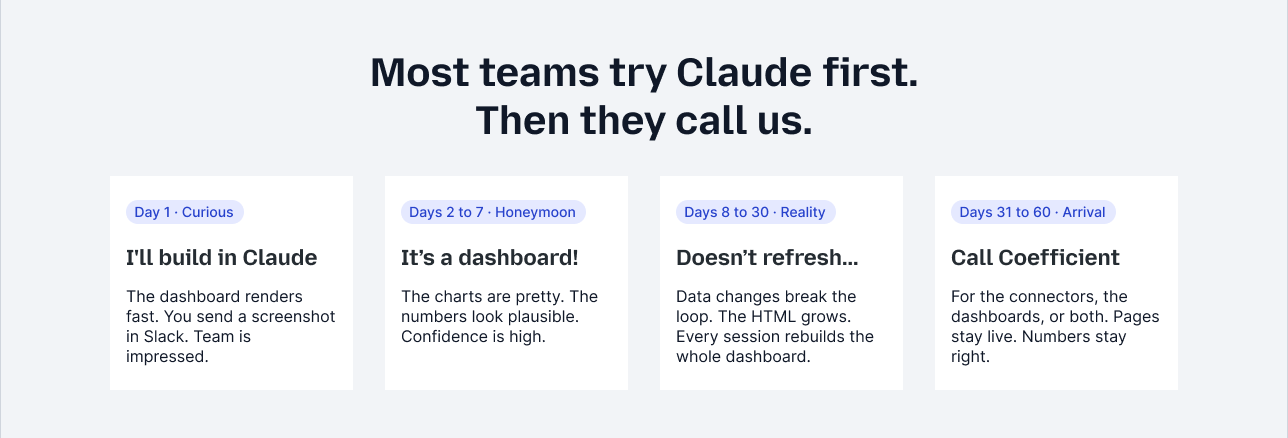
From "I'll just build this in Claude" to "Coefficient does all my reporting and analysis now."
Day 0
Curiosity
"I'll just build this in Claude." Free prompts, an impressive demo.
Days 1-7
Honeymoon
It renders fast and looks impressive. The team is pumped.
Days 7-30
Reality
Numbers drift. Refresh is manual. Sharing breaks. The code bloats.
Days 30-60
Arrival
The work moves to Coefficient for live data and durable dashboards.
Where it cracks
Six walls teams hit. Each one is a deeper guide in this series.
Hallucinated numbers
Claude made up the board figures and admitted it. Two days a week lost to re-auditing.
Claude for finance → RefreshNo live connection
Every source change means exit, edit, re-run, paste back, regenerate. No schedule.
Claude for Excel and Sheets → ScaleThe MCP record wall
The HubSpot MCP caps near 200 records per call. Pipeline data needs thousands.
The HubSpot MCP wall → ScaleCross-object breaks
Great for one query, fragile the moment you need Salesforce reporting that refreshes.
Salesforce dashboards → SharingArtifacts freeze
No per-person access, no free viewer seats, edits need re-prompting.
Claude Artifacts limits → MaintenanceVibe-code debt
A non-coder now owns a 2,000-line app. One bad prompt forces a full revert.
Vibe-coded dashboards →The three limits, and the architecture that fixes them
Three architectural limits send a Claude dashboard back: non-deterministic output, no live connection or scheduling, and unmaintainable prompt-generated code. The fix is to stop asking the model for the number.
AI plans and writes SQL
The model designs the query, it does not invent the answer.
SQL produces the numbers
Deterministic, repeatable, clickable back to source.
Connectors refresh on schedule
Live data, hourly to monthly, with no manual rebuild.
The LLM never touches the data path.
Two ways teams arrive
Most teams come back through one of these two doors.
Door A: Connectors first
"Claude can't reliably reach my data."
- 150+ live API integrations
- Offline, scheduled refresh
- Full datasets you can trust, not 200-row samples
Door B: Dashboards first
"My Claude dashboard is too fragile to maintain."
- Shared URLs and viewer access
- SQL-grounded, explainable metrics
- Click-to-edit cards, no re-prompting
Teams building the frontier of AI run their reporting on Coefficient.
Common questions
What is the Claude boomerang?
Why can't Claude maintain a live dashboard on its own?
Can Claude connect to live data?
How is Coefficient different from building in Claude?
Skip the boomerang
Connect your data, trust every number, and share a live dashboard with the whole team.
Start Building for Free