Managing financial adjustments and allocations across multiple entities can be complex and time-consuming. Coefficient’s free QuickBooks template for Entities Adjustment and Allocations With Dashboard simplifies this process, providing a clear overview of your financial data in one place.
What is an Entities Adjustment and Allocations Report?
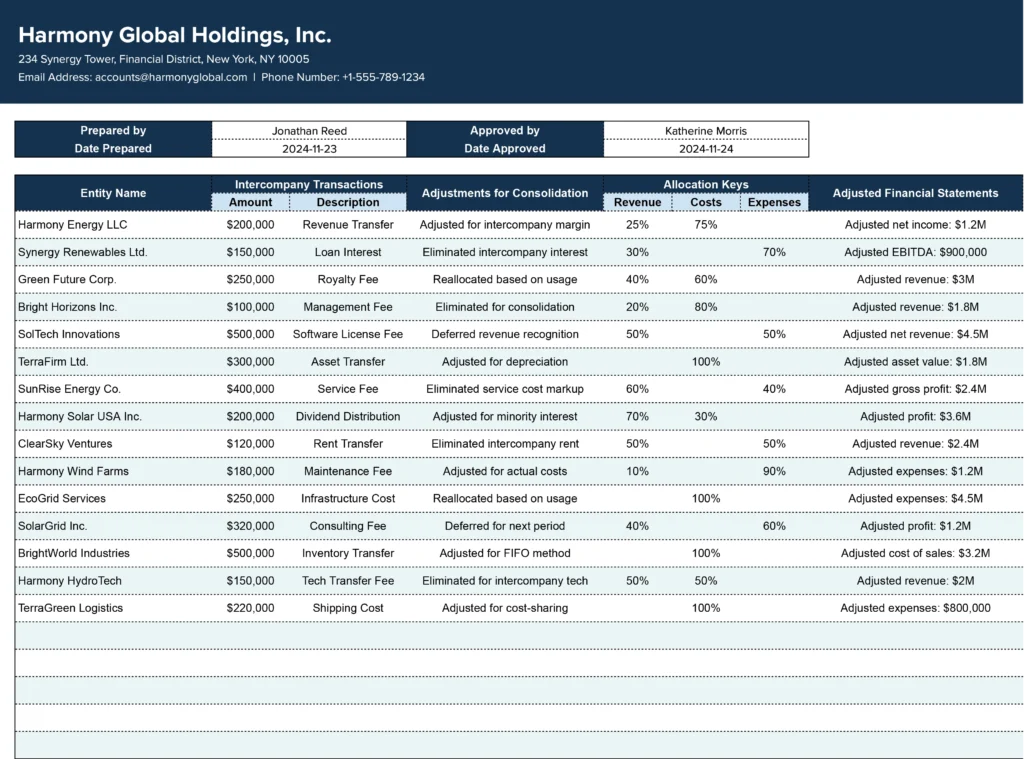
An Entities Adjustment and Allocations report is a financial tool that helps businesses manage and visualize adjustments and allocations across multiple entities or subsidiaries. This report typically includes:
- Intercompany transactions
- Consolidation adjustments
- Allocation of shared costs or revenues
- Adjusted financial statements for each entity
- Consolidated financial metrics
The report allows finance teams to ensure accurate financial reporting, comply with accounting standards, and gain a comprehensive view of the organization’s financial health across all entities.
Who is the Entities Adjustment and Allocations template built for?
This template is designed for:
- Financial managers and controllers in multi-entity organizations
- Accounting professionals handling consolidated financial statements
- Business owners overseeing multiple subsidiaries or divisions
- CFOs and finance teams responsible for group-level financial reporting
What is the primary use case for the Entities Adjustment and Allocations template?
The primary use case for this template is to:
- Consolidate financial data from multiple entities
- Apply necessary adjustments for accurate reporting
- Allocate shared costs or revenues across entities
- Generate adjusted financial statements for each entity
- Provide a dashboard view of key financial metrics across the organization
Benefits of using the QuickBooks Entities Adjustment and Allocations Template
- Simplified Consolidation: Easily combine financial data from multiple QuickBooks accounts into a single, comprehensive view.
- Customizable Allocations: Flexibly allocate costs and revenues based on your specific business rules and drivers.
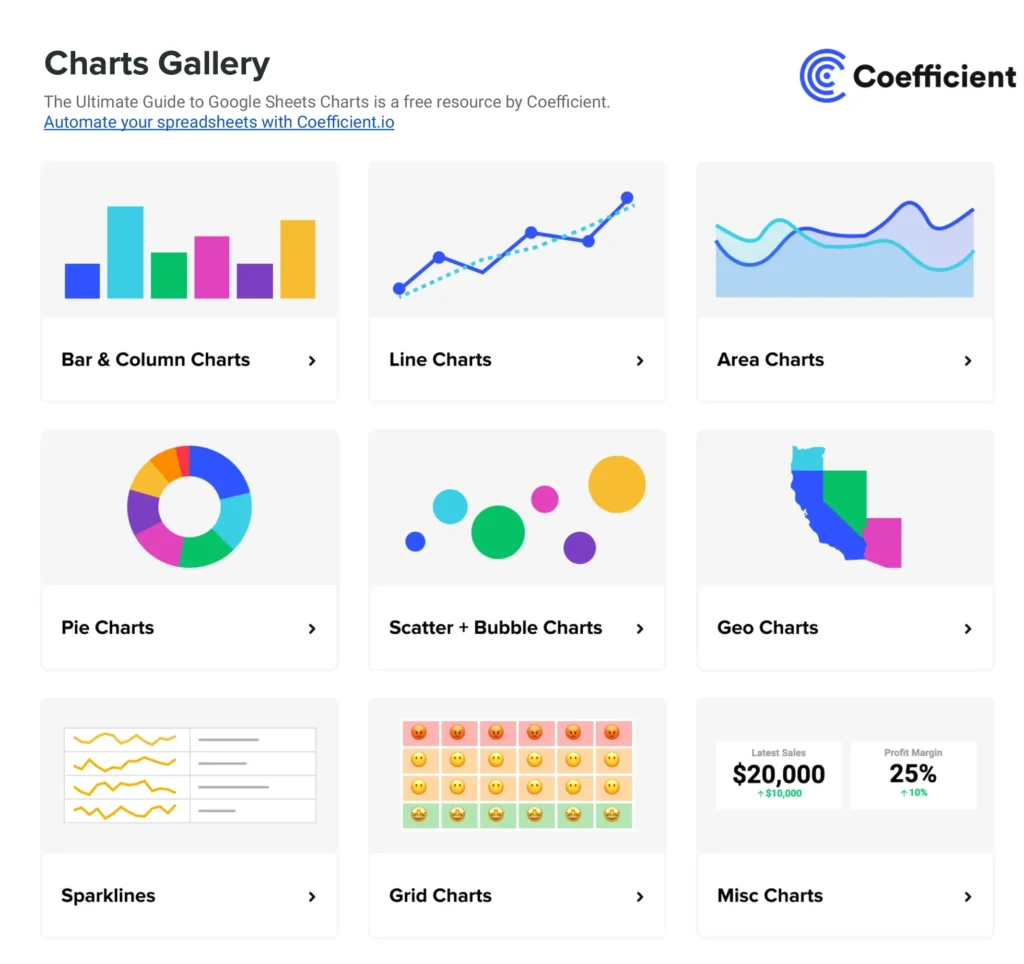
- Visual Dashboard: Quickly grasp key financial metrics and trends across all entities with intuitive charts and graphs.
- Time-Saving: Reduce manual data entry and calculation errors with pre-built formulas and structures.
- Consistency: Ensure uniform reporting and allocation methods across all entities in your organization.
Metrics Tracked in the Report
- Entity Name
- Intercompany Transactions
- Adjustments for Consolidation
- Allocation Keys (Revenue, Expense Drivers)
- Adjusted Financial Statements per Entity
- Consolidated Financial Metrics
- Ownership Percentages
- Equity Adjustments
- Dashboard Visuals (Graphs/Charts)
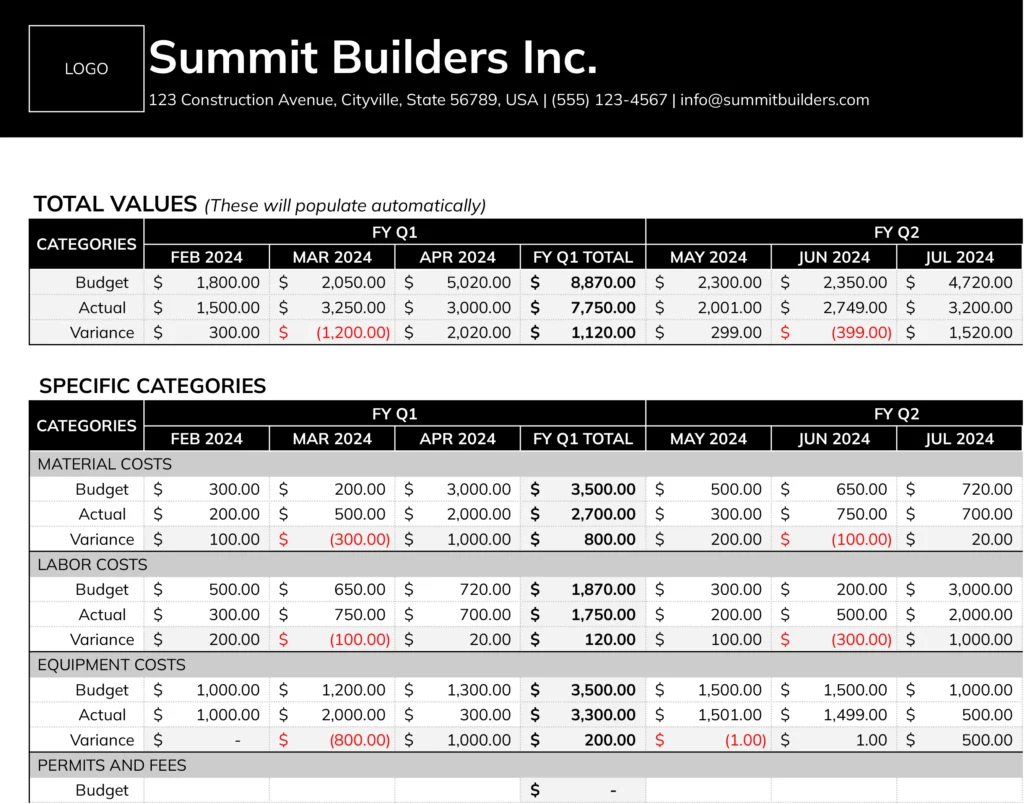
- Variance Analysis
- Compliance and Regulatory Adjustments
More Metrics to track and analyze on Google Sheets
With Coefficient’s QuickBooks integration, you can expand your financial analysis by pulling additional metrics such as:
- Profit & Loss by Class
- Expenses by Vendor
- Profit & Loss by Month & Class
- Consolidated P&L
- Profit & Loss – MoM Growth
- Accounts Payable Dashboard
- Accounts Receivable Dashboard
You can also:
- Connect to multiple companies
- Choose from various report types
- Maintain cell references during data refreshes
- Drill down into specific data points
- Automatically consolidate multiple reports
- Sort data by Department or Location
Frequently Asked Questions
How do I set up allocation rules for multi-entity accounting?
To set up allocation rules:
- Define your allocation bases (e.g., revenue, headcount, square footage)
- Determine which costs or revenues need to be allocated
- Create allocation formulas in the template
- Apply these formulas consistently across all relevant entities
- Review and adjust allocations periodically to ensure accuracy
What are some best practices for entity adjustments in consolidated financial statements?
Some best practices include:
- Consistently apply accounting policies across all entities
- Eliminate intercompany transactions and balances
- Adjust for differences in reporting periods if necessary
- Consider minority interests in partially-owned subsidiaries
- Document all adjustments clearly for audit purposes
- Regularly review and update adjustment procedures
How can I improve visibility into entity-level financial performance?
To improve visibility:
- Use standardized reporting templates across all entities
- Implement a centralized data collection and consolidation process
- Create dashboards that highlight key performance indicators for each entity
- Set up regular financial review meetings with entity managers
- Use variance analysis to identify and investigate significant deviations from expectations
