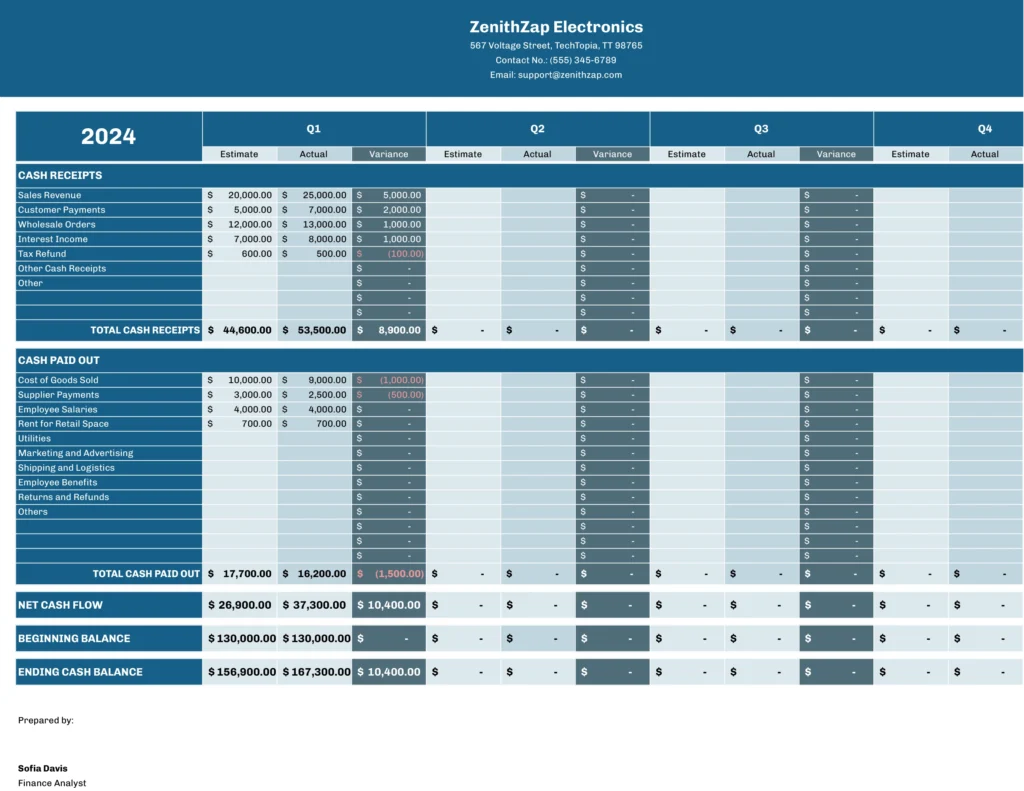
Financial planning can be complex and time-consuming. Coefficient’s free What-If Analysis template for QuickBooks simplifies the process, allowing you to explore multiple scenarios and make data-driven decisions with ease.
What is a What-If Analysis Report?
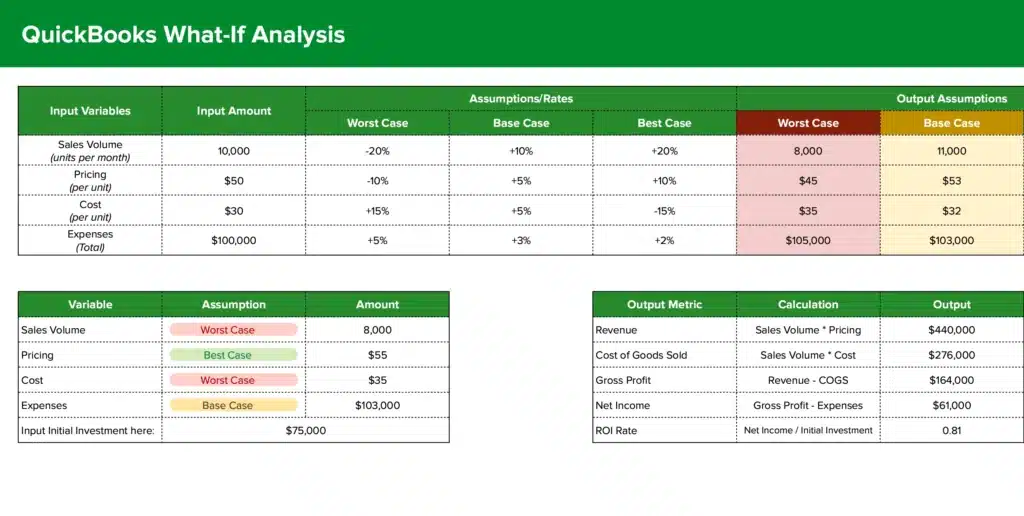
A What-If Analysis report is a powerful financial planning tool that allows businesses to explore various scenarios by changing key variables and observing their impact on outcomes. This type of analysis helps decision-makers understand potential risks and opportunities, enabling them to prepare for different future scenarios.
What-If Analysis typically involves creating multiple scenarios (such as best case, worst case, and most likely case) by adjusting variables like sales volume, pricing, or costs. The report then calculates and displays the resulting financial metrics for each scenario, providing a comprehensive view of possible outcomes.
Who is the What-If Analysis template built for?
This template is designed for:
- Financial analysts and planners
- Business owners and entrepreneurs
- CFOs and finance teams
- Strategic decision-makers
- Anyone involved in financial forecasting and scenario planning
What is the primary use case for the What-If Analysis template?
The primary use case for this template is to facilitate strategic financial planning and decision-making. It allows users to:
- Model different business scenarios
- Assess the impact of changing market conditions
- Evaluate potential investment opportunities
- Analyze the effects of various cost-cutting measures
- Plan for best and worst-case scenarios
By providing a structured framework for scenario analysis, this template helps businesses make more informed decisions and develop robust strategies for various potential futures.
Benefits of using the QuickBooks What-If Analysis Template
- Real-time data integration: The template connects directly to your QuickBooks account, ensuring that your analysis is always based on the most up-to-date financial information.
- Time-saving: Pre-built formulas and scenarios save hours of manual setup and calculation time.
- Improved decision-making: By easily comparing multiple scenarios side-by-side, you can make more informed choices about your business strategy.
- Flexibility: Customize the template to fit your specific business needs and add or modify scenarios as required.
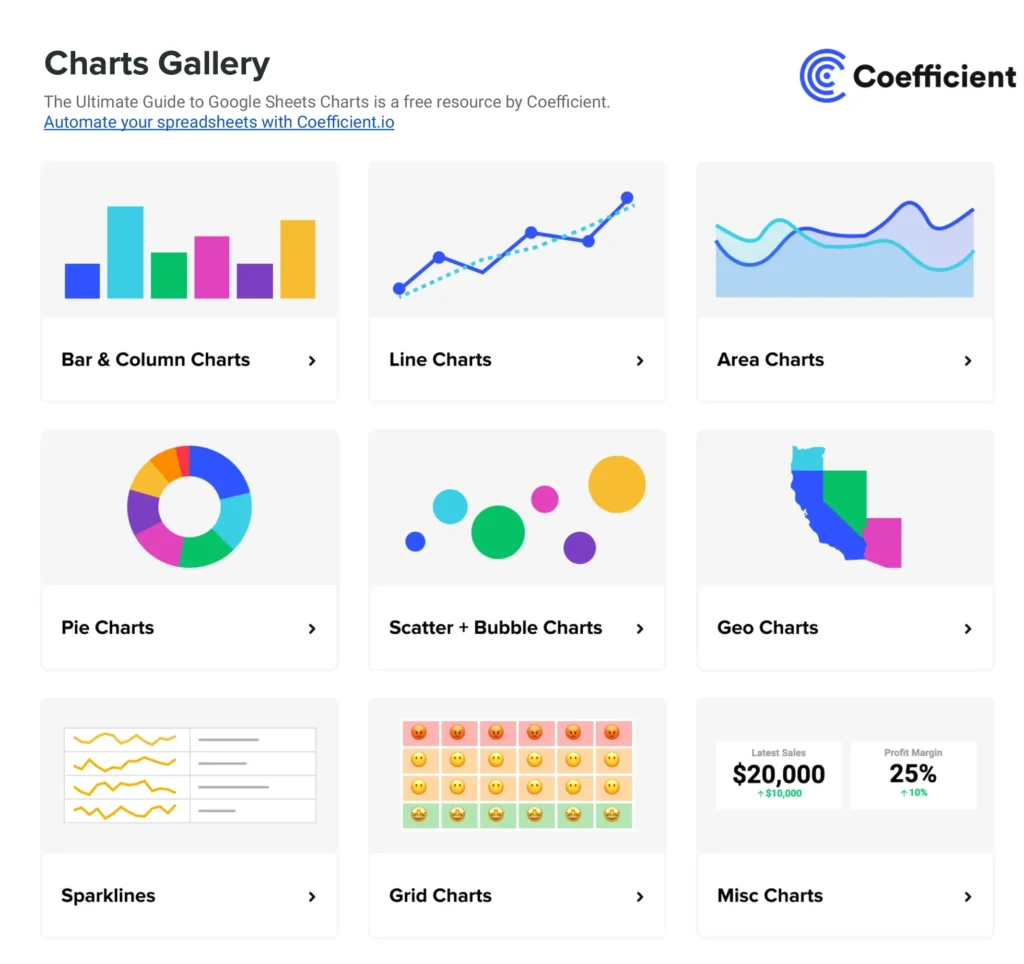
- Visual insights: Built-in charts and graphs help you quickly grasp the implications of different scenarios.
Metrics Tracked in the Report
The What-If Analysis template tracks and calculates the following metrics:
Base Case Assumptions
- Revenue Growth Rate
- Expense Growth Rate
- Interest Rates
Variable Inputs
- Sales Volume
- Pricing Changes
- Cost Variations
Scenarios
- Best Case
- Worst Case
- Most Likely Case
Output Metrics
- Net Income
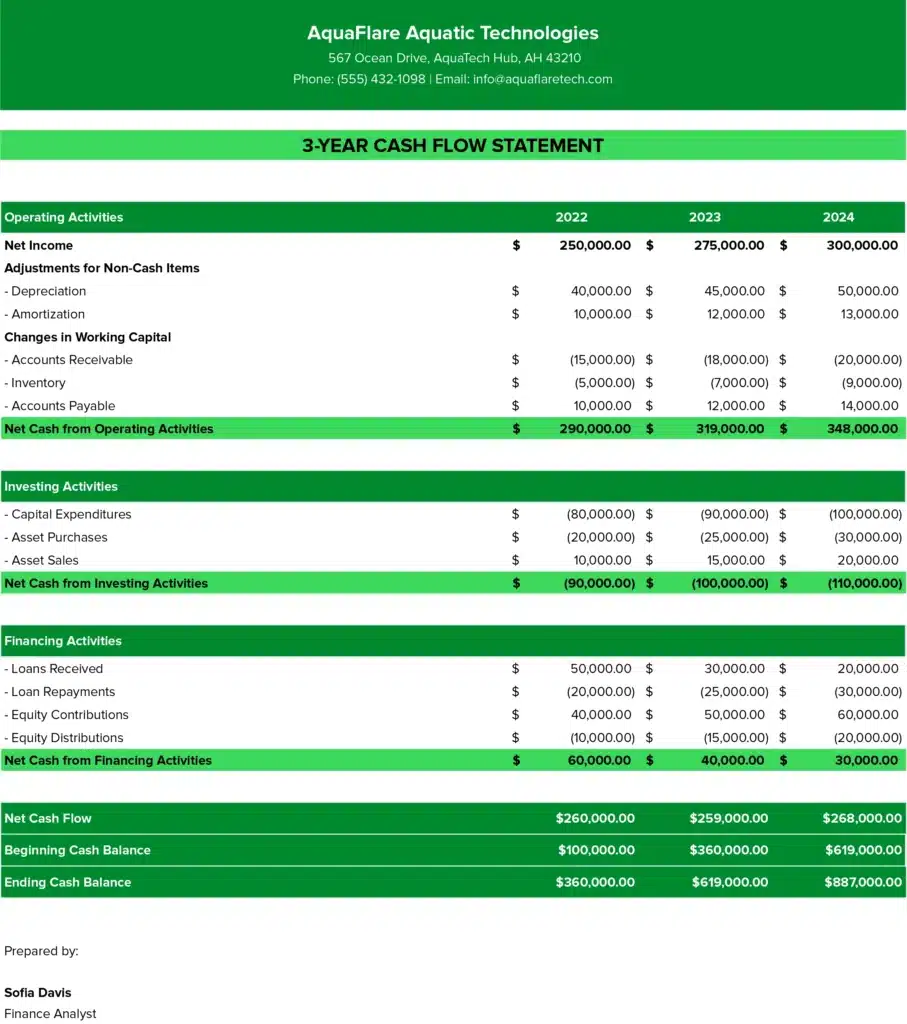
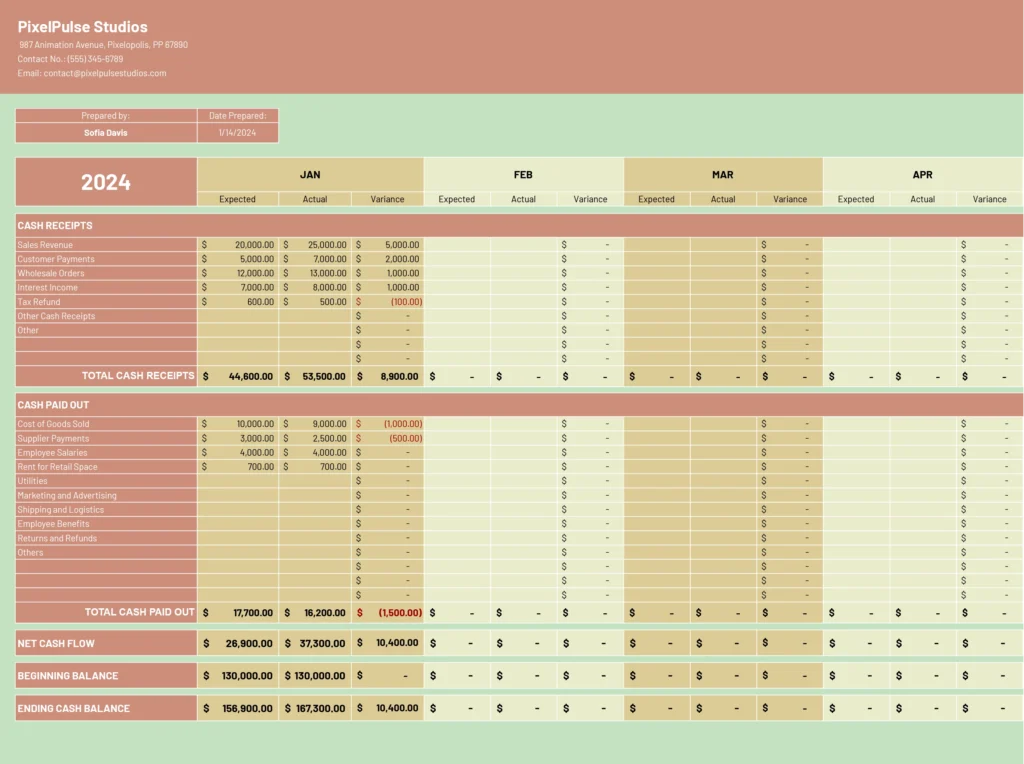
- Cash Flow
- ROI
Additional Features
- Sensitivity Tables
- Graphical Representations
More Metrics to track and analyze on Google Sheets
With Coefficient’s QuickBooks integration, you can pull and analyze additional metrics in Google Sheets:
- Profit & Loss data by month, quarter, or year
- Expenses broken down by vendor
- Accounts Payable and Accounts Receivable dashboards
- Budget vs. Actuals comparisons
- Consolidated Profit & Loss statements
- Month-over-Month growth analysis
You can also:
- Connect to multiple QuickBooks companies
- Choose from various report types
- Automatically consolidate reports
- Sort data by Department or Location
- Use pre-built financial templates for quick analysis
