Build a Live Revenue Dashboard in
Less Than 30 Minutes
Use this prompt guide to build a live revenue tracking dashboard in your spreadsheet.
Get Started Free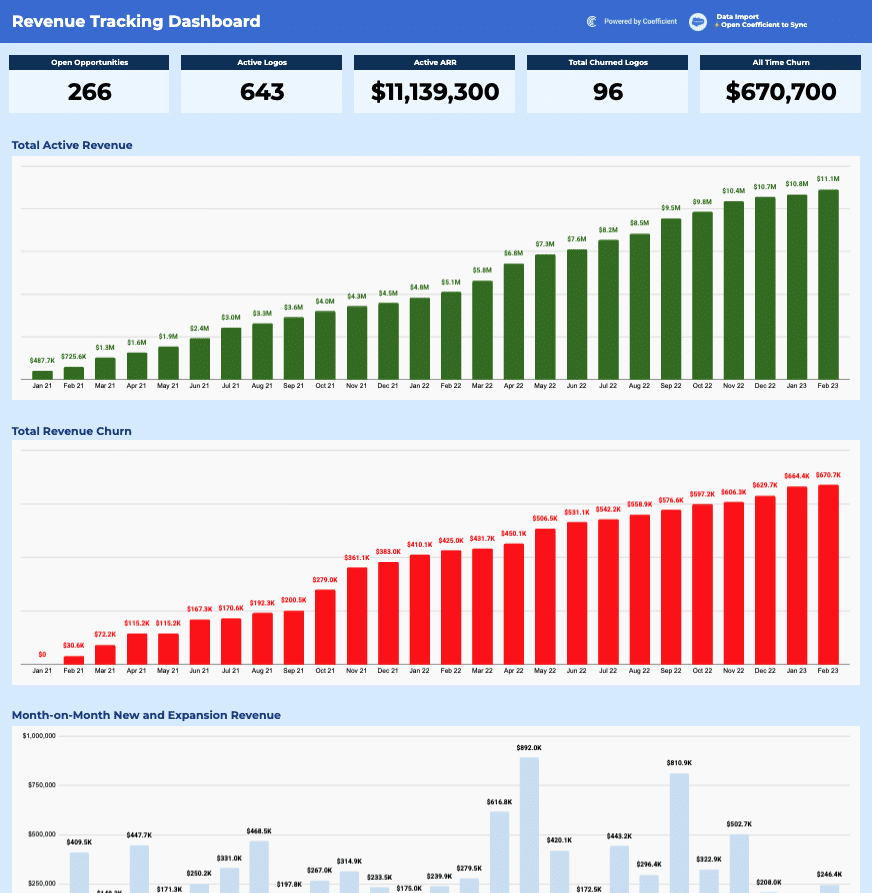
Before you start
Get set up in Coefficient for Google Sheets
- You'll need Coefficient AI to follow this guide. Coefficient is the AI assistant inside Google Sheets that turns prompts into live dashboards, reports, and analytics. Install it free to begin.
- Once you're in, click "Import from" on the Coefficient home screen and select your data source(s) to pull your data into the sheet. Not sure what data to import? Open the Coefficient Sheets Assistant — it can help you figure out where to start.
- Iterate on the prompts as you go. Tweak them to fit your team's workflow and make the dashboard your own. See more workflows built for revenue operations teams.
5 steps
Step-by-step prompts to build a live revenue dashboard
Import CRM Opportunity Data
Start by pulling your complete opportunity history into a dedicated tab. This is your source of truth — no filters, so you capture the full timeline.
Import all Opportunity data into a tab called '⚡ CRM Import'.
You'll need the following fields for all opportunities: Opportunity ID, Name, Created Date, Amount, Opportunity Type, Stage, Closed (boolean), Close Date, Won (boolean), Churn Date, Close Year Month (formatted as 'MMM YY'), and Close Year Month # (formatted as YYYYMM).
Pull all records — both open and closed — with no date filter so the full history is captured.
Build Live KPI Summary Cards
Create 5 metric cards that show your revenue health at a glance. Use formulas so they update automatically as new data flows in.
On a new tab called '📊 Revenue Tracking Dashboard', create 5 KPI metric cards in row 6–7 using formulas that reference the '⚡ CRM Import' tab:

Open Opportunities — count of rows where Closed = FALSE
Active Logos — count of rows where Won = TRUE, Closed = TRUE, and Churn Date is blank
Active ARR — sum of Amount where Won = TRUE, Closed = TRUE, and Churn Date is blank
Total Churned Logos — count of rows where Churn Date is not blank
All Time Churn — sum of Amount where Won = TRUE, Closed = TRUE, and Churn Date is not blank

Format the ARR and Churn values as currency ($). Bold all KPI labels, use a dark navy background with white text, and space the cards evenly across the row.
Build Live Calculation Tables
Create three helper tables that power your charts. Use array formulas so they refresh automatically as imported data updates.
In the same dashboard tab, create three helper/calculation tables starting at column Q (these can be off to the side and out of view):

Table 1 (Q:T) — 'Total Active Revenue': Use =UNIQUE(SORT(...)) to generate a dynamic list of all unique months from the import tab (sorted chronologically). Then use BYROW + SUMIFS to calculate monthly active revenue (Won = TRUE, Closed = TRUE, Churn Date blank) and a SCAN-based cumulative total. Add a Label column that auto-formats values as $K or $M.

Table 2 (V:Y) — 'Total Revenue Churn': Same month list, but SUMIFS where Churn Date is NOT blank. Cumulative total and Label column formatted the same way.

Table 3 (AA:AE) — 'New Business vs. Expansion': Same month list, but use BYCOL + BYROW + SUMIFS to split revenue by Opportunity Type ('New Business' and 'Expansion'), then sum them into a Total column and a Label column.
Create Live Revenue Charts
Build three charts that visualize your revenue trends. These will update automatically as your calculation tables refresh.
Using the three calculation tables, create the following charts on the dashboard tab:

Total Active Revenue — A column chart using the cumulative total column from Table 1 (Q:T), with months on the X-axis and dollar values on the Y-axis. Use dark green bars (#1a5c1a or similar). Display the Label column as data labels above each bar. Title: 'Total Active Revenue'.

Total Revenue Churn — A column chart using the cumulative churn column from Table 2 (V:Y), same layout. Use bright red bars. Display Label column as data labels. Title: 'Total Revenue Churn'.

Month-on-Month New and Expansion Revenue — A grouped/stacked column chart using Table 3 (AA:AE), with New Business and Expansion as two series (light blue and medium blue). Show the Total Label as data labels above each group. Title: 'Month-on-Month New and Expansion Revenue'.
Style and Polish the Dashboard
Apply final touches to make the dashboard professional and easy to read.
Apply final formatting to the dashboard tab:

Add a bold dark navy header banner at the top with 'Revenue Tracking Dashboard' in large white text
Add a 'Powered by Coefficient' logo/label in the top right corner
Hide gridlines on the dashboard tab
Give each KPI card a white background with a thin border, bold metric value in large font, and a smaller gray label above it
Size and position all three charts to fill the width of the sheet evenly, stacked vertically
Ensure the helper calculation tables (columns Q onward) are either hidden or far enough right to not appear in the main dashboard view. Ask me for this brand information if you don't know it.
More dashboards and templates
Hand-picked for revenue operations teams.
MRR Dashboard
Build a live SaaS metrics dashboard with MRR, churn rates, NRR, and logos in Coefficient. Track quarterly performance and pipeline health automatically.
Read the guide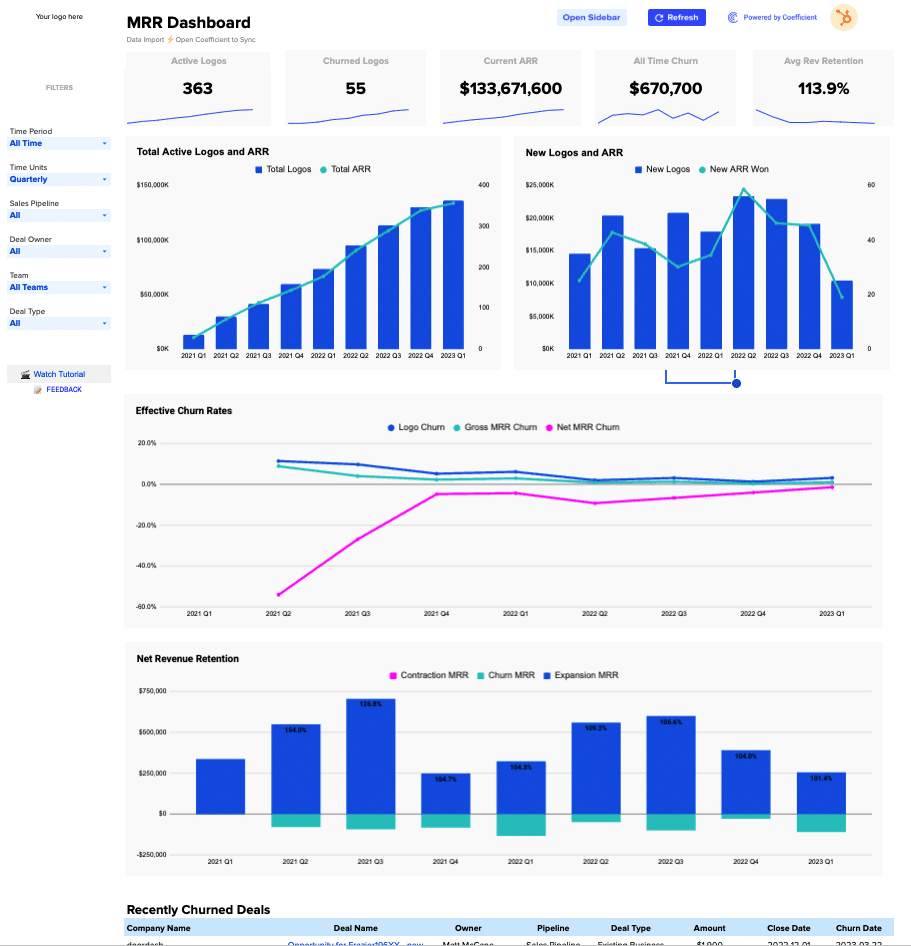
Outbound Sales Metrics
Build a live 12-week outbound sales metrics dashboard in Google Sheets with email, call, prospect, and deal data. Track performance by rep.
Read the guide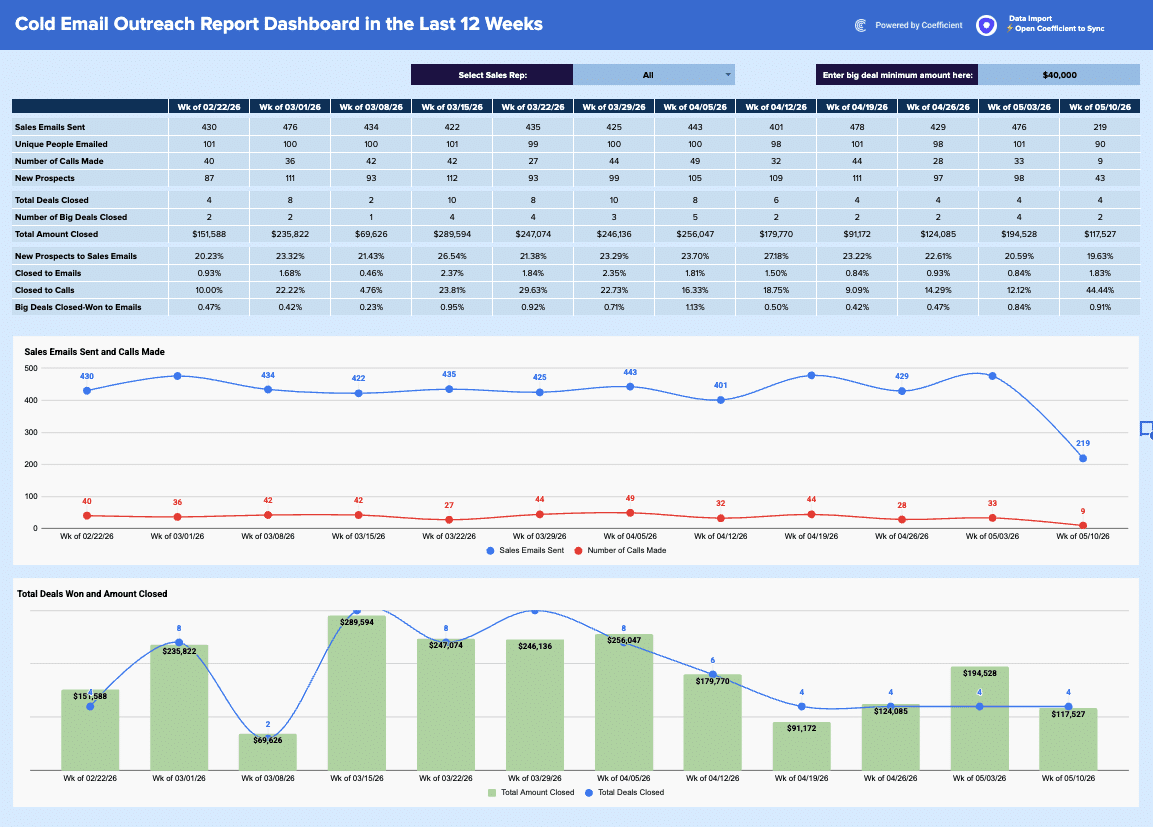
Salesforce Opportunity History Template
Automatically populate this dashboard with live data from your Salesforce Org. Connect in just a few clicks and start tracking every edit.
Launch template
Common questions about the revenue dashboard
How do I keep my revenue dashboard updated with the latest CRM data?
Can I get alerted when a revenue metric crosses a threshold?
What if my opportunity data lives in multiple systems?
How can I share my revenue dashboard with my team without letting them edit it?
Can I segment my revenue by deal stage or sales rep?
How is this revenue dashboard different from manually building one in Google Sheets?
Ready to try it in Coefficient?
Connect your data and start building in minutes.
