Build a Live MRR Dashboard in
Less Than 30 Minutes
Use this prompt guide to build a live MRR dashboard in your spreadsheet.
Get Started Free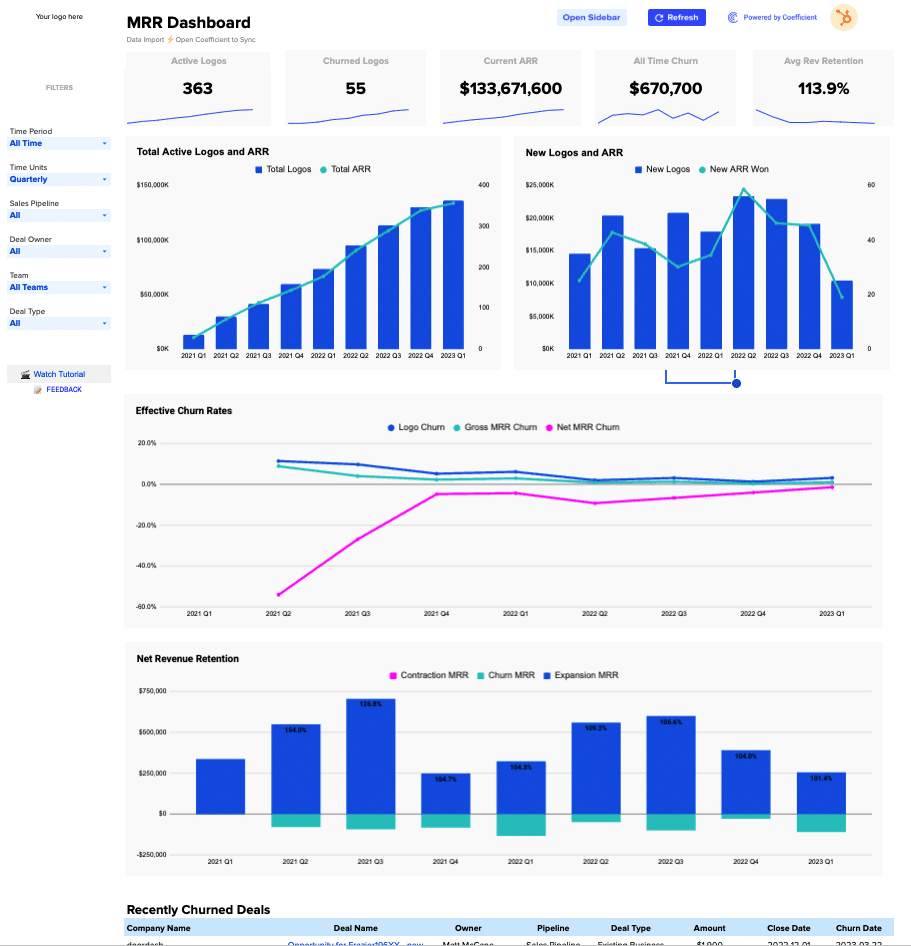
Before you start
Get set up in Coefficient for Google Sheets
- You'll need Coefficient AI to follow this guide. Coefficient is the AI assistant inside Google Sheets that turns prompts into live dashboards, reports, and analytics. Install it free to begin.
- Once you're in, click "Import from" on the Coefficient home screen and select your data source(s) to pull your data into the sheet. Not sure what data to import? Open the Coefficient Sheets Assistant — it can help you figure out where to start.
- Iterate on the prompts as you go. Tweak them to fit your team's workflow and make the dashboard your own. See more workflows built for revenue operations teams.
8 steps
Step-by-step prompts to build a live MRR dashboard
Set Up Your Data Import
Start by importing your deal data into a dedicated tab. You'll need columns for deal tracking, customer info, financial metrics, and timeline data so the dashboard can calculate everything downstream.
Create a tab called 'HubSpot Import' with the following columns: Deal ID, Deal Name, First Name, Last Name, Deal Owner Email, Amount (MRR), Create Date, Close Date, Deal Stage, Is Deal Closed, Is Closed Won, Pipeline, Deal Type, Company Name, Company ID, Company Domain, Number of Employees, Churn Date, Deal Owner, Sales Team, Deal Type (No Blanks), HubSpot Deal URL, Close Date Year/Quarter/Month/Week, Deal Name (Hyperlinked), Opp Size Bucket, Sales Pipeline, Existing vs New Customer.
Import your data into this tab so all downstream calculations can reference it.
Build a Settings & Config Tab
Create a centralized control hub where you can set company info, validate pipeline stages, map sales teams, and define filters that will drive all dashboard updates.
Create a Settings tab with: (1) a company config section for Company Domain, Logo URL, Fiscal Year Start, and Amount Metric (set to MRR); (2) a pipeline stages validation table that checks all stages exist in your imported data; (3) a sales team lookup table mapping each rep to Team 1–4; (4) a filter control panel with dropdowns for Time Period (All Time/This Month/This Quarter/This Year/Last Year), Sales Pipeline, Deal Owner, Team, and Deal Type. Make sure all dropdown logic references the imported data so filters stay current as new rows arrive.
Create KPI Summary Cards
Build 5 key metric cards at the top of your dashboard so leaders can see the most important numbers at a glance. Use formulas to calculate each KPI dynamically from the quarterly data.
At the top of the Dashboard tab, create 5 KPI summary cards with live formulas showing: (1) Active Logos = the MAX of Total Net Logos across all quarters; (2) Churned Logos = SUM of Churned Logos across all quarters; (3) Current ARR = MAX of Total ARR across all quarters; (4) All Time Churn = SUM of Churn MRR across all quarters; (5) Avg Net Revenue Retention = AVERAGE of Net Revenue Retention % across all quarters. Add a blue sparkline trend line below each card. Make sure all formulas reference the quarterly calculation table so the KPIs update automatically.
Build the Quarterly Calculation Engine
Create a hidden calculation table that aggregates your deal data into quarterly buckets. This is the engine that powers all your KPIs and charts, so it must use formulas that respect your filter selections.
In the Dashboard tab starting at column T, build a quarterly aggregation table for Q1 2021 through Q1 2023 using formulas that reference your imported data. For each quarter calculate: Total MRR Won (start), Total Churn (start), Total Net MRR (start), MRR Won this period, New MRR, MRR Upsells, Churn this period, Cancelled MRR, Downgraded MRR, Gross MRR Churn %, Net MRR Churn %, Net New MRR, Total Logos Won (start), Total Logos Churned (start), Total Net Logos (start), Churned Logos, New Logos, Logo Churn %, Total Logos, Avg MRR per Logo, Net Revenue Retention %, Expansion MRR, Churn MRR, Contraction MRR, Trailing 3-period Net MRR Growth, Trailing 3-period Logo Growth, Total ARR, New ARR Won. Filter all calculations by the selected Time Period, Sales Pipeline, Team, Deal Owner, and Deal Type from the Settings tab. Use formulas (not pasted values) so the table refreshes automatically when new data arrives.
Add Performance Charts
Visualize your quarterly trends with 4 charts that automatically update based on filter selections. Each chart tells a different part of your SaaS growth story.
Create 4 charts on the Dashboard tab, all connected to your quarterly calculation table: (1) Total Active Logos and ARR: combo chart with quarters on the X-axis, Total ARR as blue columns (left axis) and Total Logos as a blue line (right axis). (2) New Logos and ARR: combo chart with New ARR Won as blue columns and New Logos as a blue line, by quarter. (3) Effective Churn Rates: line chart showing Logo Churn %, Gross MRR Churn %, and Net MRR Churn % by quarter in 3 distinct colors (blue, pink, teal). (4) Net Revenue Retention: combo chart showing Contraction MRR and Churn MRR as stacked negative bars, Expansion MRR as positive bars, and Net Revenue Retention % as a labeled data point above each bar, by quarter. Filter all charts by the selected time period and filter panel selections.
Add a Recently Churned Deals Table
Surface the deals that are actually churning so your team can investigate patterns and follow up with at-risk customers.
Below the charts, create a 'Recently Churned Deals' table that pulls all deals from your imported data where Churn Date is not blank. Show columns: Company Name, Deal Name (hyperlinked to your data source), Owner, Pipeline, Deal Type, Amount, Close Date, Churn Date. Sort by Churn Date in descending order. Filter by the selected Sales Pipeline, Team, Deal Owner, and Deal Type from your filter panel. Use formulas so the table updates automatically as new churn data is imported.
Build Your Filter Panel
Create an interactive filter sidebar on the left so users can slice the dashboard by time, pipeline, owner, and team without touching formulas.
On the left side of the Dashboard tab, add a filter panel with dropdowns for: Time Period, Time Units (Monthly/Quarterly), Sales Pipeline, Deal Owner, All Teams, Date Type. Connect each dropdown to the Settings tab so all KPIs, charts, and tables update dynamically when a filter changes. Use formulas that reference these dropdowns so the entire dashboard refreshes in real time.
Design & Brand Your Dashboard
Add visual polish and company branding so the dashboard feels like a professional tool your team will actually use.
Add a banner and branding to the top of your Dashboard tab. Include my company logo, dashboard title, and any brand colors that match my company identity. Format the header so it's visually distinct from the KPI cards and charts below. Feel free to adjust fonts, colors, and spacing to match my company's design preferences. Ask me for this brand information if you don't know it.
More dashboards and templates
Hand-picked for revenue operations teams.
Outbound Sales Metrics
Build a live 12-week outbound sales metrics dashboard in Google Sheets with email, call, prospect, and deal data. Track performance by rep.
Read the guide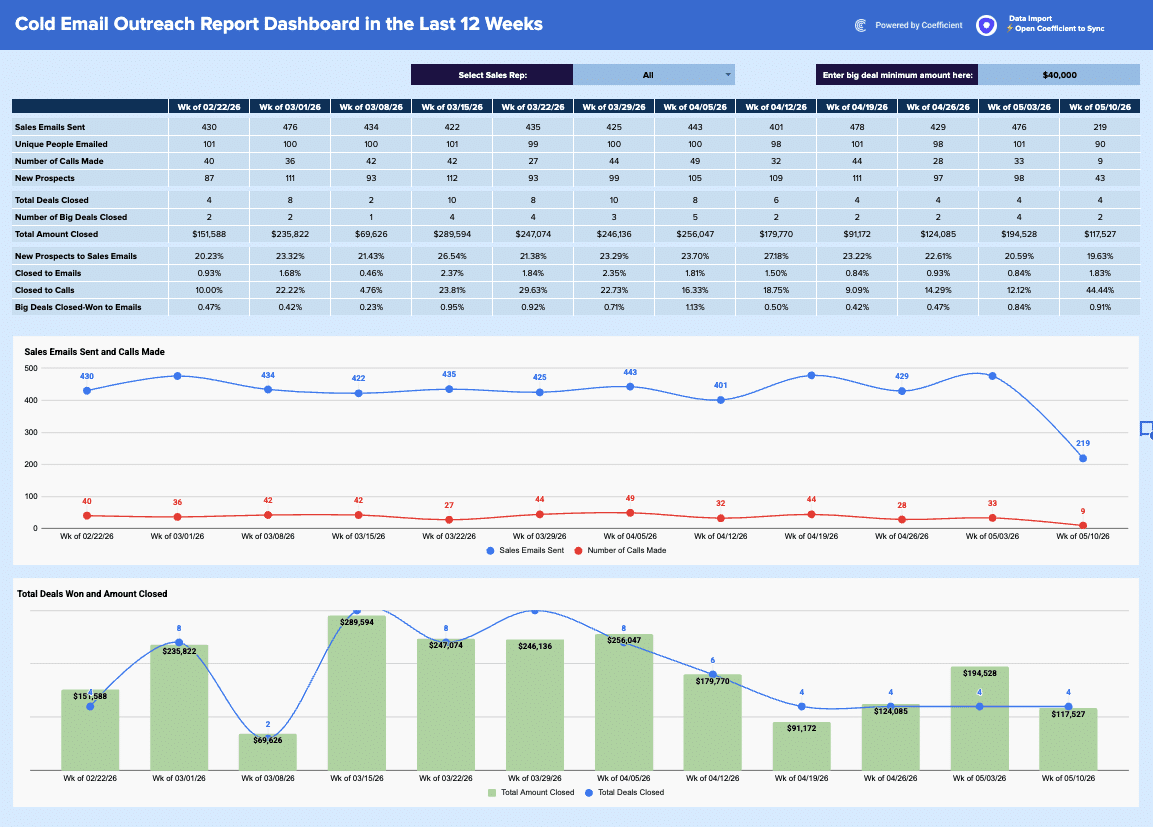
Regional Sales Report Template
Build a live regional sales report template in Google Sheets with Coefficient. Filter by country/stage, track KPIs, & visualize opportunity.
Read the guide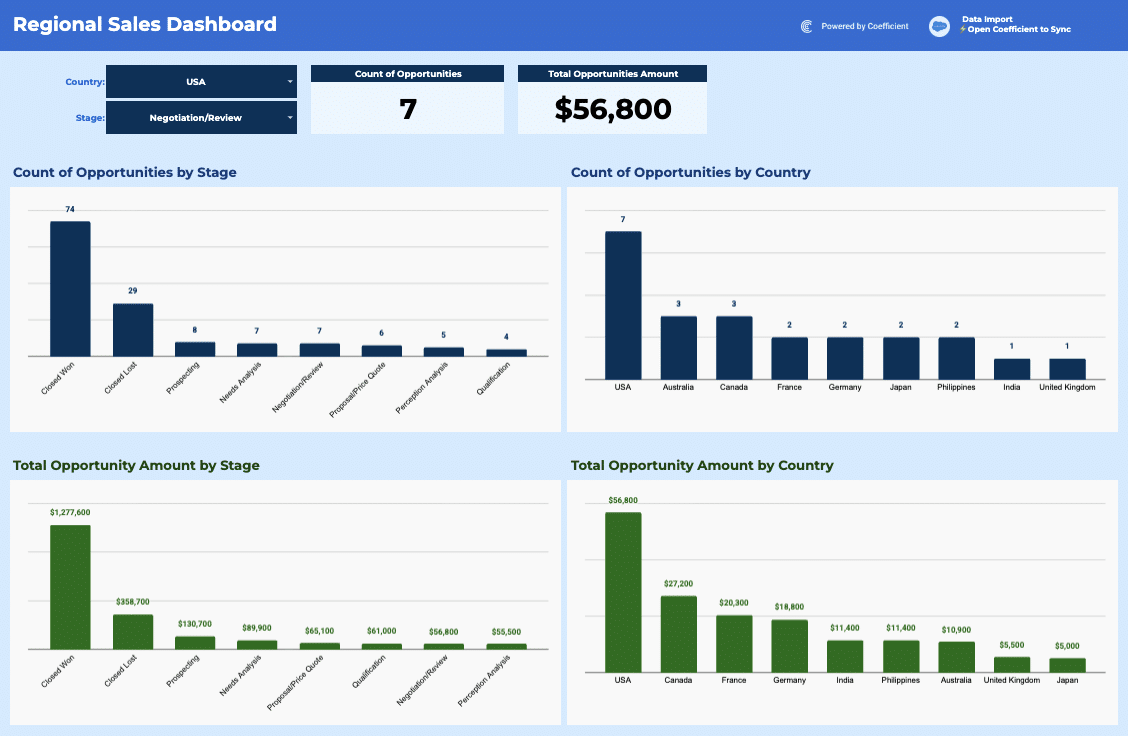
Free Sales Pipeline Template with Live CRM Data
Easily monitor how and where your sales teams are creating new pipeline. Connect Salesforce data in one click.
Launch template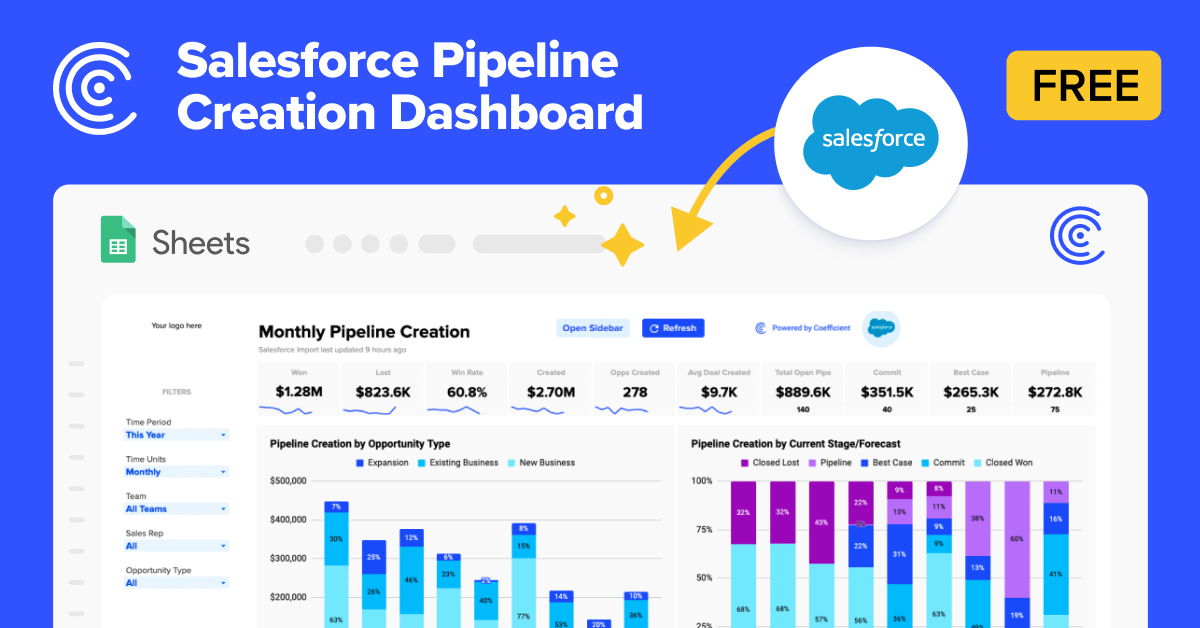
Common questions about the MRR dashboard
How do I set up my MRR dashboard to pull data directly from my CRM?
How can I track Active Logos and MRR across quarters in my dashboard?
What's the best way to monitor recently churned deals in my MRR dashboard?
How do I make my MRR dashboard interactive for my sales team?
Can I display multiple performance metrics on charts in my MRR dashboard?
How do I configure my dashboard to match my company's branding?
Ready to try it in Coefficient?
Connect your data and start building in minutes.
