Scenario analysis helps you answer “what if” questions about your business. What if revenue drops 20%? What if you hire three new employees? What if your biggest customer leaves?
The problem: QuickBooks doesn’t have built-in scenario analysis tools. You can run reports, but you can’t model different outcomes inside QBO.
This guide walks through how to build scenario analysis from your QuickBooks data—first the manual way, then a faster method using live data connections.
The challenge with scenario analysis in QuickBooks
QuickBooks tracks what happened. It shows your actual revenue, expenses, and profit. But it can’t show you what might happen under different conditions.
Most finance teams work around this by exporting data to Excel or Google Sheets. They build models with different assumptions and manually update the numbers each month.
This works until it doesn’t. The problems show up fast:
Stale data. Your model shows last month’s numbers while decisions need current figures.
Broken links. One wrong paste and your formulas stop working.
Version chaos. Three people have three different spreadsheets with three different answers.
Let’s start with the manual approach, then cover how to fix these issues.
Step-by-step guide: Manual scenario analysis from QuickBooks
Before you build scenarios, make sure your QuickBooks data is accurate. Reconcile your accounts and close out the period you want to analyze.
Step 1: Export your P&L report from QuickBooks
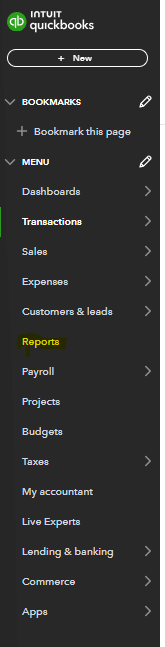
Navigate to Reports in the left menu. Find the Profit and Loss report and select your date range. Click Export in the top right and choose Excel or CSV.
Step 2: Set up your scenario framework in Excel or Google Sheets
Create a new spreadsheet with four columns: your line items, Base Case, Best Case, and Worst Case. Paste your P&L data into the Base Case column.
Step 3: Create variable inputs for key assumptions
Add an assumptions section at the top of your sheet. Include the variables that drive your scenarios:
Revenue growth rate
COGS percentage
Payroll increase
Operating expense change
Step 4: Build formulas to calculate each scenario
Link your scenario columns to the assumption inputs. For example, Best Case revenue might be =Base Case Revenue * (1 + Best Case Growth Rate).
Do this for each line item that changes across scenarios. Keep static costs the same unless you expect them to change.
Step 5: Update data manually each period
Here’s where the manual method breaks down. Every month, you need to:
Export fresh data from QuickBooks
Paste it into your spreadsheet (without breaking formulas)
Check that all calculations still work
Save a new version
This takes time. And every manual step is a chance for errors.
A faster way: Scenario analysis with live QuickBooks data
Coefficient connects your spreadsheet directly to QuickBooks. Your data stays current without manual exports. Build your scenario model once, and it updates automatically.
Here’s how to set it up.
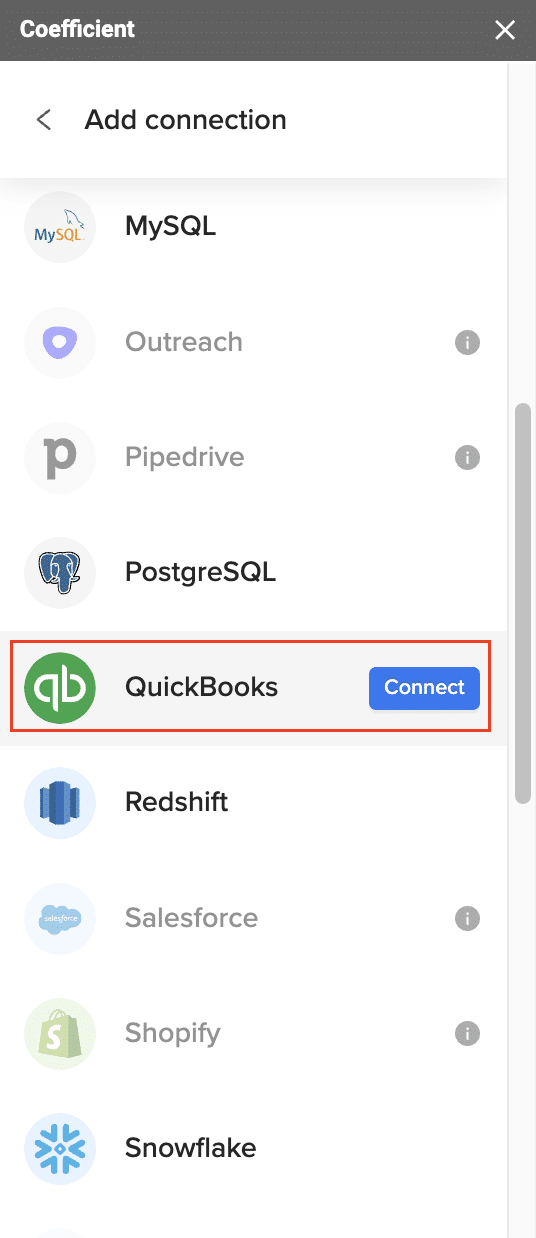
Step 1: Install Coefficient and connect QuickBooks
Get the Coefficient add-on for Google Sheets or Excel. Open Coefficient from the menu and select QuickBooks from the connector list.
Sign in with your QuickBooks credentials. Coefficient uses read-only access by default, so your QBO data stays safe.
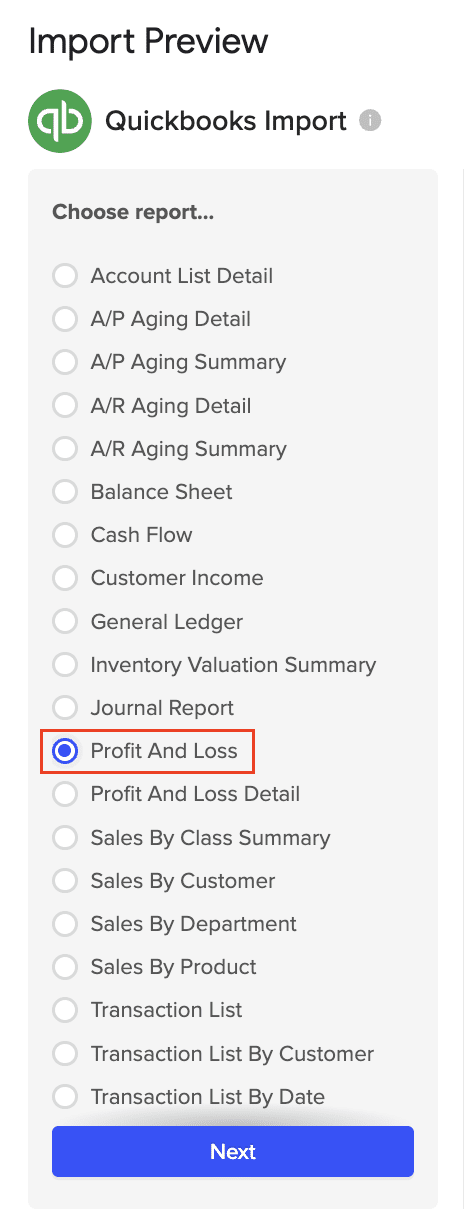
Step 2: Import your P&L or financial data
Click Import from QuickBooks and select QuickBooks Report. Choose Profit and Loss and set your date range.
Your P&L data appears in the spreadsheet. Unlike a manual export, this data can refresh on a schedule—hourly, daily, or weekly.
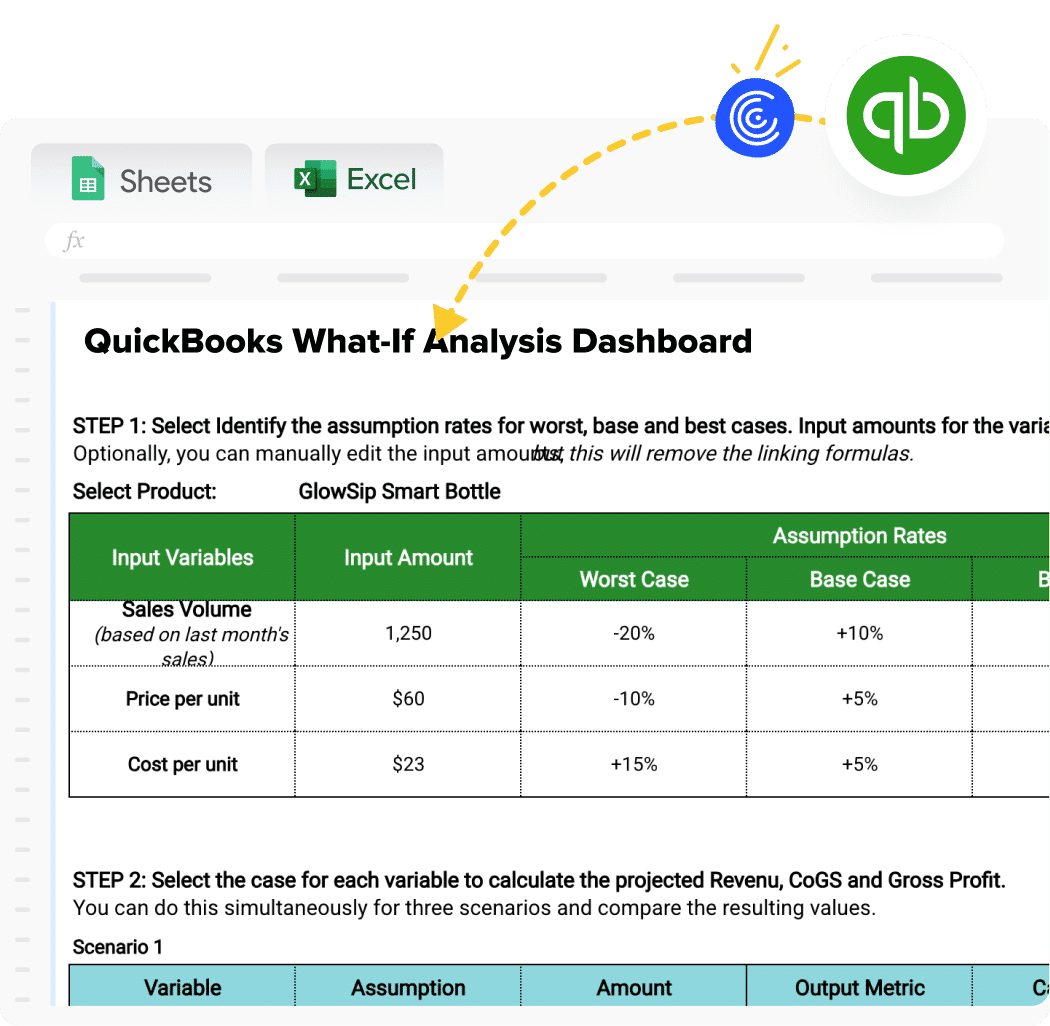
Step 3: Use the What-If Scenario Analysis template
Coefficient offers a pre-built template for scenario analysis. It connects to your QuickBooks data and includes:
Step 4: Adjust variables and see scenarios update in real-time
Change your assumptions and watch the scenarios recalculate. Increase revenue growth by 10%. Cut operating expenses by 5%. Add a new hire to payroll.
The model updates instantly. And because your base data refreshes from QuickBooks automatically, your scenarios always use current numbers.
Use cases for QuickBooks scenario analysis
Scenario analysis applies to most financial decisions. Common uses include:
Revenue forecasting. Model different growth rates to set realistic targets.
Expense planning. See how hiring, rent increases, or vendor changes affect profit.
Cash flow stress tests. Check if you can cover expenses if revenue drops 30%.
Investor presentations. Show best and worst case outcomes with supporting data.
Budget vs. actual. Compare planned scenarios against real results as the year progresses.
Build better financial models from QuickBooks
Scenario analysis turns your QuickBooks data into a planning tool. Instead of just tracking what happened, you can model what might happen next.
The manual export method works for simple, one-time analysis. But if you need ongoing scenario planning, the manual approach creates more work and more risk of errors.
Coefficient keeps your scenario models connected to live QuickBooks data. Build your assumptions once. Let the data refresh itself. Spend your time on analysis instead of data entry.
For many finance professionals, QuickBooks reports and month-end close can be a daunting process, especially when dealing with multiple data sources or QuickBooks files. At Thornton Capital, a single-family office managing a diverse investment portfolio, consolidating QuickBooks data from 16 different files was a major pain point.
Their manual process was not only time-consuming but also prone to errors, which impacted the credibility of their financial reports.
By implementing Coefficient, Thornton Capital was able to transform their financial reporting workflow, reducing their month-end close from 10 days to just 3.
Here’s a step-by-step guide on how Mike did it:
Step-by-step guide: Automating QuickBooks Reports & Month-end Close
Step 1: Build Standardized Templates
The first step was to create a series of standardized templates for their P&L and balance sheet reports. This allowed them to pull in data from their multiple QuickBooks files in a consistent and organized manner.
Step 2: Automate Data Pulls with Coefficient
Using Coefficient, they were able to automate the process of pulling data from their QuickBooks files into their QuickBooks reports template. This eliminated the need for manual data entry and reduced the risk of errors.
Step 3: Create Summarized Data Fields
Coefficient’s flexibility allowed them to build formulas and create summarized data fields that were tailored to their specific QuickBooks reports needs. This gave them a more comprehensive and insightful view of their financial performance.
Step 4: Refresh QuickBooks Reports Data in Real-Time
One of the biggest benefits of using Coefficient is the ability to refresh data in real-time. This means that any corrections or updates made in QuickBooks are instantly reflected in their reports, ensuring that they are always working with the most up-to-date information.
By following this workflow, Thornton Capital has not only saved a significant amount of time but also improved the accuracy and credibility of their financial reports. This has allowed them to make faster, more informed decisions and focus on what matters most: growing their business.
Ready to transform your QuickBooks reports process?
Thornton Capital’s story shows what’s possible when you eliminate manual data entry and embrace automation. They cut their month-end close by 70% – from 10 days to just 3 – while improving accuracy across 16 QuickBooks files.
The payoff? More time for strategic analysis. Greater confidence in their numbers. And a finance team that’s no longer buried in spreadsheets during close.
QuickBooks reporting doesn’t have to be painful. Whether you’re managing multiple entities like Thornton Capital or simply tired of manual data pulls, Coefficient can help you build a smarter, faster workflow.
Get started with Coefficient today and see how much time you can save on the QuickBooks reports you need for next month-end close.
QuickBooks Online, a popular accounting software from Intuit, is widely used by small businesses and freelancers for their business accounting needs. However, despite its user-friendly interface and basic functionality, many business owners encounter significant limitations when it comes to reporting. This article explores the top five cons of QuickBooks Online in reporting and offers potential solutions.
The Disadvantages of QuickBooks: Reporting Challenges
1. Customization Constraints in QuickBooks Online Reporting
Limited Built-in Custom Reports
While QBO provides standard reports, users often struggle to tailor them to specific business needs. This limitation becomes apparent when trying to create:
Department-specific reports
Granular details by product line
Custom financial reports
Many businesses resort to third-party apps or extensive manual work to achieve the level of customization they need. The lack of advanced reporting options in QuickBooks Online often leads to inefficiencies and frustration among entrepreneurs and bookkeepers.
Lack of Advanced Filtering and Grouping Options
QuickBooks Online restricts users’ ability to filter data using complex conditions. This limitation becomes evident when trying to:
Apply multi-layered filters (e.g., by date, location, and product category simultaneously)
Create advanced groupings beyond basic levels
Sort data using multiple criteria
These constraints can significantly impact the functionality of the accounting solution for businesses with complex reporting needs, especially when compared to the QuickBooks Desktop version.
2. File Size and Data Handling Limitations
Struggles with Large Datasets
QuickBooks Online reports often struggle to process large volumes of data efficiently. This limitation leads to:
System crashes when generating comprehensive reports
The need to break up reports into smaller chunks
Reduced date ranges to avoid performance issues
For businesses managing large volumes of transactions, this limitation causes significant inefficiencies in their accounting and bookkeeping processes, particularly for those dealing with ecommerce or multiple bank accounts.
Limited Date Ranges for Reports
QuickBooks Online frequently encounters issues when handling year-long or multi-year reports. Users experience:
System crashes or timeouts when attempting to generate long-term reports
The need to export data month by month for accurate reporting
Difficulties in analyzing long-term trends or year-over-year comparisons
These limitations are particularly problematic for businesses that need to analyze historical financial data or prepare comprehensive financial reports for profitability analysis.
3. Integration Limitations
Difficulty Syncing with External Tools
Users face challenges when trying to integrate QuickBooks Online with other platforms to generate comprehensive reports. This limitation affects:
Syncing with CRM systems
Integration with inventory management software
Consolidating data for project management and job costing
Businesses relying on multiple systems find QuickBooks Online’s limited integration capabilities to be a major bottleneck for creating consolidated reports that provide a holistic view of their operations.
Reliance on Manual Processes Due to Limited Integration
The lack of seamless integration often forces users to resort to manual data transfers or rely heavily on spreadsheets like Excel. This workaround:
Increases the chance of human error
Consumes valuable time and resources
Limits real-time reporting capabilities
Many businesses find themselves spending excessive time on manual data entry and consolidation due to these integration limitations, which can be particularly challenging for medium-sized businesses with complex workflows.
4. Performance Issues with Larger Data
Lagging and Sluggish Performance
As businesses scale and their data grows, QuickBooks Online’s performance often degrades. Users experience:
Slower response times when generating reports
Difficulties handling multiple users accessing the system simultaneously
Increased wait times for routine financial analysis
These performance issues can lead to significant inefficiencies, especially for businesses that rely on timely financial information for decision-making. The problem is often exacerbated for companies using the Simple Start or basic versions of QuickBooks Online.
Inconsistent Load Times for Reports
Users report varying load times when running complex or multi-year reports in QuickBooks Online. This inconsistency results in:
Unpredictable wait times for report generation
System crashes during report creation
Difficulties in scheduling regular financial reviews
These issues can disrupt workflows and make it challenging to maintain consistent reporting schedules, particularly for businesses that require frequent bank reconciliation or detailed expense tracking.
5. Inadequate Support for Complex Businesses
Multi-EntityReporting
QuickBooks Online struggles to provide sufficient support for businesses with multiple locations, divisions, or entities. This limitation affects:
Generating consolidated reports across multiple business units
Providing detailed breakdowns by division or location
Comparing performance across different segments of the business
Users face significant challenges when trying to create reports that offer a comprehensive view of their complex business structures, often requiring add-ons or separate instances of QuickBooks Online for each entity.
Lack of Granular Control over User Permissions for Reporting
QuickBooks Online‘s limited permissions framework complicates reporting for businesses with multiple users needing different levels of access. This results in:
Difficulties in restricting sensitive financial data
Challenges in delegating report creation tasks
Inability to customize user access based on roles or departments
These limitations can lead to security concerns and inefficiencies in report distribution and management, especially for businesses with a higher number of users or those requiring strict financial controls.
Addressing QuickBooks Online Reporting Challenges
While QuickBooks Online offers many advantages for small businesses and self-employed individuals, its reporting limitations can be significant for growing companies. To overcome these challenges, businesses can consider the following solutions:
Expand Report Customization Options
To overcome QuickBooks Online’s built-in limitations, businesses can leverage cloud-based solutions like Coefficient that integrate with spreadsheet software, enabling highly customizable reports. With Coefficient, users can:
Create tailored reports with advanced filtering and sorting options
Design custom layouts and formats without switching between tools
Incorporate data from multiple sources into a single report
Automate Data Syncing
Cloud-based solutions can automate the data import and export process, making it easier to handle large datasets without breaking reports into smaller chunks. This approach:
Eliminates the need for manual data entry or exports
Reduces the risk of errors associated with manual data handling
Allows for real-time data sync from multiple sources
Integrate QuickBooks Online with Other Business Tools
By using Coefficient to integrate QuickBooks Online with other platforms like HubSpot, businesses can gain a deeper understanding of their overall performance and financial health:
Combine financial data with sales and marketing metrics for comprehensive insights
Automate data syncing to ensure real-time accuracy across all reports
Create custom dashboards that blend data from multiple sources for holistic analysis
Evaluate Your Options: When to Consider Alternatives
For businesses that find QuickBooks Online’s limitations too restrictive, it may be worth exploring alternative accounting software options such as Xero or upgrading to QuickBooks Pro or Enterprise solutions. However, this decision should be weighed carefully, considering factors such as:
The learning curve associated with new software
Pricing plans and monthly subscription costs
Scalability and long-term business needs
Availability of customer support and resources
Overcoming QuickBooks Accounting Limitations: The Path Forward
While QuickBooks Online offers many benefits for small businesses, its reporting limitations can hinder growth and efficiency for some users. By understanding these challenges and exploring solutions like cloud-based integrations, businesses can significantly enhance their reporting capabilities.
To overcome these limitations and streamline your business accounting process, consider getting started with Coefficient. With Coefficient’s powerful integration and reporting tools, you can unlock the full potential of your QuickBooks Online data and gain deeper insights into your business performance.
QuickBooks Online (QBO) from Intuit is cloud-based accounting software trusted by business owners and CPAs. As a complete accounting system, QBO offers powerful job costing capabilities that help track expenses and revenue for each specific job.
Job costing is a bookkeeping method that assigns costs to specific jobs or work orders. This feature helps organizations analyze their finances at a granular level and understand what each particular job is costing them, leading to more informed business decisions.
Before Getting Started
To do job costing in QuickBooks Online, you’ll first need these key pieces of information in your QBO instance:
Labor costs – Track hours worked on a particular job to calculate wage expenses
Material costs – Record dollars spent on materials for each individual job
Overhead costs – Track expenses not directly tied to production, such as rent, insurance, and utilities
Step-by-Step Guide: Job Costing in QBO
Step 1: Enable Job Costing
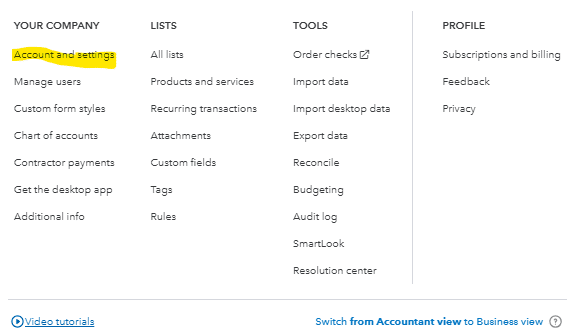
Within QBO, navigate to the gearbox in the top right of your screen to open settings.
Click the gearbox to see a drop-down menu. Select ‘Account and Settings’ under Your Company.
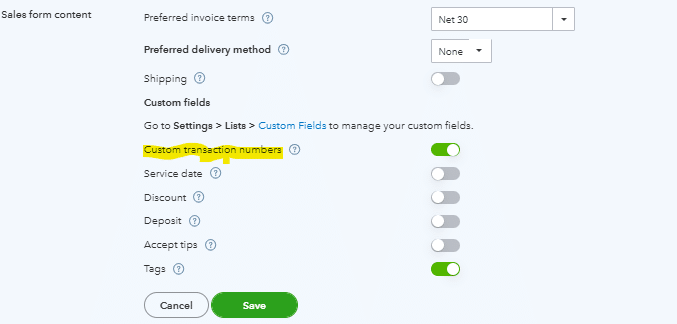
In the Sales section, turn on Custom Transaction Numbers.
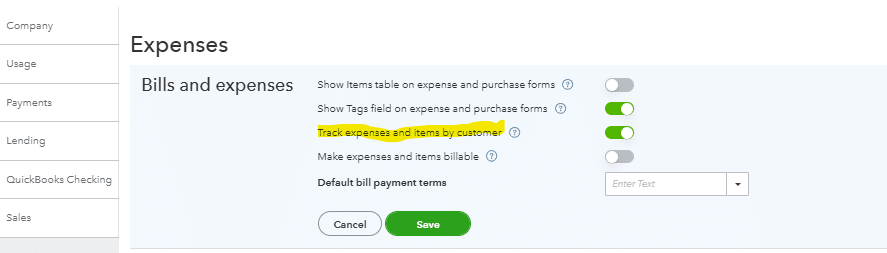
In the Expenses section, enable ‘Track expenses and items by customer’.
Step 2: Add Customers / Projects
In order to calculate job costs by customer and project, you will need to add the corresponding customer and project in QuickBooks.
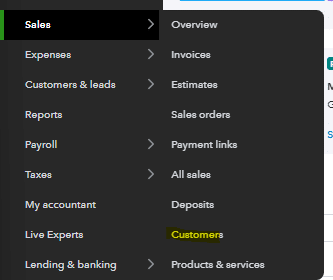
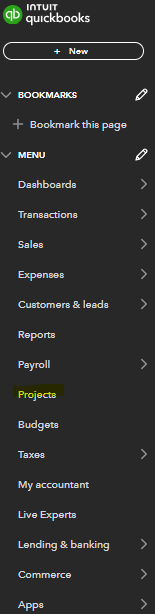
To add a customer, navigate to the sales section of the menu and select customers.
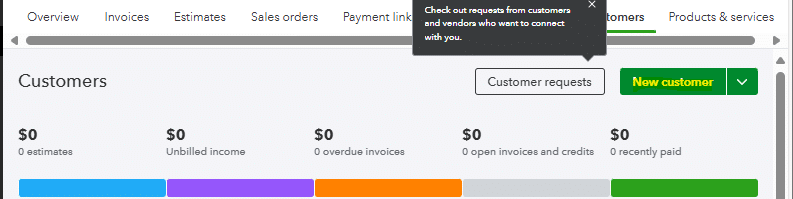
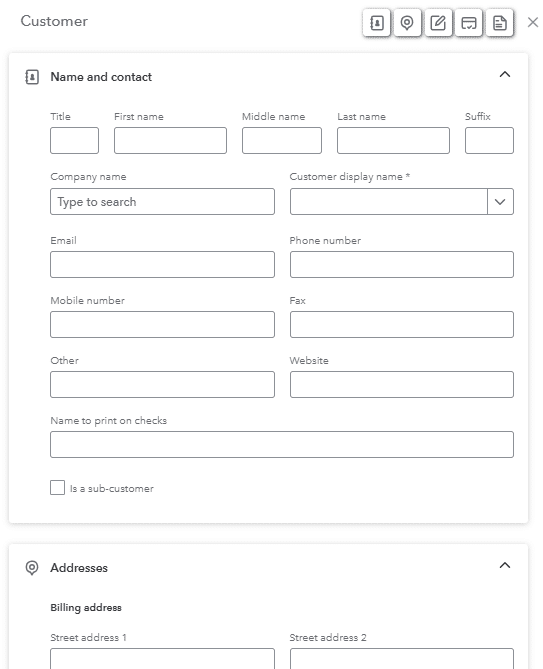
Select ‘New Customer’ in the top right corner.
You will then be prompted to fill in your customer’s information, including name and contact, address, payment method, tax information, etc.
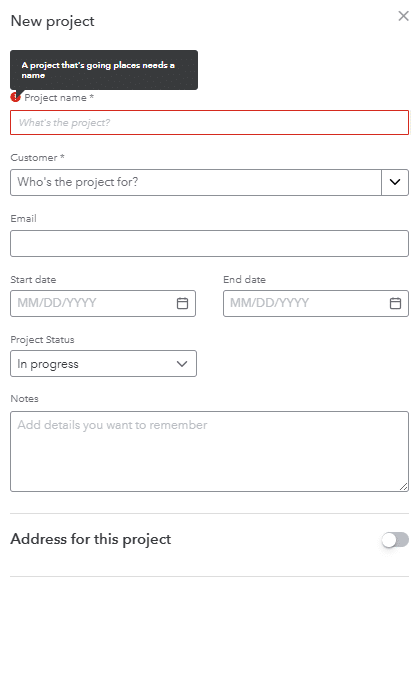
Once you’ve set up your customer, you can set-up your project. The project module is in the main drown-down menu.
Once you’ve selected the project you will be prompted to add the project name, customer that you just set-up, email, and then the start and end date.
Step 3: Add Job Estimate
Now that you’ve got your customer and project set-up you can create an estimate for the job. This will allow you to add quotes from vendors and track how well you are performing against that estimate as actual expenses come in for that job.
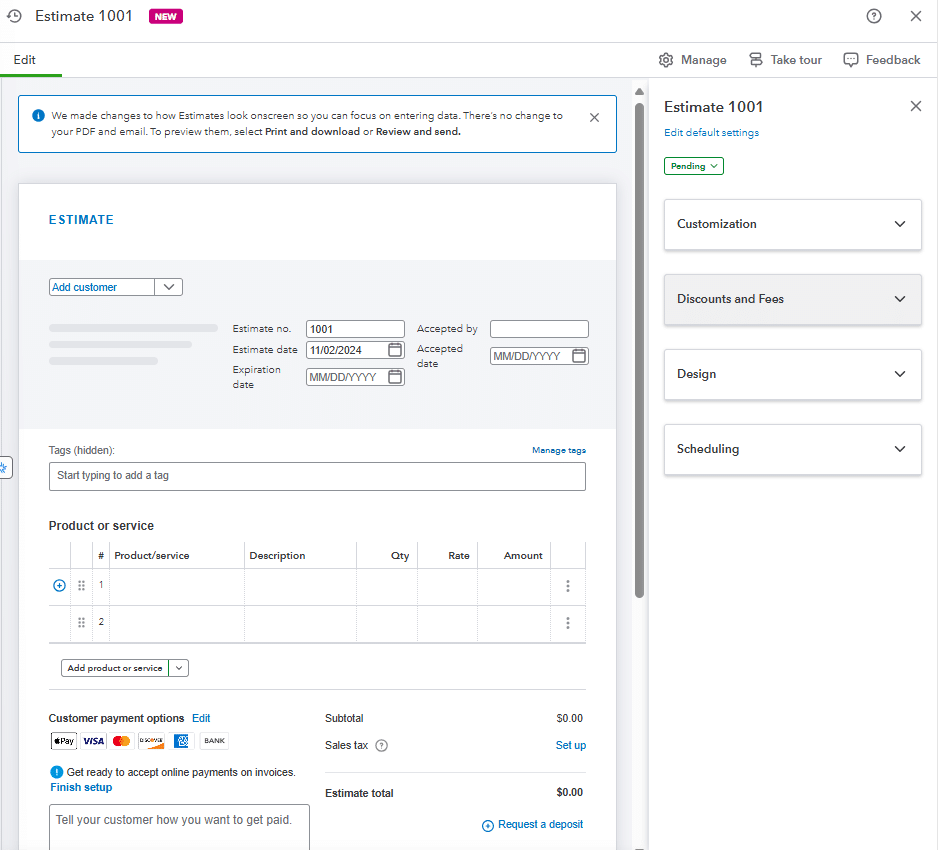
To add an estimate for the job you click the + New button on the QBO homepage and select estimate under the customers column.
Once in the estimate module you will have multiple fields to fill out including the customer, notes from the vendor, copy of a quote, dates, scheduling, payment options, and many more.
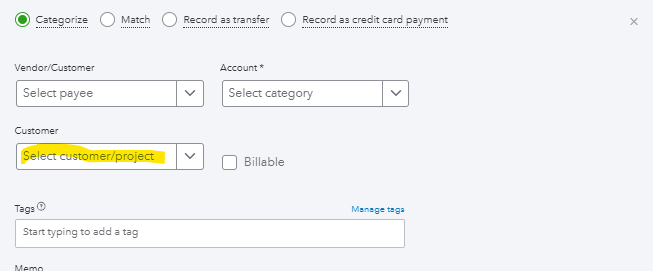
Once you’ve filled out the relevant information in the estimate module for your vendor and project, you can assign the estimate to the project/job previously created.
To do this you have to select the correct customer/project within the add customer dropdown on the estimates screen.
Once you’ve added the customer and project you can get more granular and provide additional details on what that vendor is doing as a part of this project. You can select if they are performing services or providing products & services, and add the corresponding cost associated with those goods or services.
Step 4: Vendor Invoicing
Now that your customer, particular job, and estimate are set-up in QBO, the invoicing process will provide actual costs and revenue information for accurate job costing. This is especially important for construction companies managing multiple construction projects.
On the vendor side, you receive invoices that you’ll match against the corresponding project. As you process credit card transactions or vendor invoices, assign the customer and project from steps 1 and 2 to each transaction.
This track expenses feature ensures each expense pulls through into your job costing reports and helps monitor project costs in real-time.
Step 5: Customer Invoicing
While processing vendor invoices, you’ll need to create invoices for your customers. The method and frequency depend on your contractual terms and agreed billing method.
For construction accounting, some clients prefer progressive billable hours tracking, while others want a single invoice upon project completion. Always refer to your agreement for proper invoicing terms.
To create an invoice from your estimated costs:
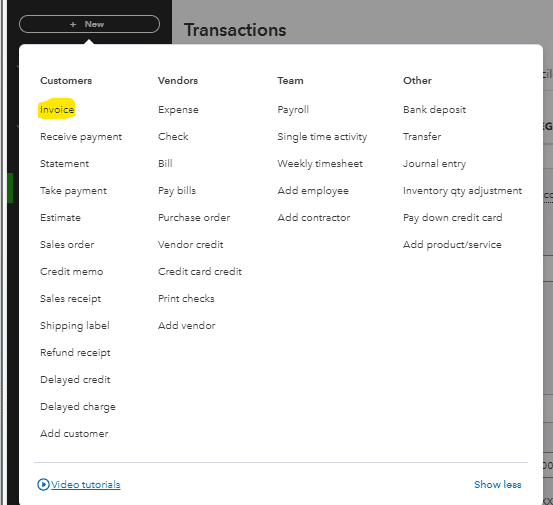
Select the + New button in the main menu
Choose invoice under the customers column
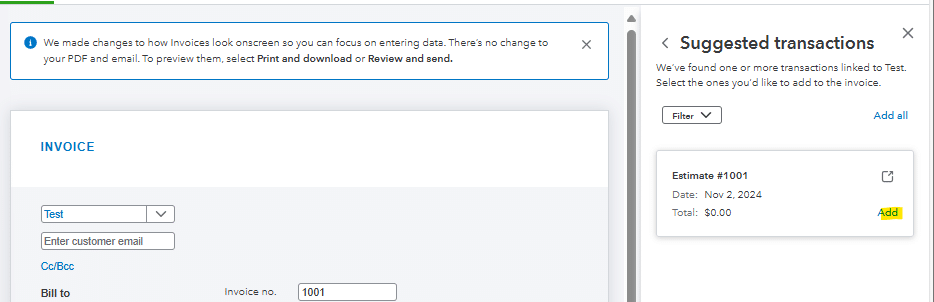
Import your previous estimate into the invoice module
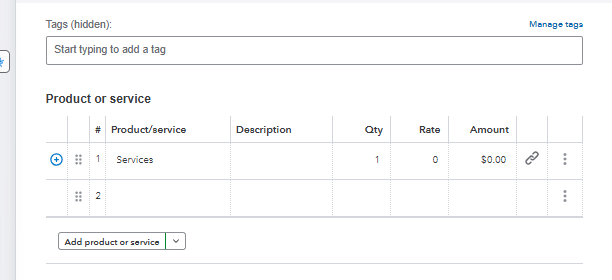
Add your products & services
Once you’ve added the estimate, you can adjust as needed. If scope changes occur, you may need to modify costs or add services before sending. This flexibility helps maintain accurate project profitability tracking.
Once you’ve added the estimate to your invoice you can make any necessary changes to the estimate you need to. If there was a change in scope from the initial estimate you may need to add incremental cost or an additional service/product to your invoice before sending it.
Step 6: Job Cost Reporting
As you invoice your customers and receive invoices from your vendors you will be able to do job costing reports out of QBO to see the profitability and profit margin of each particular job. In order to do this you will want to navigate to the reports section in QBO.
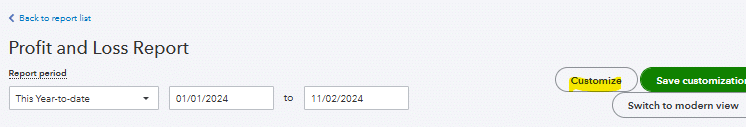
Once in the reports module you can select the financial reports and Profit and Loss Report and then select customize in the top right corner of the report.
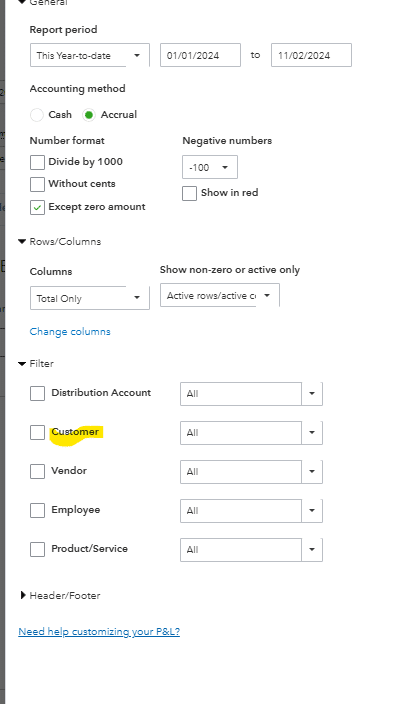
Once in the customize section you will be able to select that particular job and project within the customer filter. This will allow you to pull in all of the corresponding revenue and actual costs associated with that specific job during the time period you’ve specified.
After you’ve done this you are able to do job cost reporting that can be shared in real-time with stakeholders throughout your organization.
Use Cases for Job Costing in QuickBooks Online
Job costing provides valuable insights for business owners and CPAs using this accounting system. It helps:
Distribute real-time information to stakeholders tracking multiple projects
Track costs and revenue precisely, especially useful for construction business operations
Monitor project profitability across different customer segments
Integrate with timesheets for accurate labor costs tracking
Generate detailed job costing reports for better business decisions
Improve cash flow management and project planning
Support comprehensive construction accounting needs
Monitor actual costs against estimated costs
Maintain accurate profit margin calculations
Enable precise time tracking for billable hours
Improve Your Job Costing
Job costing is a very important tool for business planning and decision making. It can help an organization look at their financials at a more granular level to see which jobs, projects, or customers are more profitable than others. It can also help organizations estimate more accurately to improve pricing and reduce the variance in estimates to customers. By following this guide, you will be able to do job costing across all of the jobs/projects your organization performs.
Ready to take your data analysis to the next level?
Try Coefficient to seamlessly integrate your Excel with live data from various business systems, enabling real-time analysis and more advanced financial modeling.
Building effective dashboards in QuickBooks helps you track your business’s financial health and make better decisions. This comprehensive guide walks you through creating and customizing QuickBooks dashboards to get the insights you need.
Common QuickBooks Report Types
QuickBooks includes several built-in reports to help you track different aspects of your business. Here are the key report types and how to use them effectively:
Financial Reports
Profit & Loss (Income Statement)
Shows your revenue, costs, and expenses over time to help you understand profitability.
Key information:
Total income
Cost of goods sold
Operating expenses
Net profit/loss
Best for: Monthly, quarterly, and annual performance review
Balance Sheet
Provides a snapshot of your business assets, liabilities, and equity at a specific point in time.
Key information:
Current assets and liabilities
Long-term assets and debts
Owner’s equity
Account balances
Best for: Understanding your overall financial position
Statement of Cash Flows
Tracks how money moves in and out of your business through operating, investing, and financing activities.
Key information:
Operating cash flow
Investment spending
Financing activities
Net cash position
Best for: Cash flow management and planning
Sales & Customer Reports
Sales by Customer Summary
Shows total sales by customer over a specific period.
Key information:
Sales by customer
Payment history
Sales trends
Customer rankings
Best for: Customer relationship management and sales analysis
Accounts Receivable Aging
Groups unpaid customer invoices by how long they’ve been outstanding.
Key information:
Current amounts due
Overdue payments (30/60/90 days)
Collection priorities
Customer payment patterns
Best for: Managing collections and cash flow
Vendor & Purchasing Reports
Accounts Payable Aging
Lists unpaid bills grouped by due date.
Key information:
Current bills due
Overdue payments
Vendor payment history
Payment priorities
Best for: Managing vendor payments and cash outflow
Vendor Balance Summary
Shows amounts owed to each vendor and payment history.
Key information:
Total owed by vendor
Payment history
Outstanding bills
Vendor spending trends
Best for: Vendor relationship management
Inventory Reports
Inventory Valuation Summary
Shows the value and quantity of items in stock.
Key information:
Current stock levels
Item costs
Total inventory value
Stock movement
Best for: Inventory management and ordering
Stock Status
Lists items that need reordering based on set reorder points.
Key information:
Low stock alerts
Reorder points
Quantity on hand
Recent sales history
Best for: Purchase planning and stock management
Exporting Reports From QuickBooks
While QuickBooks offers robust reporting capabilities, many businesses find it beneficial to export their data for further analysis or custom reporting. Here’s how you can export reports from QuickBooks:
Different export options
QuickBooks allows you to export reports in various formats, including:
CSV (Comma-Separated Values): This format is ideal for importing data into spreadsheet applications or other data analysis tools.
XLSX (Excel Spreadsheet): This format is perfect for users who prefer working with Microsoft Excel for further analysis and visualization.
PDF: This format is perfect for sharing with stakeholders.
How to export a report from QuickBooks
Open the desired report in QuickBooks
Click on the “Export” button
Choose your preferred format (CSV or XLSX)
Select a location to save the exported file
While manual exports work well for occasional use, businesses that require frequent data updates or real-time reporting can benefit from using Coefficient.
Coefficient is a powerful tool that integrates seamlessly with QuickBooks, allowing for effortless and automated data exports to spreadsheets like Google Sheets and Microsoft Excel.
Key benefits of using Coefficient for QuickBooks exports:
Real-time data syncing
Automated scheduled refreshes
Custom data transformations
Advanced filtering and sorting capabilities
Watch this video to see how Coefficient simplifies the process of connecting QuickBooks to your spreadsheets:
How to Build a Custom Report in QuickBooks
Creating custom reports in QuickBooks allows you to tailor your financial data to your specific business needs. Here’s a step-by-step guide to building a custom report in QuickBooks:
Access the Reports Center:
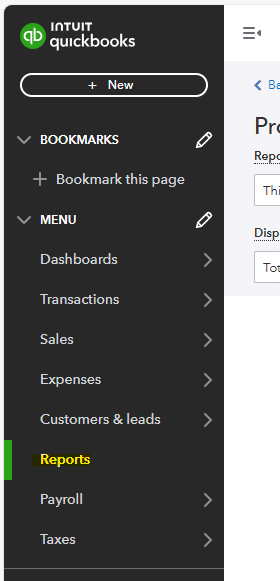
Go to the Reports menu in QuickBooks
Select “Custom Reports” or “Customization”
Choose a Report Type:
Select the base report type you want to customize (e.g., Profit and Loss, Balance Sheet, Sales by Customer)
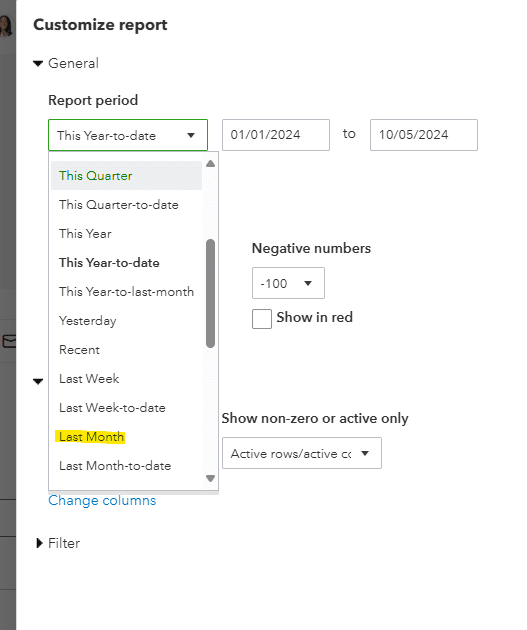
Set the Date Range:
Choose the time period for your report (e.g., This Month, Last Quarter, Custom Range)
Customize Columns:
Add or remove columns to display the specific data points you need
Rearrange columns by dragging and dropping
Apply Filters:
Use filters to focus on specific data subsets (e.g., particular customers, products, or accounts)
Adjust Display Settings:
Modify how data is grouped or sorted
Choose to show or hide subtotals and totals
Format the Report:
Customize fonts, colors, and header/footer information
Add your company logo if desired
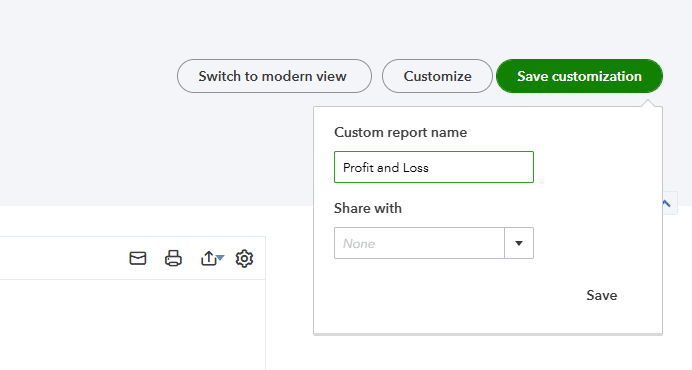
Save and Name Your Custom Report:
Give your report a descriptive name
Save it for future use
Schedule Regular Runs (optional):
Set up automatic generation and email delivery of your custom report
Building Advanced Reports & Dashboards in QuickBooks
Let’s walk through creating a cash flow projection report that combines accounts receivable, accounts payable, and historical payment patterns. This type of report helps predict your future cash position.
Creating a Cash Flow Projection Report
Step 1: Gather Required Base Reports
First, you’ll need to pull several reports to get the necessary data:
Accounts Receivable Aging Detail
Go to Reports > All Reports > Accounts Receivable
Select “A/R Aging Detail”
Customize date range to include all open invoices
Add columns: Due Date, Days Open
Sort by: Customer, then Due Date
Accounts Payable Aging Detail
Go to Reports > All Reports > Accounts Payable
Select “A/P Aging Detail”
Add all open bills
Add columns: Due Date, Terms
Sort by: Due Date
Payment History Report
Go to Reports > Custom Reports
Select “Transaction List by Customer”
Filter for: Received Payments only
Add columns: Original Invoice Date, Payment Date
Date Range: Last 6 months
Step 2: Calculate Historical Payment Patterns
Since QuickBooks doesn’t automatically calculate this, you’ll need to:
Export Payment History to Excel
Click Export on the Payment History report
Choose Excel format
In Excel, calculate:
Average days to pay per customer
Payment probability by aging bucket
Historical collection rate
Create Aging Buckets
Current
1-30 days
31-60 days
61-90 days
Over 90 days
Step 3: Project Expected Cash Inflows
For Each A/R Aging Bucket:
Export A/R Aging Detail to Excel
Sort by due date
Apply historical collection rates
Group by expected payment week
Sum projected collections
Adjust for Known Variations:
Large customer payments
Seasonal patterns
Payment term changes
Step 4: Project Expected Cash Outflows
From A/P Aging Report:
Export to Excel
Group bills by due date
Add known recurring payments:
Rent
Utilities
Payroll
Loan payments
Add Planned Expenditures:
Upcoming purchase orders
Scheduled payments
Contract renewals
Step 5: Combine into Final Projection
Since QuickBooks can’t combine these reports natively, you’ll need to:
Create a Weekly Projection Worksheet:
Week 1-12 columns
Sections for:
Beginning cash
Projected inflows
Projected outflows
Net cash position
Add Formula Calculations:
Weekly cash position
Cumulative position
Minimum cash threshold alerts
Update Source Reports:
Refresh all QuickBooks reports
Re-export to Excel
Update calculations
Adjust projections
Step 6: Maintain and Update
The projection requires regular maintenance:
Daily Updates:
Log into QuickBooks
Run fresh A/R and A/P reports
Export new data
Update Excel calculations
Weekly Reviews:
Compare projections to actuals
Adjust collection rates
Update payment patterns
Modify future projections
Simplifying Cash Flow Projections with Coefficient
While the above process gives you detailed cash flow projections, it requires significant manual work and constant updating. Many businesses connect QuickBooks directly to their spreadsheets for a more streamlined approach.
Using a tool like Coefficient, you can:
Pull live A/R and A/P data directly into your spreadsheet
Automating your QuickBooks reporting can save time, reduce errors, and provide timely insights. Let’s explore the automation features available in QuickBooks and how Coefficient can further enhance these capabilities.
QuickBooks automation features
QuickBooks offers several built-in automation features for reporting:
Scheduled Reports: Set up recurring reports to be automatically generated and emailed to specified recipients at regular intervals.
Memorized Reports: Save customized report settings for quick access and consistent formatting.
Bank Feeds: Automatically import and categorize transactions from linked bank accounts and credit cards.
Rules: Create rules to automatically categorize recurring transactions based on specific criteria.
Recurring Transactions: Set up automatic creation of regular invoices, bills, or journal entries.
While these features provide a good starting point for automation, many businesses find they need more advanced capabilities to fully streamline their reporting processes.
Real-time data syncing and scheduled refreshes
One of the most powerful features of Coefficient is its ability to provide real-time data syncing between QuickBooks and your spreadsheets. This means your reports and dashboards are always showing the most current financial data.
Additionally, Coefficient allows you to set up scheduled refreshes, ensuring your reports are updated at the frequency you need:
Hourly updates for time-sensitive metrics
Daily refreshes for regular reporting
Weekly or monthly updates for long-term trend analysis
By leveraging these automation capabilities, you can:
Reduce manual data entry and associated errors
Save time on repetitive reporting tasks
Ensure consistent and timely reporting across your organization
Focus on analysis and decision-making rather than data preparation
Automating your QuickBooks reporting with Coefficient not only saves time but also provides more accurate and timely insights, enabling you to make data-driven decisions with confidence in 2026 and beyond.
Limitations of QuickBooks Reporting and How to Overcome Them
While QuickBooks serves as a fundamental accounting tool for many businesses, its reporting capabilities often fall short for growing organizations. Understanding these limitations is crucial for businesses looking to scale their financial operations effectively and make data-driven decisions.
Customization and Control Constraints
QuickBooks’ approach to report customization presents significant challenges for businesses requiring detailed financial analysis. While the platform offers standard reports, users frequently struggle to adapt these templates to their specific needs.
Creating department-specific reports or drilling down to granular product line details often requires complex workarounds. Most businesses end up spending hours manually modifying reports to get the insights they need.
The platform’s rigid structure makes it particularly difficult to implement multi-layered filters. Imagine trying to analyze sales data across different locations, product categories, and date ranges simultaneously—a task that should be simple but requires extensive manual work in QuickBooks.
Data Management and Performance Issues
As businesses grow and accumulate more financial data, QuickBooks’ performance limitations become increasingly apparent. The system struggles notably with large datasets, often resulting in sluggish performance or complete system crashes when generating comprehensive reports.
This challenge becomes particularly acute when attempting to analyze long-term financial trends. Many businesses find themselves breaking down their reporting into smaller time chunks just to get the system to work.
Modern businesses rely on multiple systems to run their operations efficiently. However, QuickBooks’ limited integration capabilities create significant obstacles in generating comprehensive financial insights.
Connecting QuickBooks with CRM systems, inventory management software, or project management tools often requires manual intervention. This limitation forces many organizations to maintain separate spreadsheets and manually transfer data between systems.
The result? Teams spend countless hours on data entry and consolidation. What should be a seamless flow of information becomes a time-consuming exercise in data management.
Complex Business Structure Support
For businesses with multiple entities or locations, QuickBooks’ reporting capabilities prove especially restrictive. Creating consolidated reports across different business units often requires maintaining separate QuickBooks instances.
Consider a business with three locations trying to understand their overall performance. Instead of pulling a single comprehensive report, they need to export data from each location individually and manually combine it.
Permission settings add another layer of complexity. QuickBooks offers limited options for controlling who can access and modify reports, making it difficult to:
Restrict access to sensitive financial data
Delegate report creation tasks
Customize user permissions based on roles
Manage team collaboration effectively
Free QuickBooks Reporting Dashboards
To help businesses leverage their QuickBooks data more effectively, Coefficient offers a range of free, ready-to-use reporting templates and dashboards. These templates are designed to work seamlessly with QuickBooks data and can be easily customized to suit your specific business needs.
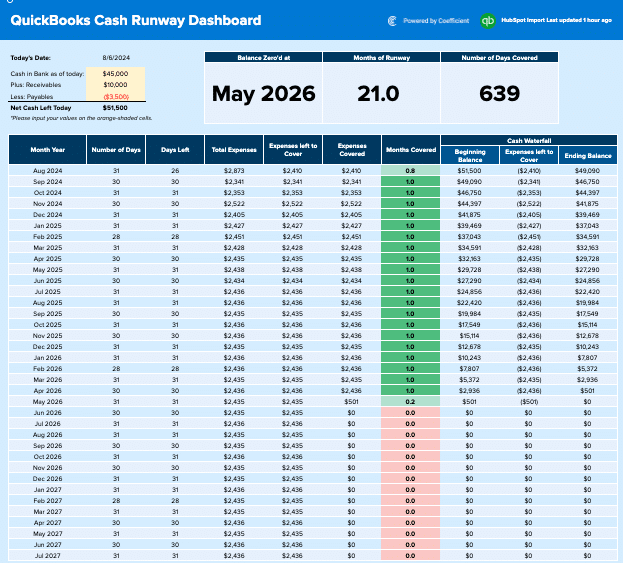
#1 Cash Runway Template
The Cash Runway Template is an essential tool for businesses focused on cash flow management and forecasting. This report provides a clear picture of how long your current cash reserves will last based on your current burn rate and projected income.
Use case: Cash flow management and forecasting
Key metrics tracked:
Current cash balance
Monthly burn rate
Projected income
Estimated runway (in months)
While QuickBooks doesn’t provide a built-in Cash Runway Template, you can create one using the data exported from QuickBooks. Tools like Coefficient offer pre-built templates that can be easily connected to your QuickBooks data for real-time cash runway analysis.
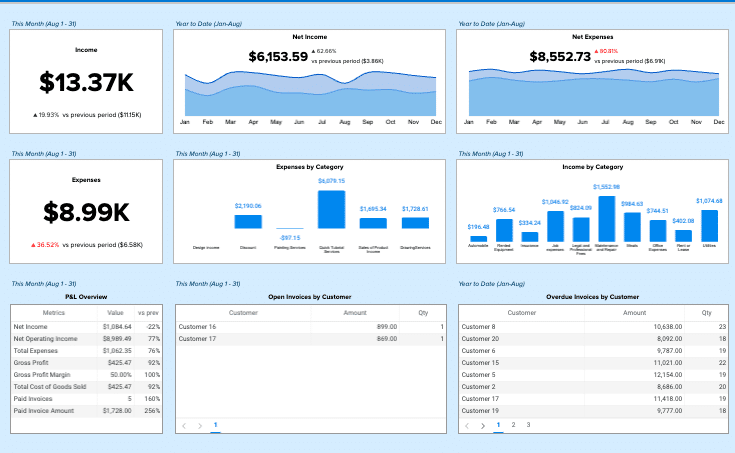
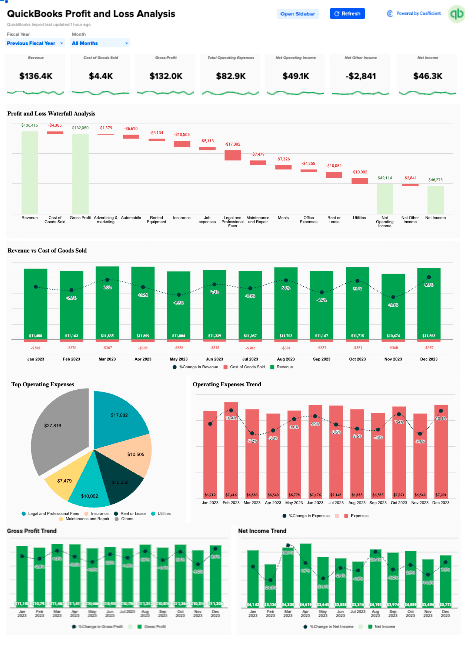
The Profit and Loss (P&L) Dashboard is a cornerstone of financial performance analysis in QuickBooks. It provides a comprehensive overview of your company’s revenues, costs, and expenses over a specified period.
Use case: Financial performance analysis
Key metrics tracked:
Total revenue
Cost of goods sold (COGS)
Gross profit
Operating expenses
Net income
QuickBooks offers a built-in P&L Dashboard, which can be customized to suit your specific needs. However, for more advanced analysis and visualization, many businesses opt to export this data and create custom dashboards using tools like Coefficient.
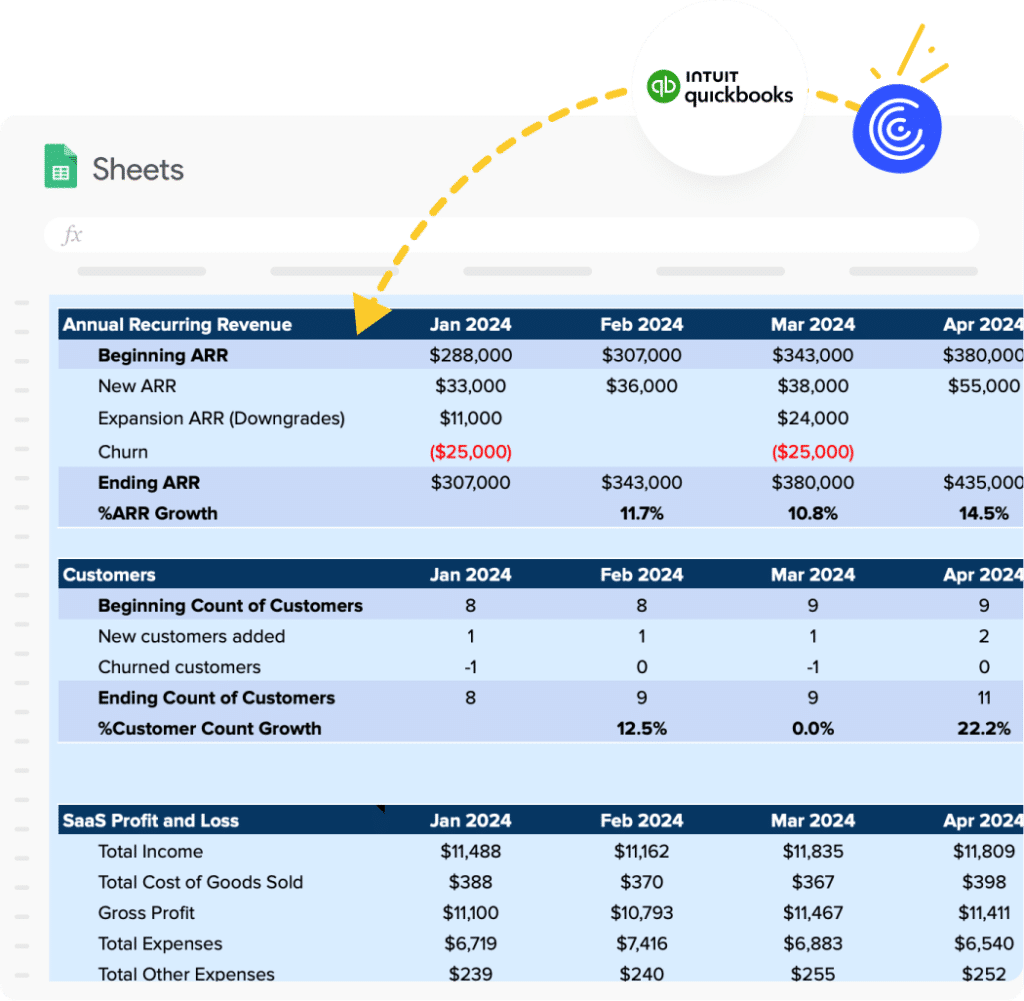
For Software as a Service (SaaS) companies, a specialized P&L template is crucial for accurately tracking and analyzing financial performance. The SaaS P&L Template incorporates metrics specific to the SaaS business model.
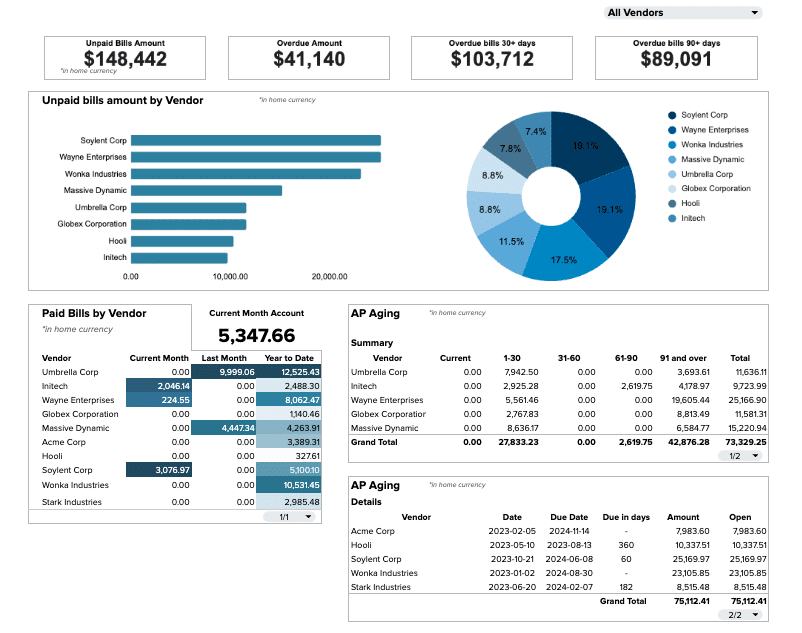
Effective vendor payment management is crucial for maintaining healthy business relationships and cash flow. The Accounts Payable Template helps you track and manage your outstanding bills and payments to vendors.
Use case: Vendor payment management
Key metrics tracked:
Total outstanding payables
Payables aging
Upcoming due dates
Payment history
Coefficient offers a ready-to-use QuickBooks Accounts Payable Dashboard that you can find here. This template provides a comprehensive view of your accounts payable, helping you stay on top of your vendor payments.
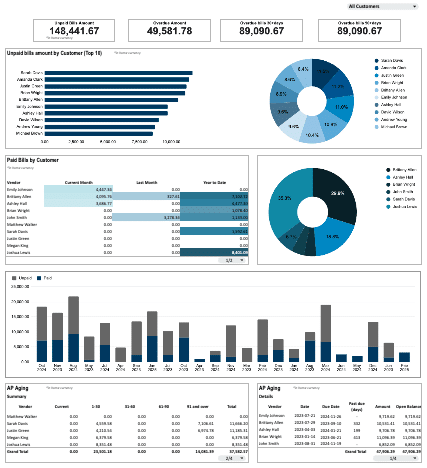
#5 QuickBooks Accounts Receivable Dashboard
Tracking customer payments is essential for maintaining a healthy cash flow. The Accounts Receivable Dashboard helps you monitor outstanding invoices and customer payment patterns.
Use case: Customer payment tracking
Key metrics tracked:
Total outstanding receivables
Receivables aging
Average days to pay
Collection rate
While QuickBooks provides basic accounts receivable reports, many businesses benefit from creating more detailed dashboards using tools like Coefficient, which allow for deeper analysis and customization.
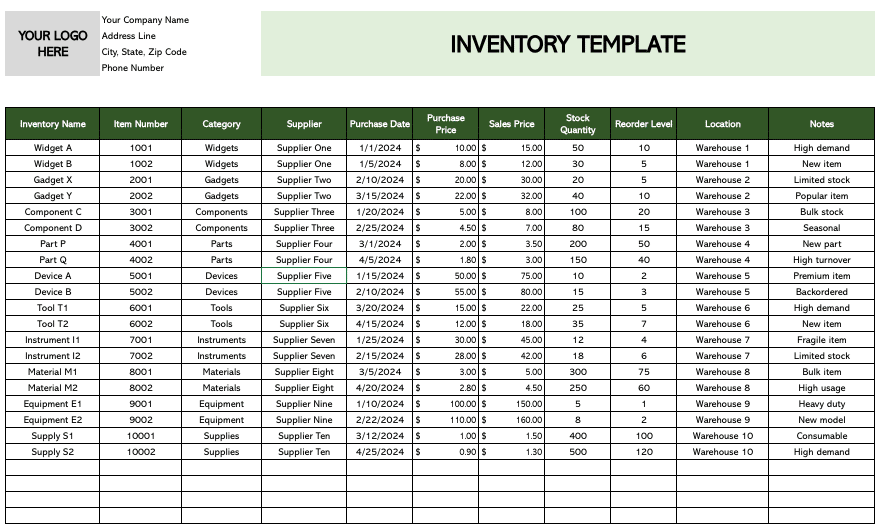
For businesses dealing with physical products, effective inventory management is crucial. The Inventory Management Dashboard helps you optimize your stock levels and prevent stockouts or overstocking.
Use case: Inventory optimization
Key metrics tracked:
Current stock levels
Reorder points
Turnover rate
Days of inventory on hand
QuickBooks offers basic inventory reports, but for more advanced inventory management, consider exporting your data to create custom dashboards that provide deeper insights into your inventory performance.
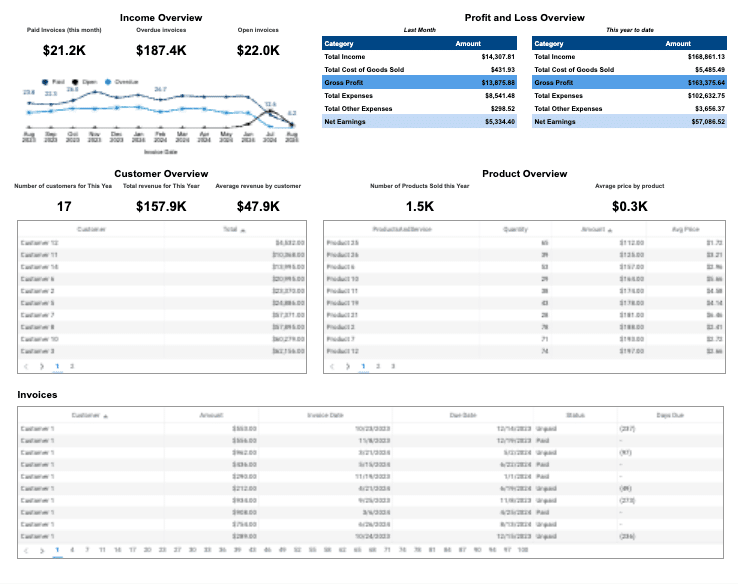
A detailed revenue dashboard is essential for analyzing your income streams and forecasting future revenue. The QBO Revenue Dashboard provides a comprehensive view of your business’s revenue performance.
Use case: Revenue analysis and forecasting
Key metrics tracked:
Total revenue
Revenue by product/service
Revenue growth rate
Average revenue per customer
You can access a free, ready-to-use QBO Revenue Dashboard template at Coefficient’s QBO Revenue Dashboard. This template connects directly to your QuickBooks Online data, providing real-time insights into your revenue performance.
#8 – QuickBooks Cashflow Template
Cash flow management is critical for business survival and growth. The QuickBooks Cashflow Template helps you track and forecast your cash inflows and outflows.
Use case: Cash flow management
Key metrics tracked:
Operating cash flow
Investing cash flow
Financing cash flow
Net cash flow
Coefficient offers a free QuickBooks Cashflow Template that you can find here. This template provides a clear view of your cash flow situation, helping you make informed financial decisions.
Take Your QuickBooks Reporting to the Next Level
Creating effective reports in QuickBooks requires understanding both its capabilities and limitations. While QuickBooks provides essential financial reporting tools, growing businesses often need more flexibility and automation to get the insights they need.
The right tools can transform how you handle financial reporting, turning hours of manual work into automated, real-time insights. By combining QuickBooks’ robust financial data with modern reporting solutions, you can build reports that actually drive business decisions.
Ready to take your QuickBooks reporting to the next level? Get started with Coefficient today and unlock the full potential of your financial data.
FAQs
Can you create a dashboard in QuickBooks?
Yes, you can create dashboards in QuickBooks. While QuickBooks offers some built-in dashboard features, you can create more customized and flexible dashboards by exporting your QuickBooks data to tools like Coefficient, which allows you to build advanced dashboards in familiar spreadsheet environments.
How do I customize my QuickBooks Online dashboard?
To customize your QuickBooks Online dashboard, go to the dashboard and click on the “Customize” button. From there, you can add, remove, or rearrange widgets to suit your needs. For more advanced customization, consider using Coefficient to create fully customized dashboards based on your QuickBooks data.
What is the purpose of the QuickBooks dashboard?
The QuickBooks dashboard serves as an all-in-one tool for viewing and controlling your business finances in real-time. It provides an overview of key financial metrics, helps you track incoming and outgoing payments, and allows you to perform core business actions quickly and easily. With Coefficient, you can enhance this functionality by creating more detailed and customized dashboards.
What data is displayed on the dashboard of QuickBooks Online?
The QuickBooks Online dashboard typically displays information about invoices, sales, expenses, and a basic profit and loss graph. It also shows banking information for connected accounts. However, by using Coefficient with QuickBooks, you can create dashboards that display any data from your QuickBooks account, providing more comprehensive and tailored insights for your business.
Quickbooks Online (QBO) from Intuit is cloud accounting software used by many business owners. This functionality enables automated email reports through your preferred email service, whether you’re using QBO, Quickbooks Desktop, Quickbooks Desktop Pro, or Quickbooks Online Advanced.
P&L reports can be sent automatically through your chosen email provider (Gmail, Outlook, or webmail) to relevant stakeholders. These reports help businesses measure and analyze profitability during a specific time period.
Let’s get started!
Step-by-Step Guide: P&L Report in QBO
In order to send P&L reports automatically in QBO, you first want to make sure that your P&L is accurate and ready to be set up as a memorized report. This includes:
Reconciling accounts – This will ensure that the information in each revenue / expense account is accurate and up-to-date before the report is sent out.
Format P&L – Determine if you want to make any format changes to your P&L report before setting up the P&L report to automatically send.
Determine frequency – Figure out how often you would like to set email schedule. The most common choice would be to send it out monthly.
Gather stakeholder information – Make sure that you have up-to-date email account information and send forms settings for recipients.
.Step-by-Step Guide:
Step 1: Navigate to the Reports Section in QBO
Within QBO navigate to the reports section in the menu section. This process works across platforms, including Mac and Quickbooks Enterprise systems. Use the drop-down menu to access report options.
Step 2: Add Profit and Loss Report to Custom Reports
Once you’ve navigated to the Reports section, you’ll need to add the P&L to your custom reports. To do this, select the 3 dots next to the Profit and Loss report and select Customize. Use the checkbox options to configure initial settings.
Step 3: Select the Report Period for P&L Report
Once you’ve selected Customize, you will be prompted to select email preferences and report period. In this example, we are going to pull the last month for our report and then click to run that report. Select OK to confirm your choices.
Step 4: Customize Report
After creating the P&L as a custom report in QBO, you will have the option to make changes. You can adjust any accounts pulling in and formatting within the report to be more meaningful and clearly articulate the results to your stakeholders.
Configure your preferred email provider and default email settings. Once you’ve made any relevant changes, save the customization and name your report.
Step 5: Schedule Reports
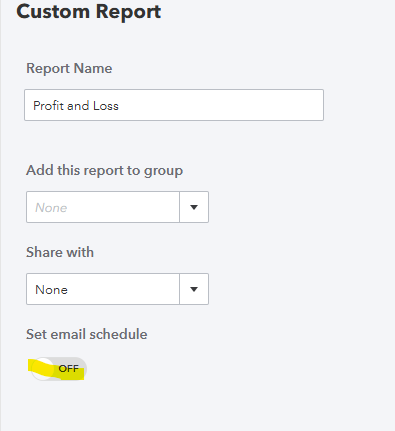
Once you’ve created the custom reports, navigate back to the reports section. Select the relevant report that you want to schedule and click the edit menu.
Once you’ve selected Edit, you can navigate to the set email schedule toggle and switch it from off to on. A pop-up will appear with email options.
Once you’ve toggled to yes, you will be prompted to set the recurrence and message that is sent with your report. This setup enhances your bookkeeping efficiency and ensures consistent reporting.
You will have the option to select the day that you would like to send the report to your stakeholder(s). You will want to select a date after you have reconciled and ensured the accuracy of the data you are sending out.
Once you’ve selected the options for your scheduled reports, hit save and close in the bottom right hand of the screen and your report will automatically send out every month.
Use Cases for Sending P&L Report Automatically
Automatically sending a P&L report can be useful for businesses in order to:
Distribute useful information on a regular basis to stakeholders.
Automate the distribution of reports to eliminate manual intervention.
Get stakeholders information in a timely manner to make decisions with the most recent information.
Improve Your P&L Reporting out of QuickBooks
P&L reports along with other standard QBO reports are useful tools for business planning and decision making. It can help stakeholders understand their financials and improve the businesses profitability By following this guide, you will be able to automatically send those reports throughout your organization.
Ready to take your data analysis to the next level?
Try Coefficient to seamlessly integrate your Excel with live data from various business systems, enabling real-time analysis and more advanced financial modeling.
As a trusted accounting software for small business owners, QuickBooks Online (QBO) offers powerful financial reporting capabilities through its company snapshot feature.
This tutorial will guide you through sharing these vital financial statements and performance metrics with stakeholders, helping you leverage custom reports for better business insights.
Let’s get started!
Step-by-Step Guide: Share Financial Reports in QBO
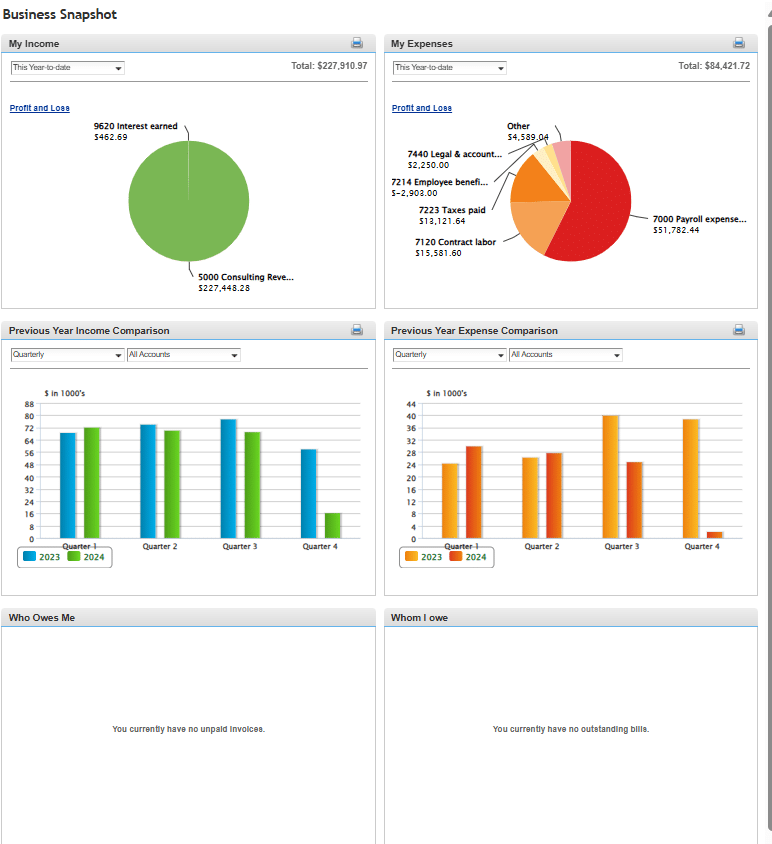
Several company snapshot views can be generated to analyze your financial performance, including:
My Income – A graph showing revenue across your chosen time period (last year or current)
My Expenses – A graph displaying expenses that affect your income statement
Previous Year Comparison – Track performance against last year with integrated forecasting capabilities
Accounts Receivable – Monitor who owes you money through the “Who Owes Me” report
Accounts Payable – Track vendor payments through the “Whom I Owe” report
Balance Sheet Overview – Review your assets, liabilities, and equity
Cash Flow Statement – Monitor your cash position
Step 1: Navigating in QBO
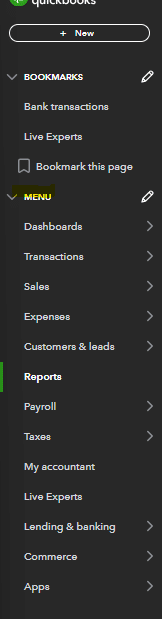
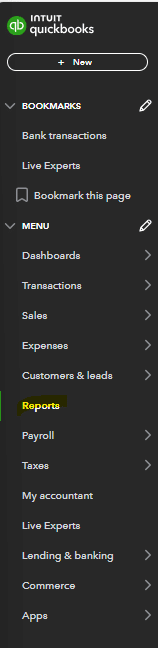
After signing into your company file, navigate to the drop-down menu at the left side of your screen. While this guide focuses on Quickbooks Online, note that Quickbooks Desktop users will find similar functionality.
Select the reports section where you’ll find various Quickbooks reports including your loss report options.
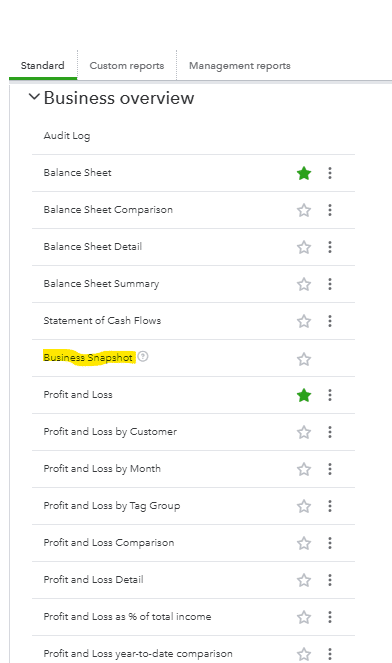
Once in the reports module you will need to scroll down to the business overview section and select the company snapshot report.
Step 2: Review Your Business Snapshot Dashboard Options
Once you’ve navigated to the business snapshot report within the business overview section you will see the screen below.
Once here you will have the option to change information pulling into the business snapshot.
My Income – Select the relevant time frame you want to pull into the snapshot (This Year-to-Date, Last Month, Last Quarter, Last Year).
My Expenses – Select the relevant time frame you want to pull into the snapshot (This Year-to-Date, Last Month, Last Quarter, Last Year).
Previous Year Income Comparison – Select the relevant time frame you want to pull into the snapshot (quarterly or monthly) and the revenue accounts you want to pull in (dependent on your chart of accounts).
Previous Year Expense Comparison – Select the relevant time frame you want to pull into the snapshot (quarterly or monthly) and the expense accounts you want to pull in (dependent on your chart of accounts).
Who Owes Me – Option to drill down into current and past due invoices.
Whom I Owe – Option to drill down into current and past due invoices.
Step 3: Customize Business Snapshot Report
Once you’ve analyzed your customization options within the business snapshot report you will want to select the options that best fit the needs of your stakeholders (such as your CPA).
Some factors to consider are:
Which metrics best demonstrate financial performance?
Does the date range align with reporting needs?
Should you include supplementary custom reports?
Would export to Excel be beneficial?
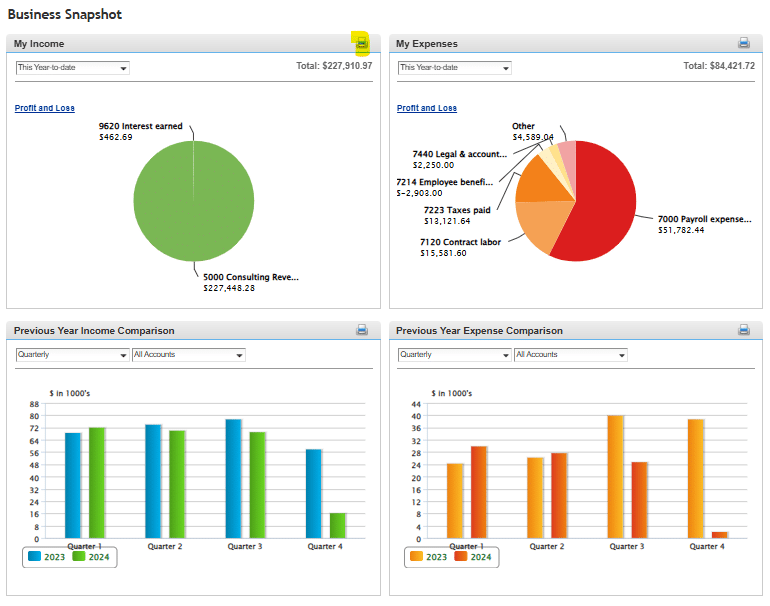
Step 4: Print and Share Report
After you’ve customized your business snapshot report to fit the needs of the business and message you are trying to communicate you will want to print and share the report. In order to do this you will need to select the printer icon on the right corner of the screen.
Once you’ve selected the print option you will be able to either physically print a copy of the report out or save a digital copy to email out. You can select as many of the snapshots to send out as needed. Some stakeholders may only need to see certain snapshots.
For example, someone on the accounts payable team may only need to see the whom I owe report so they can prioritize payments that need processed to vendors. The CEO or President of the organization may only want to see the total revenue and total expenses over a certain period of time.
Use Cases for Sharing QuickBooks Financial Snapshots
Company snapshot reports help businesses:
Share information across departments
Track financial performance trends
Support forecasting and budgeting
Manage accounts receivable collection
Monitor accounts payable obligations
Improve Your Financial Reporting with QuickBooks Financial Snapshots.
Visual and easy to use financial snapshots are a critical communication tool for accountants and financial reporting to help tell the story of a business and allow leaders to make informed decisions. It can help provide stakeholders with the information needed to help make critical choices as they navigate the landscape that their business operates in and set financial projections.
Ready to take your financial reporting to the next level?
Try Coefficient to seamlessly integrate your Excel with live data from various business systems, enabling real-time break-even analysis and more advanced financial modeling.
QuickBooks Online, a leading accounting software for small business owners, offers essential sales tax report functionality to help manage your tax collected and sales transactions.
This tutorial will guide you through how to run a sales tax liability report to ensure accurate sales tax payable tracking across each tax agency jurisdiction where you operate. By learning to properly run report features, you’ll maintain better control over your business’s tax collected responsibilities.
Let’s get started!
Tutorial: Run a Sales Tax Liability Report in QBO
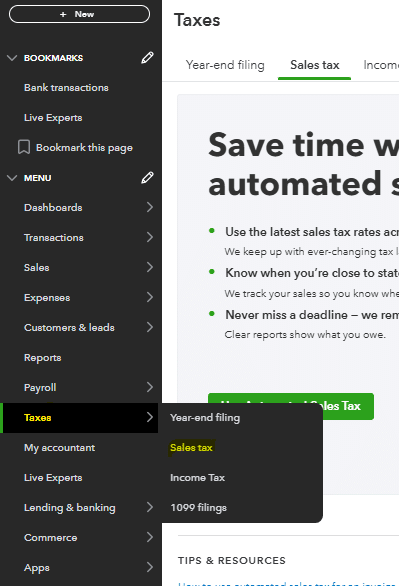
Step 1: Navigating in QuickBooks
Once you’ve signed into your QuickBooks Online account, navigate to the drop-down menu at the left side of your screen. This works whether you’re using Mac or PC (note that QuickBooks Desktop has a slightly different interface).
Once you’ve accessed the menu, first verify if your sales tax has been enabled. Many businesses have non-taxable sales, or may not need to charge sales tax to their end user. If your business doesn’t need to process sales receipts with tax or pay sales tax, you won’t want this feature enabled.
To enable sales tax in QuickBooks Online, click on the taxes – sales tax section of the menu. This is where you can manage sales tax settings.
Once in this section, click “use tax” to begin setup. You can save your preferences for future use.
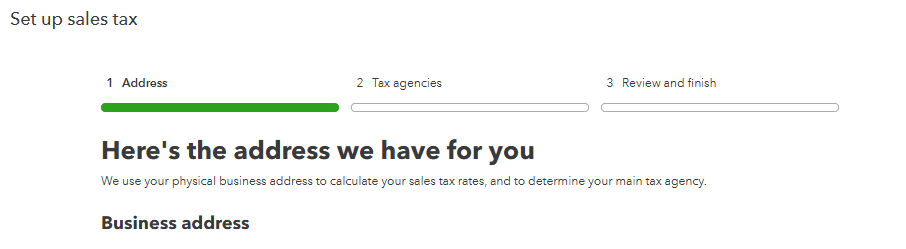
Step 2: Setting Up Automated Sales Tax
After selecting to use automated sales tax in QuickBooks Online, you’ll need to verify the correct tax category and tax rate for your jurisdiction.
The first prompt requires your business address. This helps determine the applicable sales tax rate based on your location. Click next to proceed.
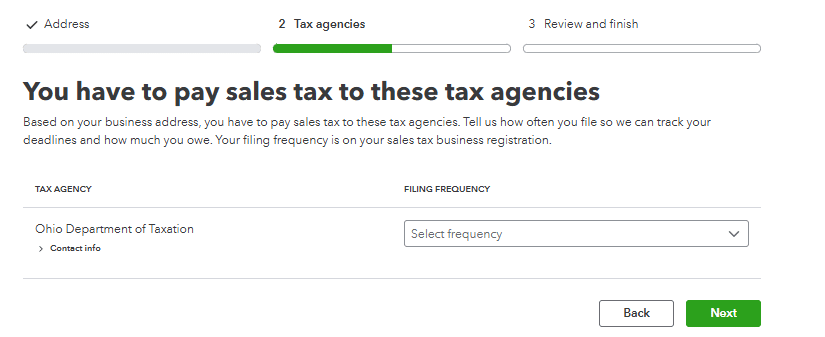
Once you’ve entered your address and selected next, you’ll reach the tax agency section. The corresponding tax agency from your business address will appear. You’ll need to select your filing frequency for your sales tax return. Consult with a bookkeeping expert about your report period.
After filling out the appropriate tax agency information, QuickBooks Online will prompt you to review and finalize. This enables tracking of your total sales tax liability and running the corresponding report.
Step 3: Navigating to Run Sales Tax Liability Report
Once you’ve enabled sales tax within QuickBooks Online, you can generate the report to see your tax amount due.
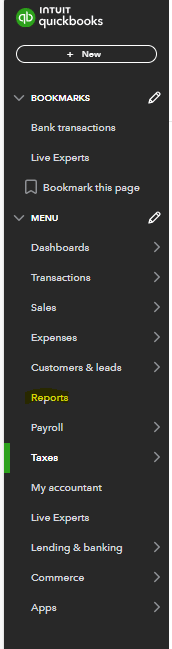
Navigate back to the reports menu in QuickBooks Online. Select “go to reports” from the menu.
Once in the menu, select the reports.
Step 4: Run Sales Tax Liability Report
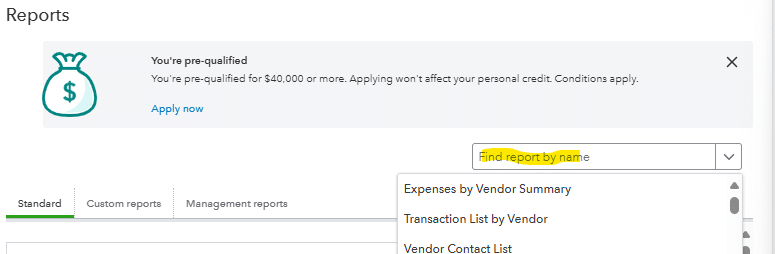
In the report module, search for “sales tax liability report” in the search bar at the top of the reports menu. You can customize reports as needed.
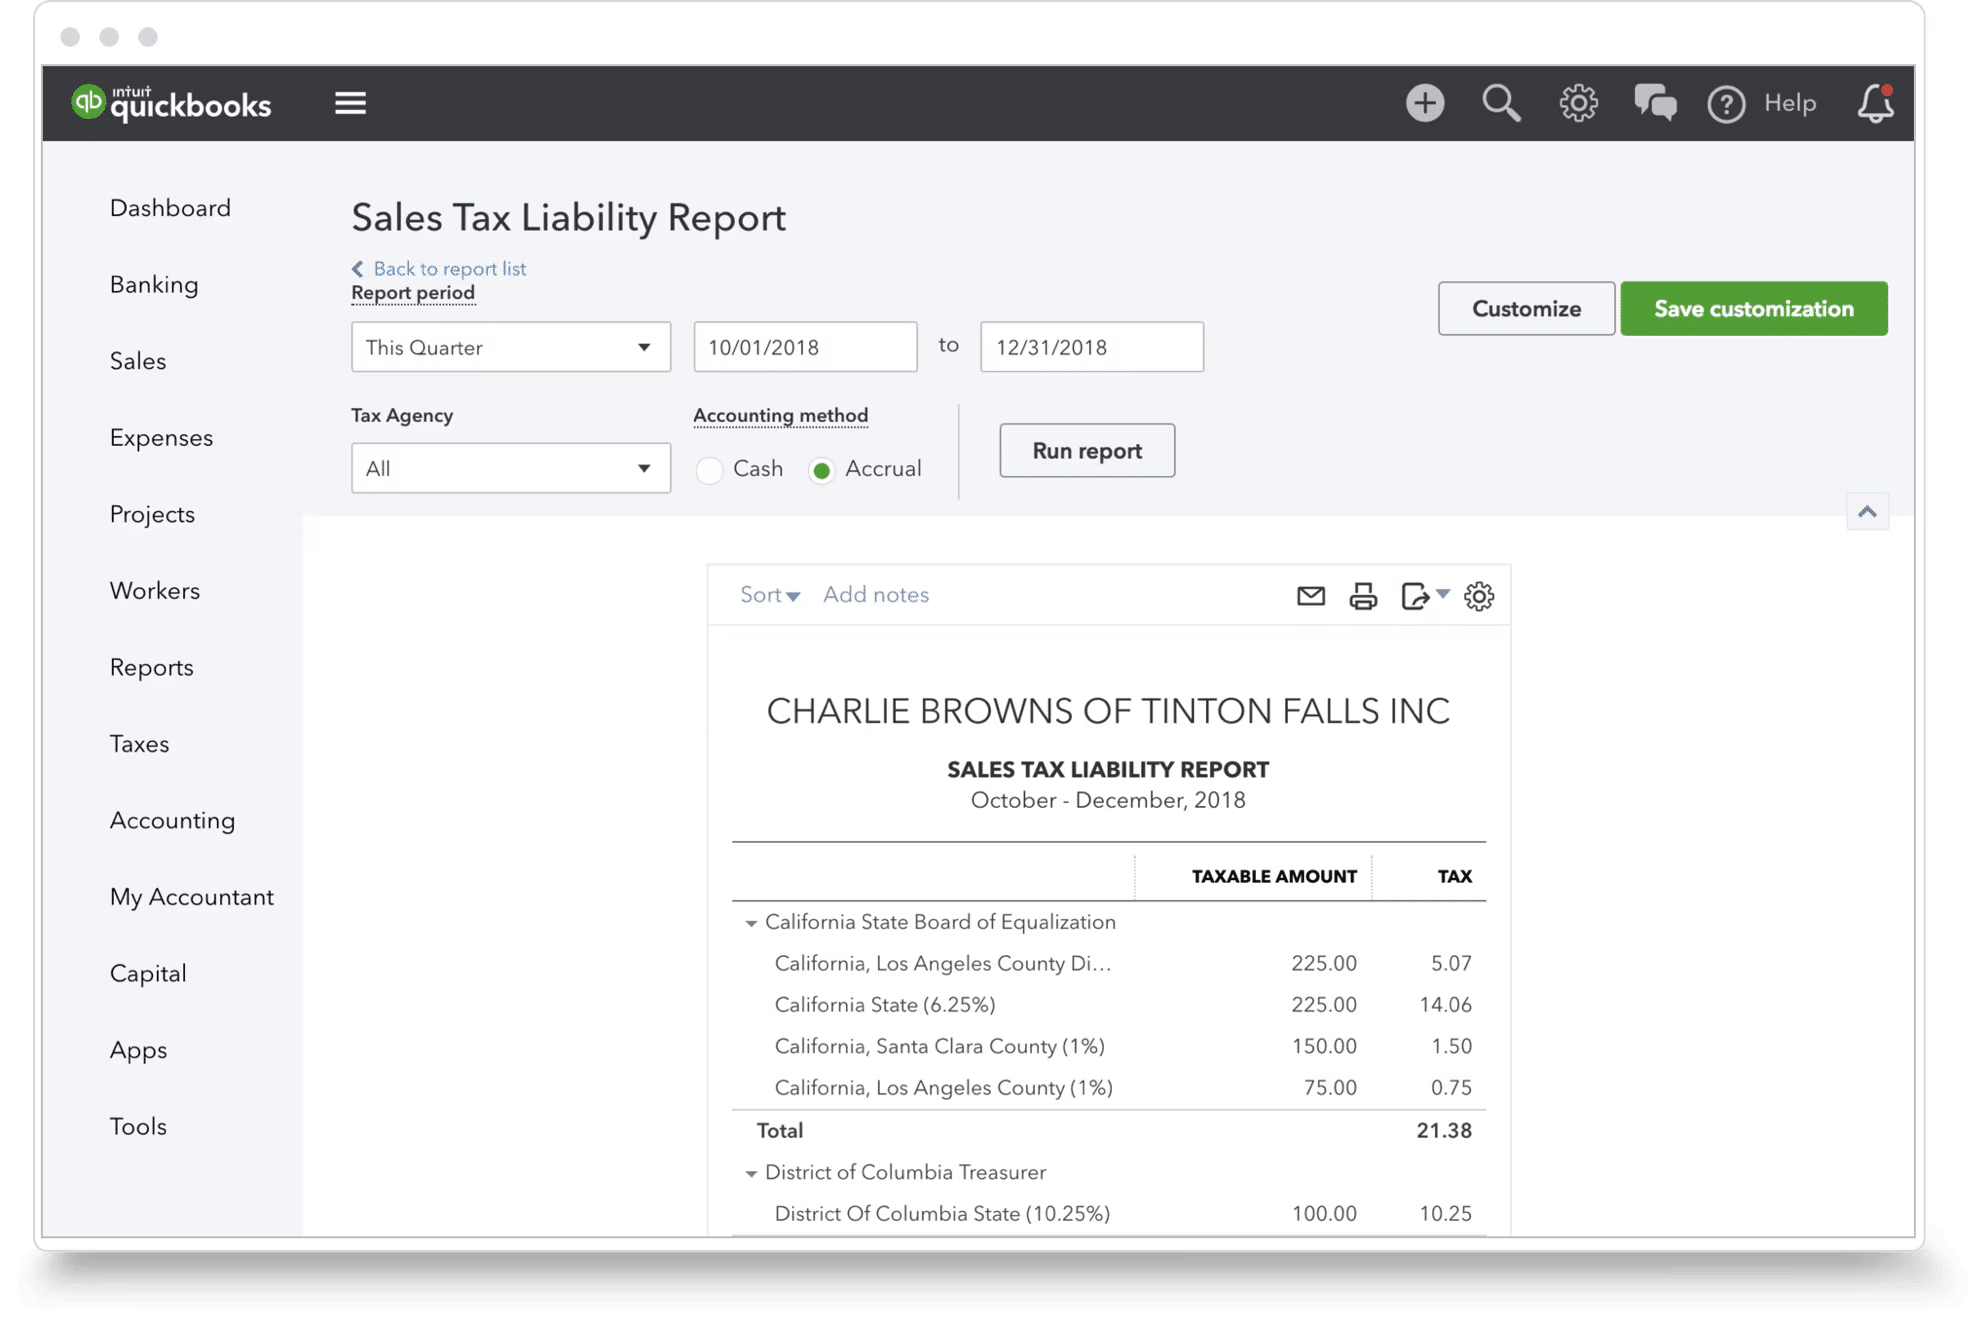
After selecting the sales tax liability report, choose the date range and tax agency. This reporting is typically done on a monthly or quarterly basis for sales tax payments. You can select a particular tax agency if your business operates across multiple jurisdictions.
After selecting the relevant timeframe and jurisdiction, you’ll have the necessary information about your sales tax due. This helps track how your total sales and taxable amount have changed over time.
Use Cases for Sales Tax Liability Reports
Sales tax liability reports can help businesses:
Track and pay sales tax in a timely manner to avoid discrepancies
Analyze which jurisdictions’ tax rate affects gross sales
Provide reporting for journal entries and credit memo processing
Accurately apply sales tax to each transaction based on location
Improve Your Sales Tax Accuracy and Reporting with Sales Tax Liability Reports and QuickBooks
Tax compliance is essential for every business. The sales tax liability report from QuickBooks Online provides an easy-to-use tool for ensuring accurate sales tax payments to appropriate jurisdictions. It helps verify correct tax collected on a transaction-by-transaction basis.
Try Coefficient to seamlessly integrate your Excel with live data from various business systems, enabling real-time analysis and more advanced financial modeling.
QuickBooks users need more than basic reporting features. Third-party reporting solutions add advanced capabilities, automation, and analytics that help businesses analyze their financial data and make faster decisions.
Let’s explore a few of the top QuickBooks reporting tools in more detail!
Limited visualization compared to dedicated BI tools
Pricing
Base fee: Free plan available | Paid starts from $49 / month
2. Domo – Enterprise Analytics Platform
Domo combines business intelligence with collaboration features, making it suitable for large teams that need to share and analyze QuickBooks data across departments.
Key Features
Advanced data visualization options
Built-in AI analytics
Mobile-first design
Custom app development options
Pros
Extensive data source connections
Strong mobile experience
Rich visualization library
Enterprise-grade security
Cons
Higher price point
Complex setup process
Requires technical expertise
Minimum contract commitments
Pricing
Standard: Starts at $83/user/month (5-user minimum)
Enterprise: Custom pricing
Business Critical: Custom pricing with advanced security
Support
Standard: Customer portal and business hours support
Premium: 24/7 support with dedicated team (Enterprise/Business Critical)
Technical consultation available for complex implementations
3. Tableau – Advanced Data Visualization
Tableau specializes in creating visual representations of data. It’s popular among data analysts and businesses that need to create detailed, interactive dashboards from their QuickBooks and other financial data.
Key Features
Drag-and-drop interface
Advanced calculations
Interactive dashboards
Statistical analysis tools
Pros
Powerful visualization capabilities
Extensive customization options
Strong community support
Regular feature updates
Cons
Significant learning curve
Higher cost structure
Complex for basic users
Resource-intensive
Pricing (As of October 2025)
Creator: $75/user/month (full features)
Explorer: $42/user/month (limited creation)
Viewer: $15/user/month (view only)
Enterprise: Custom pricing with advanced features
Support
Standard: Online resources and email support
Premium: 24/7 technical support (Enterprise plans)
Advanced Management: Enhanced security and deployment options
4. Fathom – Financial Analysis Focus
Fathom focuses specifically on financial analysis and reporting, making it a good fit for accountants and financial teams who need to create standardized reports from QuickBooks data.
Key Features
Financial KPI tracking
Automated reporting
Benchmark comparisons
Cash flow analysis
Pros
QuickBooks-specific features
Easy financial analysis
Clear reporting templates
Quick setup process
Cons
Limited to QuickBooks data
Basic visualization options
Row limits on lower tiers
Restricted customization
Pricing (As of October 2025)
1 Company: $50/month
10 Companies: $260/month
20 Companies: $380/month
50+ Companies: $680/month
Support
All Plans: Email support and online resources
Enterprise: Priority support with faster response times
Custom onboarding available for larger clients
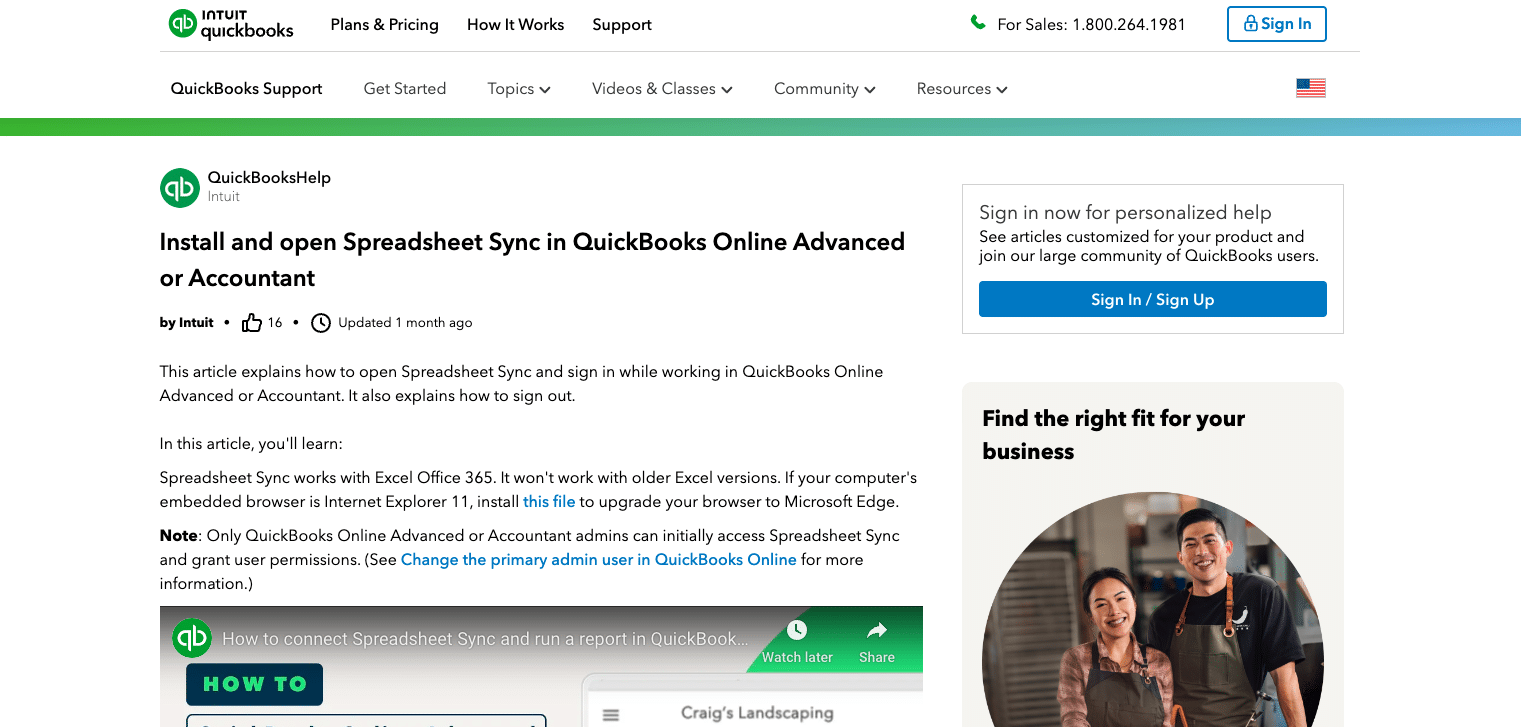
5. Spreadsheet Sync – Basic Integration
Spreadsheet Sync is QuickBooks’ native Excel integration tool, included with QuickBooks Online Advanced subscriptions. It’s best suited for basic data export needs.
Key Features
Basic data sync
Scheduled updates
Template library
Excel compatibility
Pros
Low cost option
Simple interface
Quick setup
Basic templates included
Cons
Limited row capacity
Basic security features
Hourly refresh only
No real-time updates
Pricing (As of October 2025)
Included with QuickBooks Online Advanced: $235/month
Currently 50% off first 3 months: $117.50/month
No standalone pricing available
Support
Dedicated support team available Monday-Friday, 6 AM-6 PM PT
Access through QuickBooks Online help center
Standard QuickBooks support channels
Make Better QuickBooks Reports Today
QuickBooks reporting tools enhance your financial analysis and decision-making. Each solution offers unique advantages, but Coefficient stands out for its real-time syncing and spreadsheet integration. Start building better reports today by trying Coefficient’s free plan. [Link to https://coefficient.io/get-started]
While several tools work with QuickBooks, Coefficient offers direct integration with both Google Sheets and Excel, providing real-time data syncing and automated reporting capabilities.
Does QuickBooks have built-in reporting?
Yes, QuickBooks includes basic reporting features. However, tools like Coefficient extend these capabilities with real-time updates, custom visualizations, and automated distribution.
What is the most useful QuickBooks report?
The Profit & Loss statement is essential, but Coefficient allows you to customize and combine multiple reports for comprehensive business analysis.
What is QuickBooks Smart reporting?
QuickBooks Smart reporting provides basic analytics. Coefficient enhances these features with real-time data syncing and automated report distribution.
Looking for the most useful QuickBooks Online reports? This guide showcases seven essential dashboards that provide clear insights into your financial data, helping you make informed decisions and drive business growth in 2025.
The Cash Runway Template helps you forecast how long your current cash reserves will sustain your business operations. This tool is crucial for startups and growing businesses to manage their burn rate and plan for future funding needs.
Use Case: Cash Flow Management and Forecasting
Burn Rate Analysis: Calculate your monthly cash burn to understand your financial sustainability.
Funding Planning: Determine when you’ll need to secure additional funding or reach profitability.
Scenario Planning: Create multiple scenarios to prepare for different financial outcomes.
The QuickBooks Profit and Loss Template provides a comprehensive view of your company’s financial performance. It consolidates key financial data from your QuickBooks account into an easy-to-read format, allowing you to quickly assess your business’s profitability and identify areas for improvement.
Use Case: Financial Performance Analysis
Revenue Tracking: Monitor your income streams and identify trends over time.
Expense Management: Analyze your costs and pinpoint areas for potential savings.
Profitability Assessment: Quickly determine your bottom line and track progress towards financial goals.
The SaaS P&L Template is specifically designed for Software as a Service businesses. It provides a detailed breakdown of revenue and expenses unique to the SaaS model, helping you understand your company’s financial health in the context of subscription-based services.
Use Case: SaaS Financial Analysis
Subscription Revenue Tracking: Monitor MRR, ARR, and other SaaS-specific revenue metrics.
Customer Acquisition Cost (CAC) Analysis: Understand the cost of acquiring new customers.
Churn and Retention Insights: Track customer churn rates and their impact on revenue.
The QBO Accounts Payable Dashboard provides a comprehensive view of your outstanding bills and payment obligations. It helps you manage vendor relationships and optimize your cash flow by tracking when payments are due.
Use Case: Vendor Payment Management
Payment Scheduling: Visualize upcoming payment due dates to plan cash outflows.
Vendor Analysis: Identify top vendors by spend and negotiate better terms.
Cash Flow Optimization: Manage payment timing to balance cash reserves and vendor relationships.
The QuickBooks Accounts Receivable Dashboard helps you track and manage customer payments. It provides a clear view of outstanding invoices, categorized by age, helping you identify late payments and take proactive measures to improve cash flow.
Use Case: Customer Payment Tracking
This dashboard helps you maintain healthy cash flow by monitoring customer payments:
Track outstanding invoices and identify late-paying customers
Anticipate incoming payments to better manage your business’s financial needs
Identify patterns in customer payment behavior to inform credit decisions and collection strategies
The QuickBooks Inventory Management Dashboard is essential for businesses that deal with physical products. It provides real-time insights into your inventory levels, helping you optimize stock levels, reduce carrying costs, and prevent stockouts.
Use Case: Inventory Optimization
This dashboard helps businesses track and optimize their stock levels:
Keep track of current inventory levels across all products
Set up notifications for when stock reaches reorder points
Analyze sales patterns to inform purchasing decisions
The QBO Revenue Dashboard provides a comprehensive view of your company’s income streams. It helps you track and analyze various revenue sources, identifying trends and opportunities for growth.
Use Case: Revenue Analysis and Forecasting
Revenue Stream Analysis: Break down revenue by product, service, or customer segment.
Trend Identification: Spot seasonal patterns or growth trends in your revenue data.
Performance Tracking: Compare current revenue against targets or previous periods.
The QuickBooks Cashflow Template tracks the movement of cash in and out of your business. It categorizes cash flows into operating, investing, and financing activities, providing a clear picture of your company’s liquidity and financial health.
Use Case: Cash Flow Management
Liquidity Analysis: Understand your business’s ability to meet short-term obligations.
Investment Decision Making: Evaluate the impact of potential investments on your cash position.
Financial Planning: Use cash flow trends to inform budgeting and financial strategy.
Metrics Tracked
Net cash flow from operating activities
Net cash flow from investing activities
Net cash flow from financing activities
Free cash flow
Cash conversion cycle
Free QuickBooks Online Reports
These seven QuickBooks Online reports offer valuable insights into various aspects of your business’s financial health, from cash flow projections to inventory management and financial ratio analysis. By using these dashboards, you’ll be better equipped to make data-driven decisions and keep your business on the path to financial success in 2025 and beyond. Start using these QuickBooks Online reports today to transform your financial reporting and decision-making processes.