
TL;DR
- See profitability (P&L) and liquidity (cash flow) in one unified view
- Track burn rate, cash runway, and working capital metrics automatically
- Connect to QuickBooks Online for live data
- Understand why profitable companies still run out of cash
- Built for CEOs presenting to boards and CFOs managing working capital
Why should I use the Financial Performance & Cash Flow Dashboard?
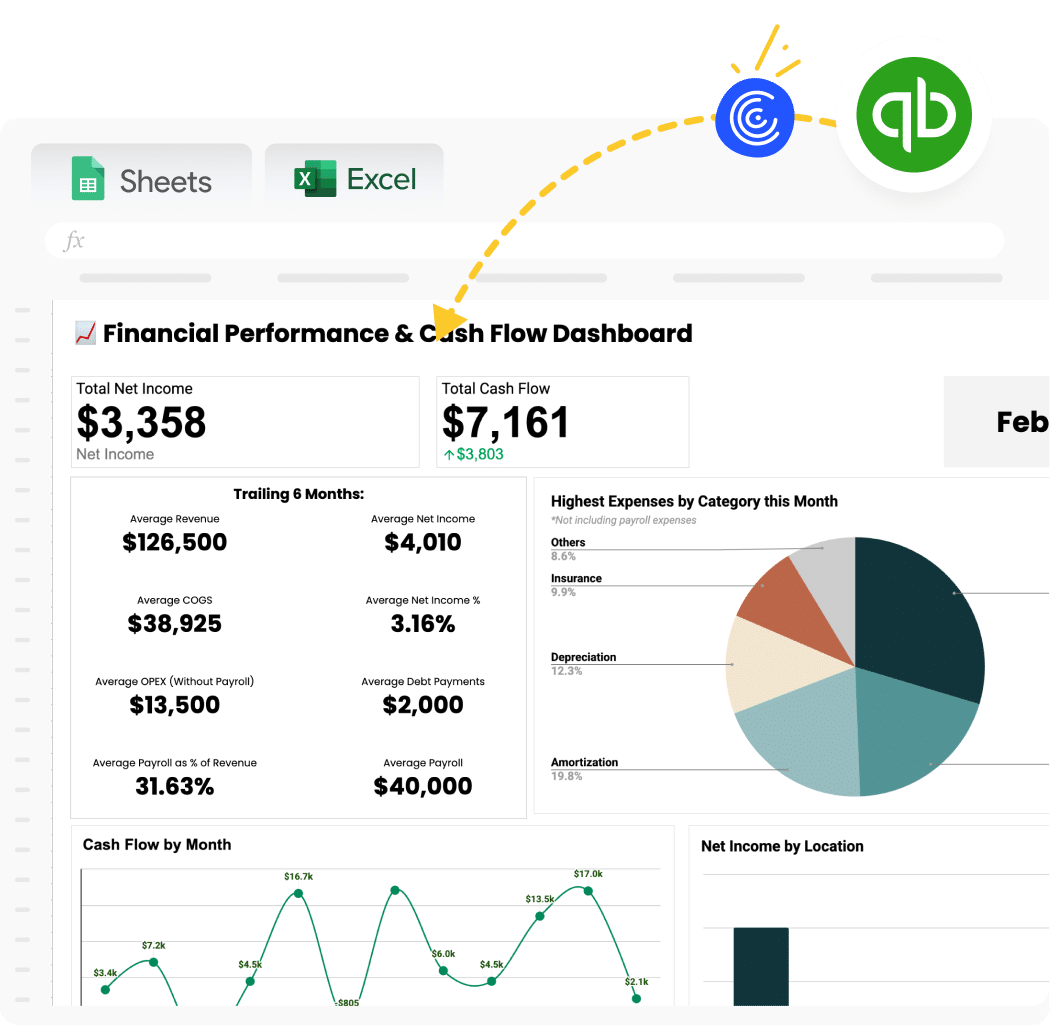
This dashboard combines two critical views: profitability (from your P&L) and liquidity (from your cash flow and balance sheet). Most businesses track these separately and miss the full story. Revenue is growing but cash is declining? This dashboard shows you why.
It answers questions like: “We made $500K profit last quarter—why do we only have $50K in the bank?” or “Should we hire three people this month or will that drain cash?”
Benefits of Using Coefficient-Powered Dashboards
See the complete financial story – Most dashboards show P&L OR cash flow. This template integrates both so you understand exactly where profits go and why cash behaves differently.
Real-time liquidity monitoring – Know your cash position right now, not at the end of last month. Critical for businesses managing tight cash positions or planning major investments.
Working capital intelligence built-in – Automatically calculate DSO, DPO, and cash conversion cycle. Identify exactly where cash gets stuck in your operations.
Alert systems prevent surprises – Set up notifications when cash drops below your threshold. Proactively manage liquidity instead of reacting to emergencies.
Spreadsheet flexibility with automated data – Add custom analysis, charts, and annotations without worrying about breaking data connections. Your customizations survive every refresh.
| Feature | Coefficient Template | Manual Spreadsheets | Any Dedicated BI or Visualization Tool |
| Primary Use | Integrated financial + cash reporting | Static financial models | Enterprise data visualization |
| Setup Time | 2-3 hours | Hours to rebuild monthly | Days/weeks for data modeling |
| Cost | Free – $49/month | Free (but 5-10 hours monthly labor) | $10-70/user/month + consultant fees |
| Data Freshness | Auto-refresh from source systems | Stale until manually updated | Auto-refresh (once configured) |
| Working Capital Calc | Built-in formulas for DSO, DPO, etc. | Build formulas yourself | Requires DAX/calculated fields |
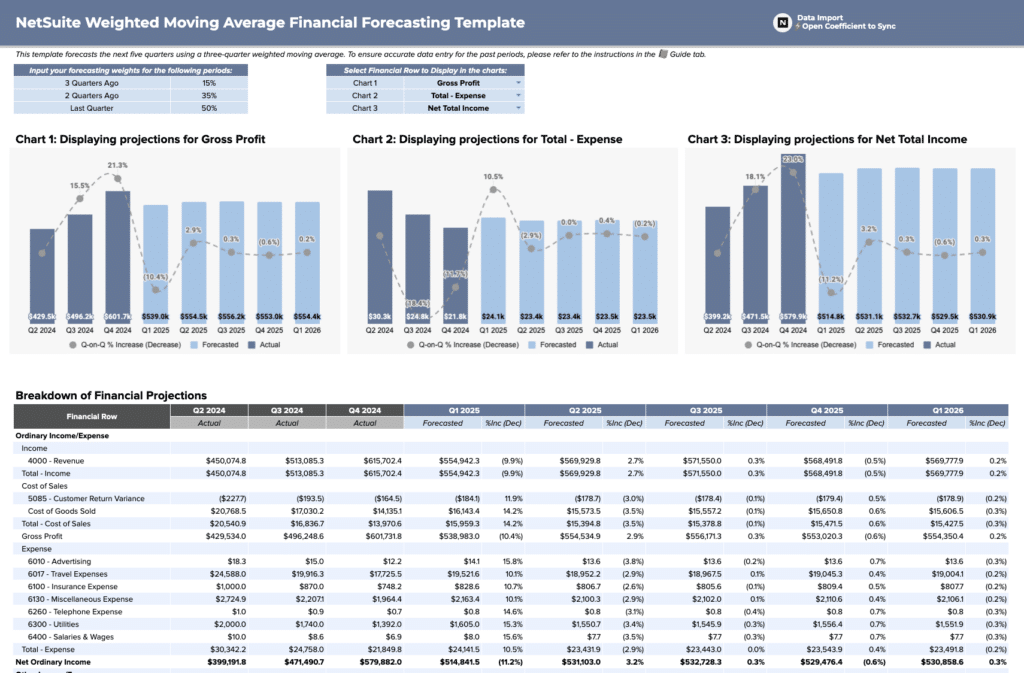
| Cash Flow Forecasting | Add forecast tab with assumptions | Manual projection models | Complex predictive modeling |
| Multi-Entity | Yes (import from multiple systems) | Manual consolidation nightmare | Yes (complex data pipelines) |
| Best For | SMBs needing clarity on profit vs cash | One-time analysis | Enterprises with dedicated analysts |
What’s Inside the Template
Profitability Performance (P&L-based):
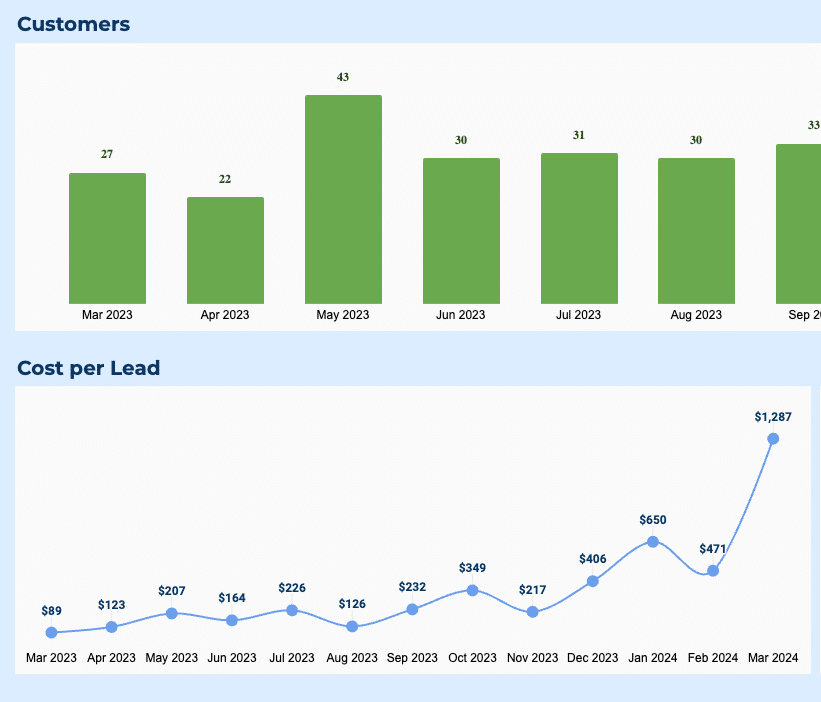
- Monthly revenue and revenue growth rate (MoM, YoY)
- Gross profit and gross margin percentage
- Operating expenses by category
- EBITDA (earnings before interest, taxes, depreciation, amortization)
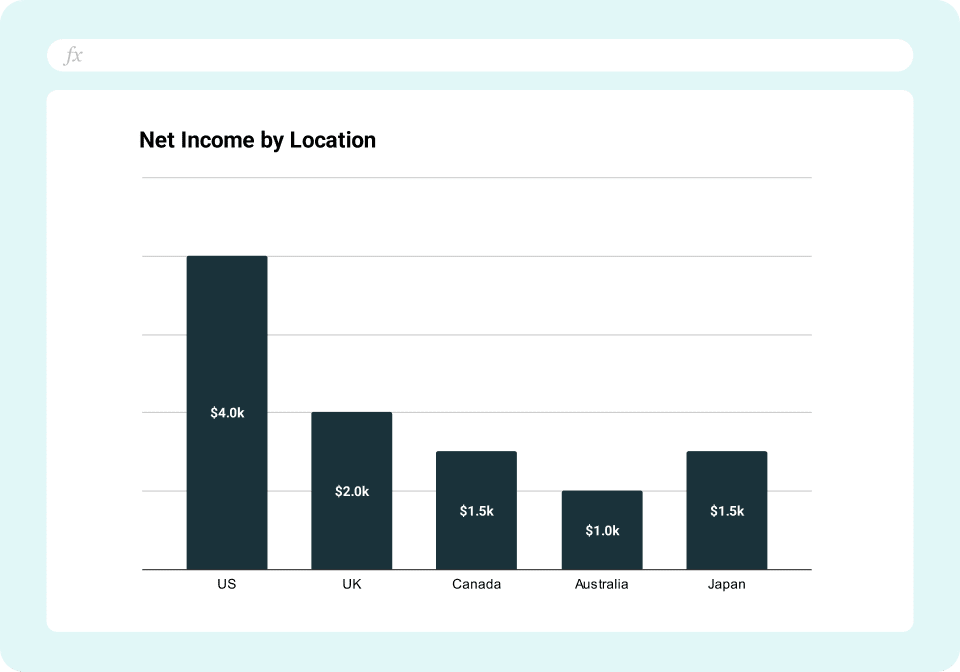
- Net income
- Operating margin and net margin trends
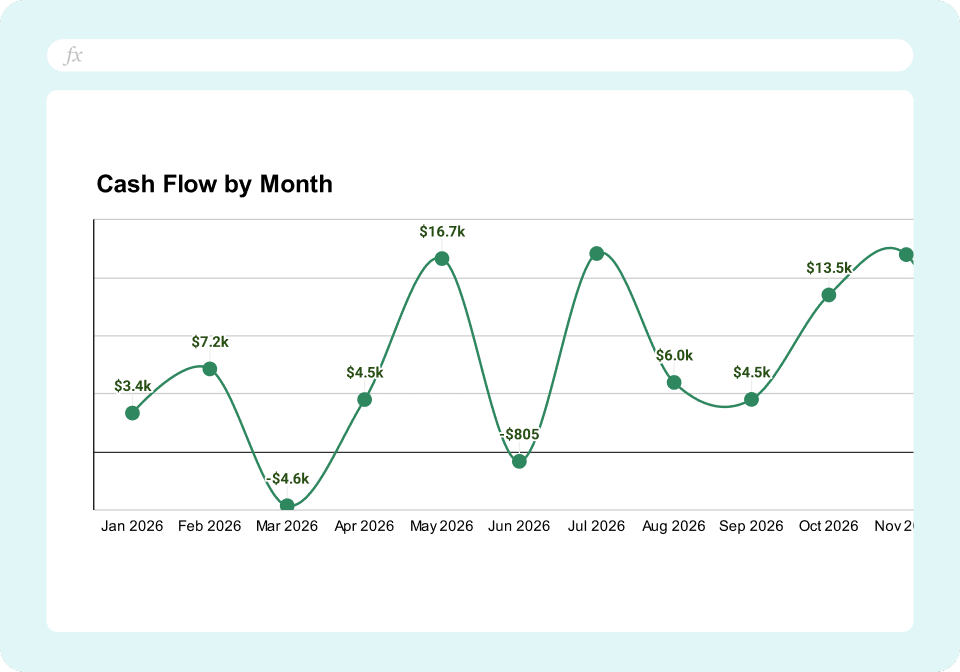
Cash Flow & Liquidity:
- Current cash balance across all accounts
- Operating cash flow (cash from core business)
- Investing cash flow (CapEx, asset purchases)
- Financing cash flow (loans, equity raises)
- Net cash change (total cash in – cash out)
- Burn rate (monthly net cash outflow)
- Cash runway (months of operations remaining)
Working Capital Metrics:
- Accounts Receivable balance and trend
- Days Sales Outstanding (DSO) – how long to collect payments
- Accounts Payable balance
- Days Payable Outstanding (DPO) – how long until you pay vendors
- Inventory balance (if applicable)
- Days Inventory Outstanding (DIO) – how long inventory sits
- Cash Conversion Cycle = DSO + DIO – DPO
Liquidity Ratios:
- Current Ratio = Current Assets / Current Liabilities
- Quick Ratio = (Cash + AR) / Current Liabilities
- Working capital requirement trend
Integrated Dashboard View:
- Side-by-side P&L performance vs cash flow performance
- Variance analysis: profit vs cash flow delta
- Alerts when cash drops below minimum threshold
How to Use This Template
Step 1: Get the template
Sign up with your work email to access the dashboard. Choose Excel or make a Google Sheets copy. Both work perfectly.
Step 2: Install free Coefficient add-on for Sheets / Excel
Add Coefficient to your spreadsheet to bring the dashboard to life. This free add-in enables automatic data connections from your business systems directly into your spreadsheet. More details on the connector here.
Step 3: Connect your accounting system
Choose QuickBooks as an import data source in the Coefficient sidebar to connect your QuickBooks Online account to the spreadsheet. Coefficient also supports Xero, NetSuite, Sage Intacct & more but some formulas or charts might break in this specific template since this is built for QBO.
Step 4: Import your financial statements
Pull your Profit & Loss, Balance Sheet, and Cash Flow Statement data. This populates the performance and liquidity sections automatically.
Step 5: Set up calculated metrics
The template includes pre-built formulas for burn rate, cash runway, DSO, DPO, and other working capital metrics. These calculations update automatically when your data refreshes.
Step 6: Configure cash alerts (optional)
Set minimum cash balance thresholds. Get notifications via Slack or email when your balance drops below your comfort zone.
Step 7: Schedule automatic refreshes
Enable daily or weekly data updates. Your profitability and cash metrics stay current without manual exports or data entry.