


Burn Rate Formula Explained
Gross Burn Rate = Total Monthly Operating Expenses
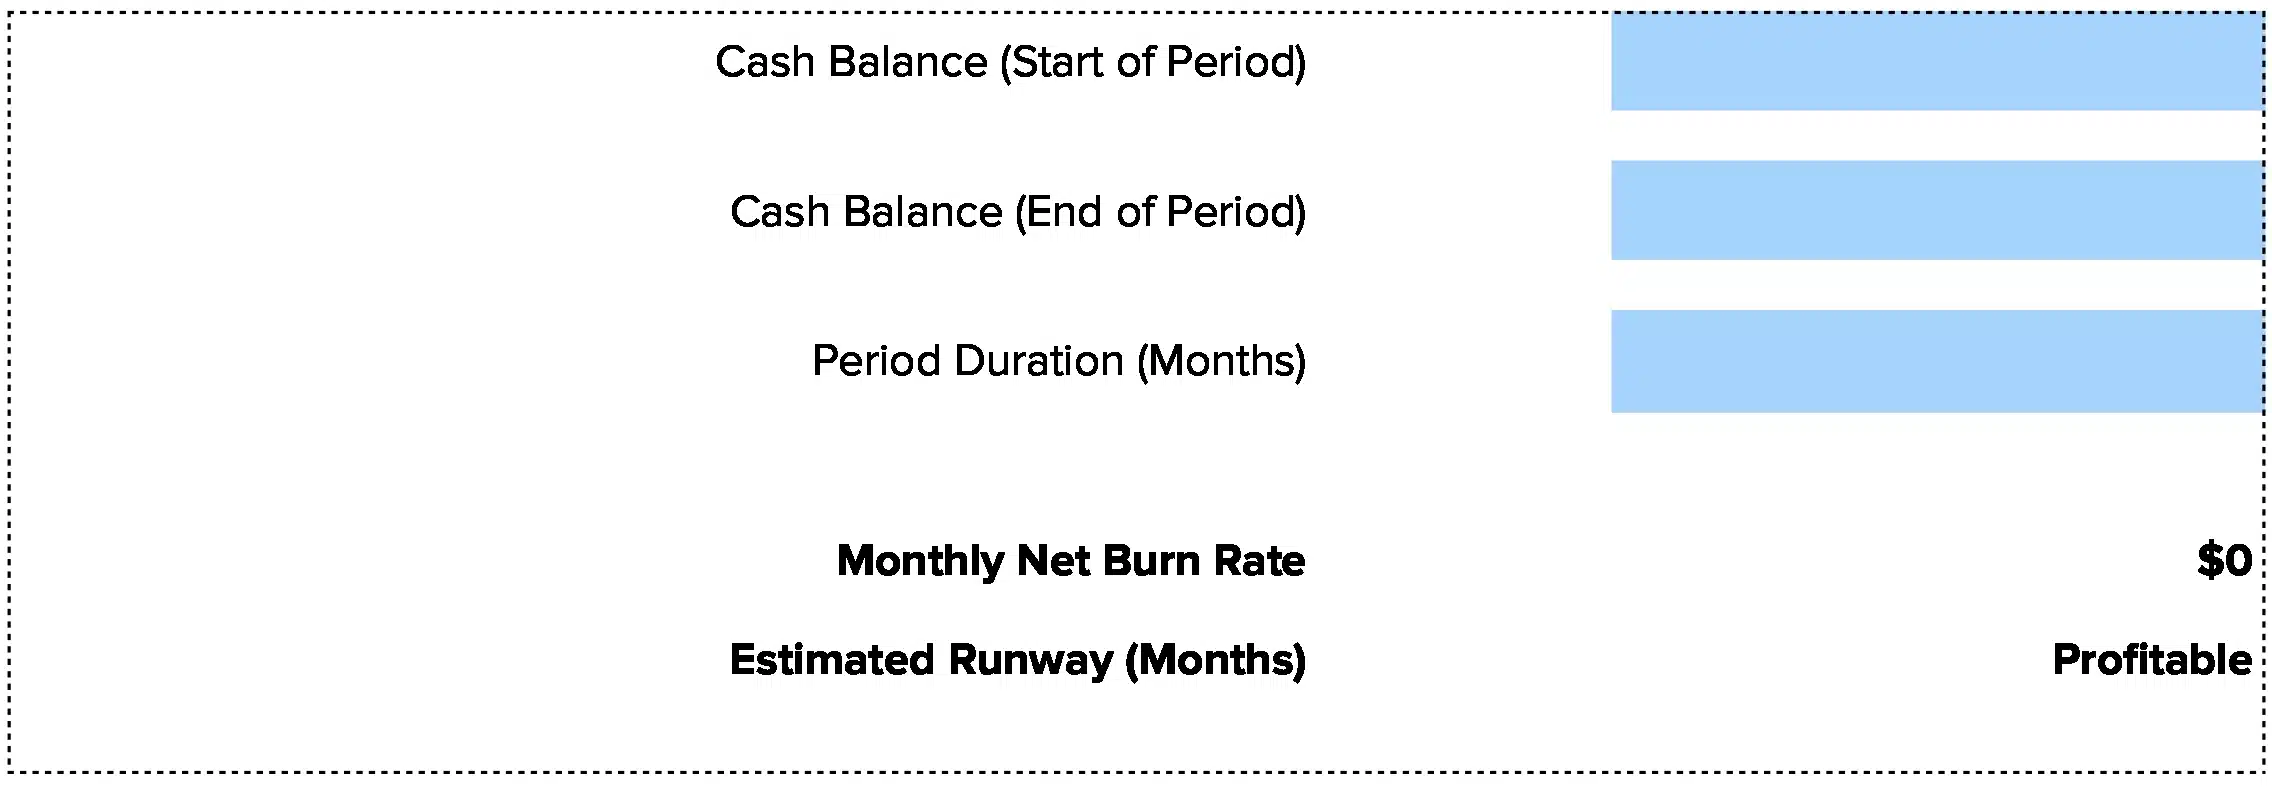
Net Burn Rate = Monthly Operating Expenses – Monthly Revenue
Cash Runway (Months) = Cash Balance / Net Burn Rate
Let’s break down each component:
Gross Burn Rate: This is all cash going out the door each month. Count salaries, rent, marketing, software subscriptions, and every other operational cost. Gross burn shows your total spending without considering revenue. A company spending $450,000 monthly has a $450,000 gross burn rate.
Net Burn Rate: This accounts for incoming revenue. Subtract monthly revenue from monthly operating expenses. A company generating $300,000 in monthly revenue while spending $450,000 has a net burn rate of $150,000. This metric more accurately reflects financial sustainability as the business scales.
Cash Runway: Divide your current cash balance by net burn rate to see how many months you can operate. With $1.8 million in the bank and $150,000 monthly net burn, you have 12 months of runway. This assumes constant burn rate, though actual runway may vary with seasonal revenue or expense fluctuations.
Why these formulas matter: Burn rate measures the rate at which a company spends its available capital before generating positive cash flow. Understanding your burn rate helps answer critical questions: How long can the company operate with current resources? When will additional funding be needed? Are spending levels sustainable?
What Is Burn Rate?
Burn rate measures how fast you spend cash reserves. It’s the monthly rate of cash depletion for companies operating at a loss while building products and customer base.
This metric is particularly crucial for startups and growth-stage companies. Companies should maintain at least 12-18 months of runway to provide adequate time for course corrections and fundraising activities. The calculation typically focuses on operating expenses minus operating revenue, excluding non-cash items like depreciation.
Who uses this metric?
Startup Founders track burn rate to understand how long they can operate before needing to raise capital.
CFOs and Finance Leaders monitor burn rate to manage cash flow and plan funding rounds strategically.
Venture Capitalists evaluate burn rate when assessing portfolio companies and determining follow-on investment timing.
Board Members review burn rate to ensure management maintains adequate runway and capital efficiency.
Fractional CFOs use burn rate to advise multiple clients on cash management and fundraising timelines.
How to Calculate Burn Rate: Step-by-Step
Walk through these calculations to understand your financial runway:
- Calculate gross burn rate
Add up all monthly operating expenses. For TechFlow, a B2B SaaS company:
- Salaries and benefits: $180,000
- Office and facilities: $35,000
- Marketing and sales: $45,000
- Software and tools: $15,000
- Other operating costs: $5,000
Total monthly operating expenses: $280,000
- Calculate net burn rate
Subtract monthly revenue from monthly expenses:
- Monthly operating expenses: $280,000
- Monthly recurring revenue: $95,000
Net Burn Rate: $280,000 – $95,000 = $185,000/month
- Determine current cash balance
Check your bank accounts and liquid investments. TechFlow has $2,400,000 in cash reserves.
- Calculate runway
Divide cash balance by net burn rate:
Runway: $2,400,000 / $185,000 = 13 months
- Interpret your result
With 13 months of runway and revenue growing 15% month-over-month, TechFlow has healthy runway. They should begin planning their Series A fundraising within the next 6-8 months. Their revenue growth trajectory provides strong momentum for investor discussions.
How to Interpret Your Burn Rate Number
Your runway period determines the urgency of action needed. Context matters—high growth can justify higher burn if unit economics are strong.
| Runway Period | Interpretation | Recommended Actions |
| < 6 months | Critical – Immediate action required to extend runway or secure funding | • Cut non-essential costs immediately<br>• Accelerate revenue from existing customers<br>• Secure emergency bridge funding<br>• Consider strategic options |
| 6-12 months | Concerning – Action needed soon to maintain healthy buffer | • Begin fundraising process now<br>• Implement efficiency measures<br>• Explore revenue optimization<br>• Build investor pipeline |
| 12-18 months | Healthy – Comfortable buffer for operations and planning | • Continue current operations<br>• Plan next funding round timeline<br>• Invest in proven growth channels<br>• Monitor burn trends monthly |
| > 18 months | Strong – Excellent financial position with strategic flexibility | • Maintain strategic focus on growth<br>• Consider market expansion<br>• Build competitive advantages<br>• Avoid complacency on costs |
Burn Rate Benchmarks by Industry
Burn rate expectations vary significantly by industry due to different business models, capital requirements, and paths to profitability.
| Industry | Typical Burn Rate | Notes |
| SaaS/Software | Moderate to High | Heavy investment in product development, customer acquisition cost, and technical infrastructure |
| E-commerce | Moderate | Inventory management, marketing spend, fulfillment operations, and payment processing costs |
| Biotech/Pharma | Very High | Extended R&D cycles, clinical trials, regulatory compliance, and specialized equipment requirements |
| Consumer Apps | High | User acquisition costs, platform fees, ongoing feature development, and customer support scaling |
| Professional Services | Low to Moderate | Primarily personnel costs with lower technology and infrastructure requirements |
Benchmark Citations
Harvard Business Review – Company Survival Without Revenue
Bessemer Venture Partners – Burn Multiple Analysis
McKinsey – Excellence in Budgeting
Automating Burn Rate Tracking with Coefficient
Stop manually updating burn rate spreadsheets from multiple bank accounts and systems. Coefficient connects your financial tools directly to Excel or Google Sheets. Your burn rate calculations update automatically from live data.
Pull expenses from QuickBooks, revenue from Stripe, and cash balances from your bank. Build a dashboard that shows current burn rate, rolling 3-month average, and projected runway. Set alerts when burn increases more than 15% month-over-month or when runway drops below 12 months.
Finance teams save hours each week. Fractional CFOs manage multiple client burn rates from one dashboard. Get started with Coefficient to automate your burn rate tracking.
How to Improve Your Burn Rate
Extending runway requires increasing revenue, cutting costs, or both. Focus on actions with the biggest impact:
Accelerate revenue from existing customers
Increasing revenue directly improves net burn rate. Focus on expanding within existing customer relationships through upselling and cross-selling, which typically costs 5-7x less than acquiring new customers. Implement usage-based pricing models that capture more value as customers grow. Prioritize high-value customer segments with shorter sales cycles and stronger retention metrics.
Cut non-essential expenses immediately
Systematic cost review identifies efficiency opportunities without compromising growth. Renegotiate vendor contracts annually, consolidate software tools with overlapping functionality, and leverage volume discounts through committed usage. Implement zero-based budgeting for discretionary spending categories. Consider outsourcing non-core functions to variable cost structures rather than fixed overhead.
Optimize customer acquisition efficiency
Lower customer acquisition cost (CAC) improves unit economics and reduces burn. Focus spending on proven channels that deliver customers below your target CAC. Cut or reduce spend on experimental channels until core growth engine is efficient. Track CAC by channel monthly and reallocate budget to best performers.
Improve gross margins
Higher margins mean more contribution from each sale. Negotiate better supplier terms, reduce cost of goods sold, or increase prices where market allows. A 10% gross margin improvement flows directly to the bottom line and reduces net burn significantly.
Consider strategic resource reallocation
Research shows that companies reallocating more than 50% of capital expenditures across businesses over ten years generated 50% higher total returns to shareholders than companies that reallocated less than 30%. Focus resources on proven growth channels rather than spreading investments across unvalidated experiments. Implement rigorous ROI tracking for all major expenditure categories.
Burn Rate vs. Burn Multiple vs. Revenue Runway
These related metrics provide different perspectives on capital efficiency and path to profitability:
Burn Rate
Measures monthly cash consumption. Formula: Monthly Operating Expenses – Monthly Revenue. Use this to calculate runway and manage cash flow. Example: $450,000 expenses – $300,000 revenue = $150,000 net burn rate.
Burn Multiple
Measures capital efficiency. Formula: Net Burn Rate / Net New ARR. Shows dollars burned per dollar of new annual recurring revenue. A burn multiple under 1.5x indicates excellent efficiency, while above 3x suggests unsustainable customer acquisition costs. Example: A SaaS company burning $300,000 monthly while adding $150,000 in monthly recurring revenue ($1.8M ARR) has a burn multiple of 2.0x.
Revenue Runway
Calculates months until revenue equals expenses (breakeven). While cash runway shows months until bank account reaches zero, revenue runway indicates whether growth trajectory will reach profitability before cash depletion. A company with 15 months cash runway but growing revenue 10% monthly while keeping expenses flat might reach revenue runway in 9 months.
When to use each
Track all three together. Burn rate shows immediate cash situation. Burn multiple reveals capital efficiency. Revenue runway indicates path to profitability. The gaps between these metrics tell the full story of your financial health.
Pro tip for fractional CFOs: Present all three metrics to clients. A client with 18 months cash runway looks healthy until you show their burn multiple is 4.5x, revealing they’re spending inefficiently. Or a client with 8 months cash runway but 6 months to revenue runway needs bridge funding, not major cost cuts that would damage growth.
Extend Your Runway
Burn rate below 12 months demands immediate action. Between 12-18 months signals healthy operations. Above 18 months provides strategic flexibility.
Track burn rate weekly during tight periods, monthly when stable. Always calculate both gross and net burn—gross shows spending discipline while net reveals business model viability. Build scenario models showing runway under different growth and cost assumptions.
Get started with Coefficient to build automated burn rate dashboards that connect your financial systems and update in real-time.
 Sync Live Finance Data into Your Spreadsheet


