


Days Payable Outstanding Formula Explained
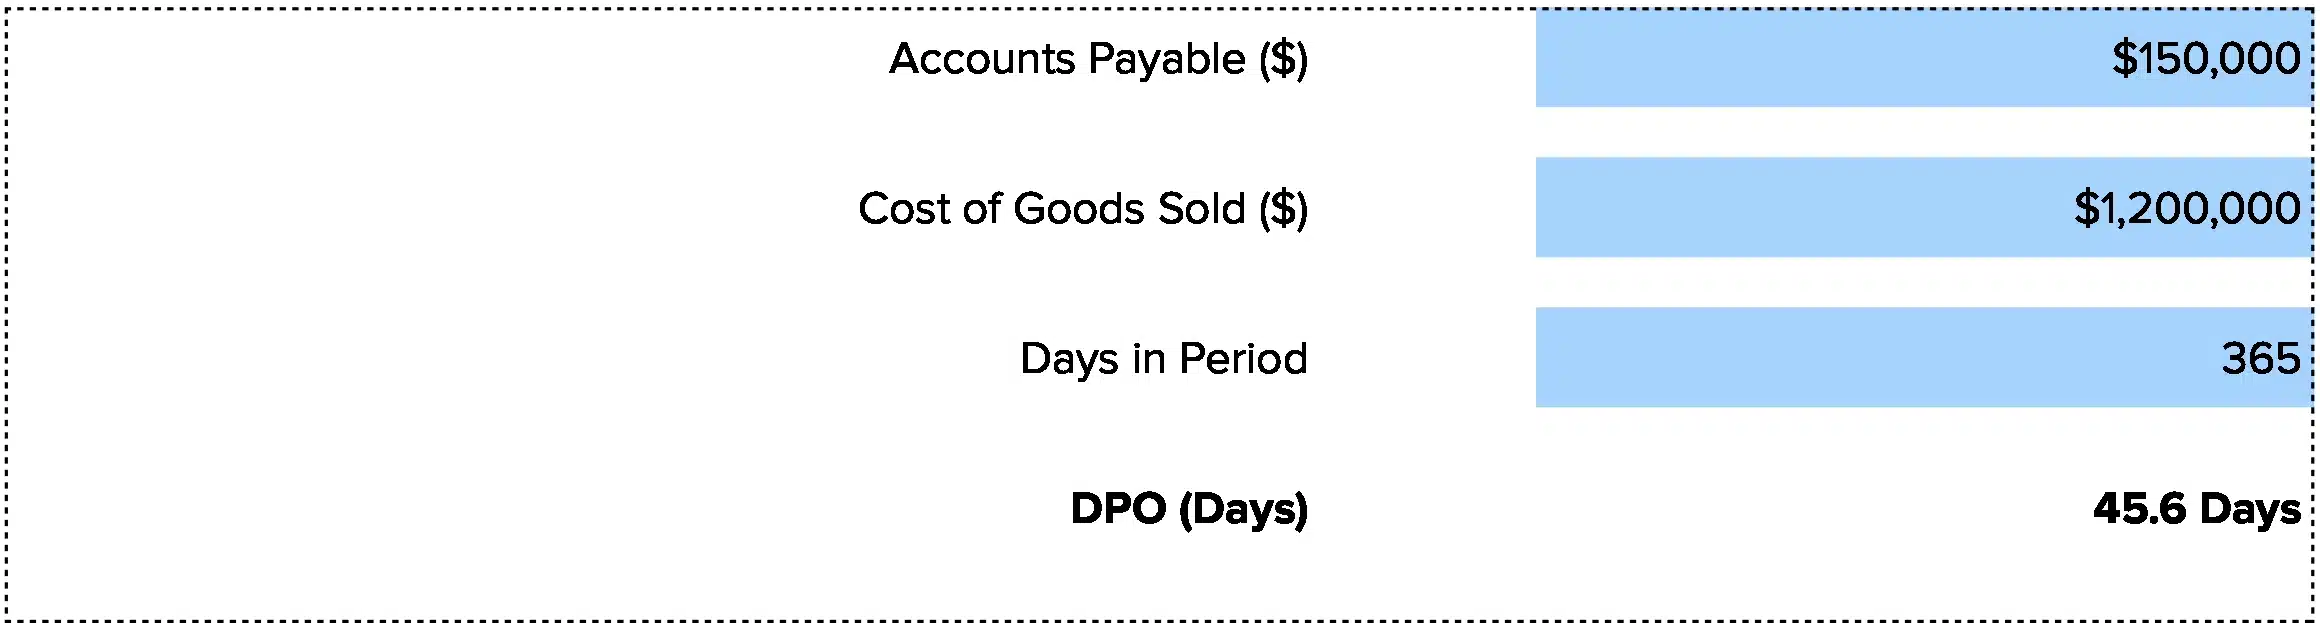
DPO = (Accounts Payable / Cost of Goods Sold) × Number of Days
Let’s break down each component:
Accounts Payable: The total amount your company owes suppliers for goods or services already received but not yet paid. This appears as a current liability on your balance sheet. You can use either ending accounts payable for a snapshot or average accounts payable for more accuracy.
Cost of Goods Sold (COGS): The direct costs to produce goods you sell. This includes raw materials, labor, and manufacturing expenses. For service companies, use cost of revenue instead. COGS appears on your income statement.
Number of Days: The period you’re measuring—365 for annual, 90 for quarterly, or 30 for monthly analysis. Most companies use 365 days for consistency.
Why this formula works: It shows how many days of COGS you’re holding in accounts payable. A higher number means you’re keeping cash longer before paying bills.
What Is Days Payable Outstanding?
Days payable outstanding measures the average time your company takes to pay supplier invoices after receiving goods or services. Think of it as the flip side of accounts receivable—instead of tracking how fast customers pay you, DPO tracks how fast you pay others.
A higher DPO means you hold cash longer, which can improve short-term liquidity. But too high can damage supplier relationships. A lower DPO means faster payments, which keeps suppliers happy but ties up more working capital.
Who uses this metric?
CFOs and Controllers use DPO to optimize working capital and cash flow strategy across the organization.
Accounts Payable Managers track DPO to balance payment timing with supplier relationship management.
Treasury Teams monitor DPO to forecast cash needs and plan short-term investments.
Fractional CFOs compare DPO across client portfolios to identify cash flow optimization opportunities.
Credit Analysts evaluate DPO to assess a company’s payment practices and financial discipline.
How to Calculate Days Payable Outstanding: Step-by-Step
Let’s walk through calculating DPO with a realistic example.
- Pull your balance sheet data
Find your most recent accounts payable balance. This should match the date you’re analyzing. For our example: $250,000 in accounts payable at month-end.
- Get your COGS from the income statement
Look at cost of goods sold for the same period. If you’re calculating annual DPO, use the full year’s COGS. In our example: $1,825,000 annual COGS.
- Choose your time period
Decide if you’re calculating daily, monthly, quarterly, or annual DPO. We’ll use 365 days for an annual view.
- Calculate daily COGS
Divide total COGS by the number of days: $1,825,000 ÷ 365 = $5,000 daily COGS. This tells you how much you spend per day on production costs.
- Divide accounts payable by daily COGS
Take your accounts payable balance and divide by daily COGS: $250,000 ÷ $5,000 = 50 days.
- Verify using the standard formula
You can also calculate directly: ($250,000 / $1,825,000) × 365 = 50 days. Both methods give the same result.
- Interpret the result
A DPO of 50 days means your company takes an average of 50 days to pay suppliers after receiving invoices. If your payment terms are net 30, you’re paying 20 days slower than terms. If terms are net 60, you’re paying early.
How to Interpret Your DPO Number
Understanding your DPO requires comparing it to your payment terms and industry norms.
| DPO Range | Interpretation | Recommended Actions |
| Below 30 days | Paying too fast – Missing cash flow opportunities. You’re likely paying before terms or not using available credit periods. | • Review payment terms with suppliers<br>• Delay payments to match agreed terms<br>• Evaluate if early payment discounts justify fast payment<br>• Consider extending terms with key vendors |
| 30 – 60 days | Healthy range – Aligned with standard net-30 to net-45 terms. Balances cash management with supplier relationships. | • Monitor payment accuracy<br>• Maintain current practices<br>• Build supplier scorecards<br>• Review for strategic discount opportunities |
| 60 – 90 days | Extended but manageable – Taking longer to pay but still within reasonable limits for many industries. | • Confirm this aligns with actual terms<br>• Check supplier satisfaction scores<br>• Watch for late payment penalties<br>• Ensure consistent payment schedules |
| Above 90 days | Potential concern – Either very favorable terms or payment difficulties. Risk of damaged supplier relationships and credit issues. | • Audit overdue invoices immediately<br>• Communicate with at-risk suppliers<br>• Review cash flow forecasts<br>• Consider invoice financing if needed |
Days Payable Outstanding Benchmarks by Industry
DPO varies widely by industry based on business models, inventory needs, and supplier dynamics.
| Industry | Typical DPO Range | Notes |
| Retail | 30 – 45 days | Fast inventory turns require quick supplier payments to maintain stock flow |
| Manufacturing | 45 – 60 days | Longer production cycles allow extended payment windows |
| Construction | 60 – 90 days | Project-based billing creates longer payment cycles with subcontractors |
| Technology/SaaS | 30 – 50 days | Low COGS relative to revenue, minimal inventory, vendor relationships crucial |
| Healthcare | 40 – 60 days | Medical supply chains and equipment leasing create moderate payment cycles |
| Wholesale Distribution | 35 – 50 days | Thin margins require careful balance of payment timing |
| Professional Services | 25 – 40 days | Lower COGS, emphasis on maintaining vendor relationships |
| E-commerce | 30 – 55 days | Rapid inventory churn balanced with supplier negotiation power |
Why these variations exist: Manufacturing companies often negotiate longer terms because they buy in bulk. Retail businesses pay faster to ensure consistent inventory supply. SaaS companies have fewer suppliers and prioritize relationship quality over payment delays. Construction firms align payments with project milestones and client cash inflows.
Context matters: A 70-day DPO might signal financial strength in construction but cash flow problems in retail. Always compare your DPO to industry peers, not just absolute benchmarks.
Benchmark Citations
Investopedia: Days Payable Outstanding
Wall Street Prep: DPO Formula and Calculator
One Advanced: DPO Industry Benchmarks
Automating DPO Tracking with Coefficient
Stop manually exporting payment data from NetSuite or QuickBooks every month.
Coefficient connects your accounting system directly to Excel or Google Sheets, pulling accounts payable and COGS data automatically. Your DPO calculates itself from live data, and you can track trends over time without touching a CSV file.
Set up takes ten minutes. After that, schedule automatic refreshes daily, weekly, or monthly. Perfect for finance teams managing multiple entities or fractional CFOs tracking client metrics across portfolios. Get started with Coefficient and automate your DPO tracking.
How to Improve Your Days Payable Outstanding
Optimizing DPO balances cash retention with supplier relationships.
Negotiate extended payment terms
Talk to your top suppliers about moving from net-30 to net-45 or net-60 terms. Emphasize your reliable payment history and the value of your business relationship. Most suppliers will extend terms for consistent, dependable customers. This can add 15-30 days to your DPO without damaging relationships.
Centralize invoice processing
Consolidate all invoices into one accounts payable system. Scattered invoices across departments lead to early or duplicate payments. A central system lets you schedule payments strategically rather than reactively. This typically adds 5-10 days to DPO by eliminating rushed payments.
Schedule payments to match terms
Set up payment runs that align with invoice due dates, not arrival dates. If an invoice comes in on the 1st with net-45 terms, schedule payment for day 43-45, not day 5. Use automation to batch payments weekly while respecting individual due dates.
Review early payment discounts strategically
Many businesses take 2/10 net-30 discounts automatically. Calculate if the 2% discount exceeds your cost of capital. If your cash earns more than 36% annualized return elsewhere, skip the discount and pay on day 30 instead. This preserves working capital for higher-return uses.
Implement dynamic discounting
Offer suppliers the option to get paid early in exchange for small discounts when you have excess cash. This builds goodwill when you extend DPO during tight periods. The flexibility strengthens relationships while optimizing cash flow timing.
Days Payable Outstanding vs. Days Sales Outstanding vs. Cash Conversion Cycle
DPO is one component of your overall cash flow efficiency. Understanding how it relates to other metrics provides complete working capital insight.
Days Payable Outstanding (DPO)
Measures how long you take to pay suppliers. Higher is better for cash retention but watch supplier relationships.
Days Sales Outstanding (DSO)
Measures how long customers take to pay you. Lower is better—you want cash in hand quickly.
Days Inventory Outstanding (DIO)
Measures how long inventory sits before selling. Lower indicates efficient inventory management.
Cash Conversion Cycle (CCC)
The master metric that combines all three: CCC = DIO + DSO – DPO. This shows how many days your cash is tied up in operations. A lower CCC means faster cash conversion.
How they work together
If your DIO is 45 days, DSO is 35 days, and DPO is 50 days, your CCC is 30 days (45 + 35 – 50 = 30). Your cash is tied up for 30 days from when you pay suppliers until customers pay you.
Pro tip for fractional CFOs: Present all three metrics together. A client with excellent DPO of 70 days might still have poor cash flow if their DSO is 90 days. Show the complete picture: “Your CCC of 65 days is 25 days longer than industry average, driven primarily by slow customer collections, not supplier payments. Let’s focus on accelerating DSO before extending DPO further.”
Optimize your cash flow
DPO reveals opportunities to hold cash longer without damaging supplier relationships. Track it alongside DSO and DIO for complete working capital visibility.
Get started with Coefficient to automate your DPO tracking and make strategic cash flow decisions.
 Sync Live Finance Data into Your Spreadsheet


