Your AR aging report says you have $500K outstanding. Sounds manageable.
But what if those receivables have been sitting there for 90 days? Or 120? The raw balance tells you nothing about how fast you’re collecting cash—or how slow.
Days Sales Outstanding (a dso report excel) fills this gap. It measures the average time between invoicing a customer and receiving payment. A rising DSO means cash is stuck in receivables longer. A falling DSO means your collection engine is working.
This guide walks you through building a DSO report in Excel that tracks collection performance at both the company and customer level.
DSO measures the average number of days your company takes to collect payment after a credit sale. It’s a direct indicator of collection efficiency and working capital health.
The basic formula:
DSO = (Accounts Receivable / Total Credit Sales) × Number of Days
A company with $100,000 in receivables and $300,000 in monthly credit sales has a DSO of 10 days. That’s excellent. A company with $200,000 in receivables against the same sales figure has a DSO of 20 days. That’s twice as long to collect.
Finance teams use DSO to spot collection problems before they become cash flow crises.
Gather your accounts receivable data
Traditional DSO reporting starts with data extraction pain. Log into your ERP. Export the AR aging report to CSV. Open Excel. Copy and paste. Pull credit sales from a separate report. Repeat next month.
Coefficient connectors eliminate this manual process. Pull receivables and sales data directly into Excel from QuickBooks, NetSuite, or Salesforce—no downloads required.
The template expects this data structure:
Customer name and account ID Invoice date and invoice amount Payment due date based on credit terms Actual payment date (if received) Outstanding balance per invoice
Calculate company-level DSO
The template’s summary section calculates your overall DSO automatically. Here’s what happens behind the scenes.
Company DSO Formula:
= (Total Accounts Receivable / Total Credit Sales) × Days in Period
For monthly analysis, the formula becomes:
= (AR Balance / Monthly Credit Sales) × 30
The template pulls your total AR balance and credit sales from the data tab. It calculates DSO for whatever period you specify—monthly, quarterly, or annual.
A company DSO of 45 days means you wait an average of six weeks between invoicing and payment. Whether that’s good or bad depends on your industry and credit terms. Net-30 terms with 45-day DSO signals a collection problem. Net-60 terms with 45-day DSO suggests customers pay early.
Calculate invoice-level DSO
Company-wide DSO hides customer-specific patterns. Your average might be 40 days, but that could mask one customer at 15 days and another at 90.
The template calculates DSO for each invoice:
Invoice DSO Formula:
= Payment Date – Invoice Date
For unpaid invoices, the formula uses today’s date:
= TODAY() – Invoice Date
This invoice-level view reveals which customers drag down your overall DSO and which ones pay fast.
Calculate days past due
DSO tells you how long invoices take to collect. Days Past Due tells you how far beyond terms customers stretch payment.
Days Past Due Formula:
= Payment Date – Due Date
Or for unpaid invoices:
= TODAY() – Due Date
A customer might have a 45-day DSO but only be 5 days past due (on Net-40 terms). Another customer with the same 45-day DSO could be 15 days past due (on Net-30 terms). The second customer needs more collection attention.
Build the DSO dashboard
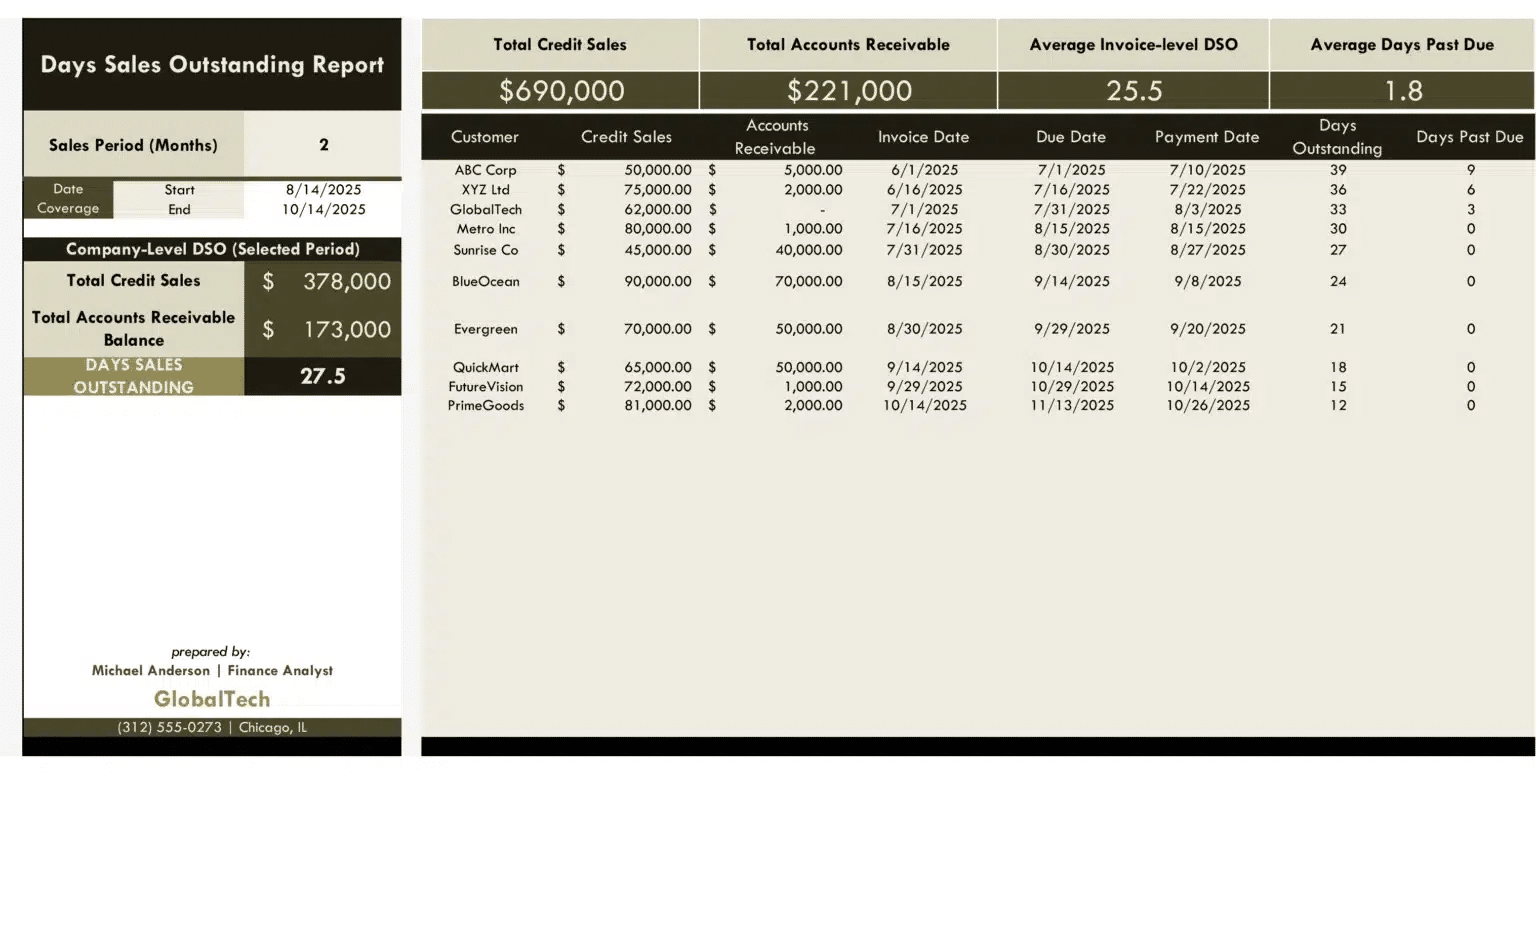
The template’s dashboard tab displays your key metrics in one view. No digging through data tabs or hunting for specific cells.
Company-level metrics displayed:
Total credit sales for the period
Total accounts receivable balance
Company-wide DSO
Average invoice-level DSO
Average days past due
The dashboard also includes a customer breakdown table. Sort by DSO to find your slowest payers. Sort by outstanding balance to find your largest collection opportunities.
Visualization options:
Bar charts comparing DSO across customers
Trend lines showing DSO movement over time
Aging buckets (Current, 1-30, 31-60, 61-90, 90+)
Interpret your DSO results
Raw data need context. Here’s how to read DSO signals:
DSO rising over time: Collection efficiency is declining. Customers take longer to pay each period. Investigate whether this stems from new customers with poor payment habits, existing customers stretching terms, or invoice disputes delaying payment.
DSO below credit terms: Customers pay faster than required. This might indicate strong customer relationships or overly generous early payment discounts eating into margins.
DSO well above credit terms: Collection process needs attention. Consider tightening credit policies, implementing automated payment reminders, or adjusting terms for chronic late payers.
Wide DSO variance across customers: Your customer base has vastly different payment behaviors. Segment customers by DSO and tailor collection strategies accordingly.
Add historical trend analysis
Single-period DSO provides a snapshot. Multi-period trends reveal whether collection performance is improving or deteriorating.
The template supports period-over-period comparison:
Current month vs. prior month Current quarter vs. same quarter last year Rolling 12-month average DSO
Seasonal businesses often see DSO fluctuations that follow sales cycles. A retailer might have low DSO in January (holiday payments coming in) and high DSO in March (slow season with extended terms). Historical comparison distinguishes seasonal patterns from genuine collection problems.
Automate refresh and alerts with Coefficient
Manual DSO updates consume hours every month. Export AR data. Refresh credit sales. Recalculate formulas. Rebuild charts. The template solves the structure problem, but data freshness remains a challenge.
Coefficient automates the entire refresh cycle. Schedule daily or weekly data pulls from your accounting system. Your DSO dashboard stays current without manual intervention.
Set alerts for critical thresholds:
Company DSO exceeds 45 days
Any customer DSO rises above 60 days
Days past due average crosses 15 days
Outstanding AR balance jumps 20% month-over-month
For finance teams managing multiple entities, Coefficient connects unlimited company instances under a single account. Monitor DSO across your entire portfolio from one workbook.
Turn receivables data into collection action
DSO reporting transforms raw AR balances into actionable collection intelligence. Instead of reacting to cash flow problems after they hit, you’ll spot deteriorating payment patterns early and address them proactively.
The template eliminates manual DSO calculations while providing both company-wide and customer-level insights. Whether you’re a CFO monitoring working capital or an AR manager prioritizing collection calls, automated DSO analysis delivers the visibility you need.
Ready to stop chasing spreadsheets and start improving collections? Get started with our free DSO template and connect your accounting data for automated reporting that updates on your schedule.
FAQs
How do you calculate DSO in Excel?
DSO = (Accounts Receivable / Total Credit Sales) × Number of Days in Period. For monthly DSO, divide your AR balance by monthly credit sales and multiply by 30. The template automates this calculation—just input your receivables and sales data.
What is a good DSO number?
Good DSO depends on your credit terms and industry. Generally, DSO should be close to your payment terms. If you offer Net-30, a DSO of 30-40 days is reasonable. DSO significantly above your terms indicates collection inefficiency.
How often should I calculate DSO?
Monthly DSO tracking catches collection problems early. Weekly calculation helps high-volume businesses with tight cash cycles. The template supports any reporting frequency—connect live data through Coefficient for real-time DSO monitoring.
What’s the difference between DSO and AR aging?
AR aging categorizes outstanding invoices by how long they’ve been unpaid (0-30 days, 31-60 days, etc.). DSO calculates the average collection time across all invoices. Both metrics complement each other—aging shows the distribution, DSO shows the average.
Hannah Recker
Head of Growth Marketing
Hannah Recker was a data-driven growth marketer before partying in the data became a thing. In her 12 years experience, she's become fascinated with the way data enablement amongst teams can truly make or break a business. This fascination drove her to taking a deep dive into the data industry over the past 4 years in her work at StreamSets and Coefficient.