


Free Excel Dashboard Templates for Sales, Finance and Operations Teams
An Excel dashboard template gives your team a ready-made structure for turning raw data into a clear, visual summary of performance without building charts, graphs, pivot tables, and formulas from scratch. Every Excel dashboard template in this library is pre-built for a specific use case, with the right KPIs, chart types, data visualization and data structure already configured.
Report templates and dashboard examples in this library cover sales pipeline tracking, financial reporting, marketing performance, and operations management across Salesforce, HubSpot, QuickBooks, and other connected systems. Each template works immediately with your own excel spreadsheet data and can connect to live data sources for automatic refresh.
Types of Excel dashboard templates
Excel dashboard templates fall into four main types, each built around a different kind of business question and audience.
KPI and strategic dashboard templates
KPI dashboard templates in Excel give executives and senior managers a high-level view of company or departmental performance against defined targets. These dashboard report templates typically display five to eight top-level metrics like revenue vs. target, gross margin, customer count, headcount vs. plan with clear indicators of whether each KPI is on track or requires attention. They are consumed monthly or quarterly and streamlined for readability over analytical depth for accurate decision making.
Sales and operational dashboard templates
Sales dashboard templates in Excel track the metrics revenue teams review weekly: pipeline value, win rate, deals created, quota attainment, and average deal size. Operational dashboard templates track day-to-day performance across projects, support queues, or inventory. Both types are designed for frequent updates and for audiences who need to act on what they see, not just observe trends.
Financial and analytical dashboard templates
Financial dashboard templates in Excel track P&L performance, cash flow, budget vs. actuals, financial health and accounts receivable. These templates often include period-over-period comparisons and variance analysis and more complex data — the analytical layer that helps finance teams understand why a number is moving, not just that it has moved. They are consumed monthly by finance and accounting teams and quarterly by boards and investors.
Project and operations dashboard templates
Project dashboard templates in Excel track task completion, milestone status, resource allocation, and budget performance across a defined initiative. Operations templates track recurring workflow metrics: ticket resolution time, inventory levels, or streamline production output. These are typically updated manually on a daily or weekly basis by project managers or operations leads.
How to build a good Excel dashboard
Whether you start from a template or build from scratch, the same structural principles determine whether an Excel dashboard gets used every week or opens once and gets forgotten.
Start with the workbook structure
Separate raw data, calculations, and the dashboard display into distinct tabs. The Raw Data tab in the excel file holds one row per record, consistent headers, no merged cells. The Calculations tab holds pivot tables and formula summaries — the intermediate layer that shapes data into the numbers the dashboard shows. The Dashboard tab holds only charts, KPI cards, and formatted summaries. Nothing on the Dashboard tab should be edited directly. This three-tab structure makes the dashboard maintainable and auditable by anyone on the team.
Choose chart types that match the data
Line charts for performance trends over time. Column or bar charts for comparisons across categories or periods. Scorecard-style cells for single KPIs — a large number with a label and a target comparison. Pie charts for simple part-to-whole relationships where there are three or fewer segments. Mixing chart types without a consistent logic makes a dashboard harder to read, not richer. Each chart should answer one question. If it answers two, split it into two charts.
Design for the reader, not the builder
Turn off gridlines on the Dashboard tab (View > Gridlines). Use a consistent two or three color palette for color-coded elements — one for positive performance, one for negative, neutral grey for context. Make the most important KPI the largest element on screen, positioned top-left. Label every chart with an outcome-oriented title: 'Pipeline Coverage vs 4x Target' tells the reader what to look for. 'Pipeline by Stage' does not. Test the dashboard at the screen resolution of the person who will use it most to make informed decisions before calling it done.
How to use an Excel dashboard template
Getting from download to a working Excel dashboard takes five steps.
- Download the template. Click any template from the gallery above. The file downloads as an .xlsx file compatible with Microsoft Excel on desktop or web.
- Enable editing. Open the file in Excel and click Enable Editing if prompted. This unlocks the template for editing.
- Replace the sample data. Navigate to the Raw Data or Data tab. Delete the sample rows and paste in your own data, or connect a live data source using Coefficient's Excel connector.
- Customise KPI labels and layout. On the Dashboard tab, update chart titles, rename KPI labels, adjust color schemes, and add or remove metrics to match your team's priorities.
- Share with your team. Save the file to OneDrive or SharePoint for shared access. Set appropriate permissions so stakeholders can view without editing the underlying formulas.
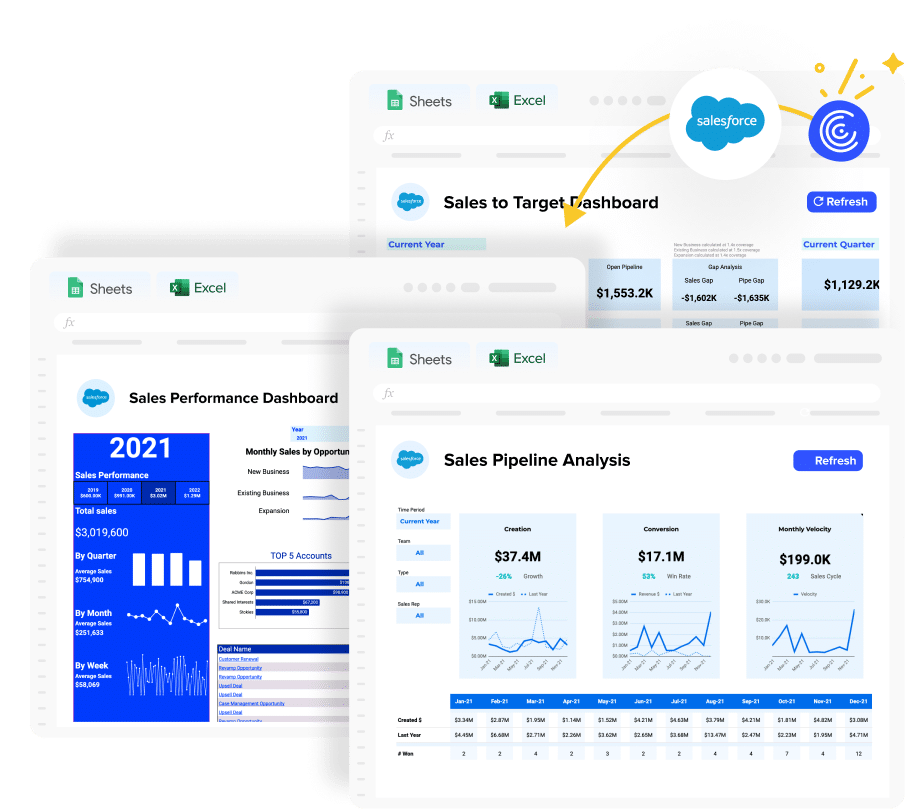
- Set up auto-refresh (optional). If your data comes from Salesforce, HubSpot, QuickBooks, or another external system, install the Coefficient Excel add-in and connect your data source. The dashboard refreshes on the schedule you set from that point forward.
Excel dashboard templates by use case
Sales and CRM dashboard templates
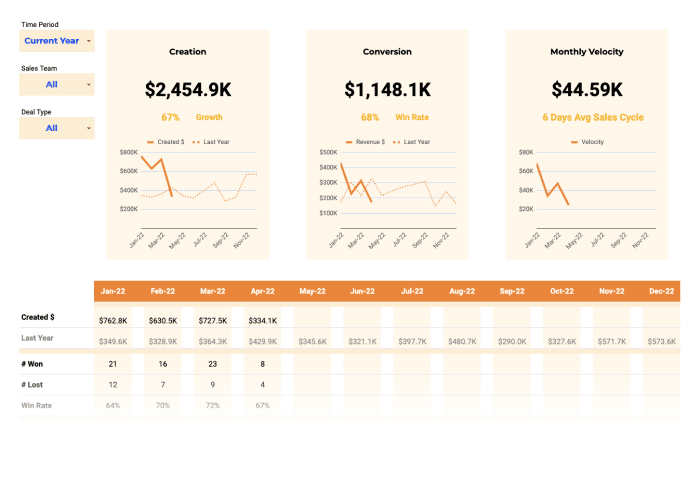
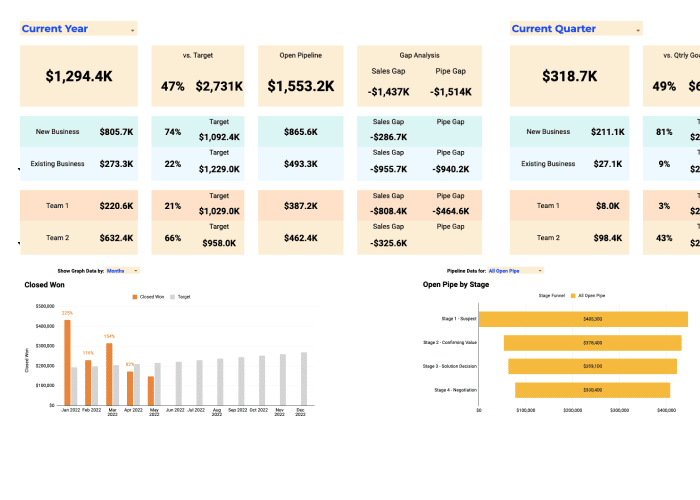
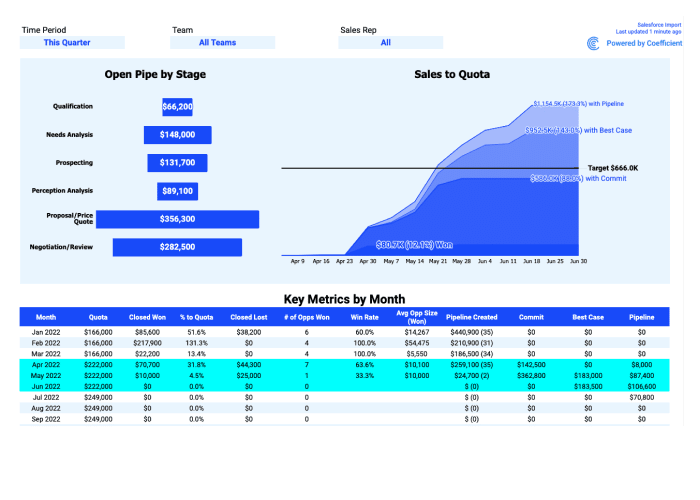
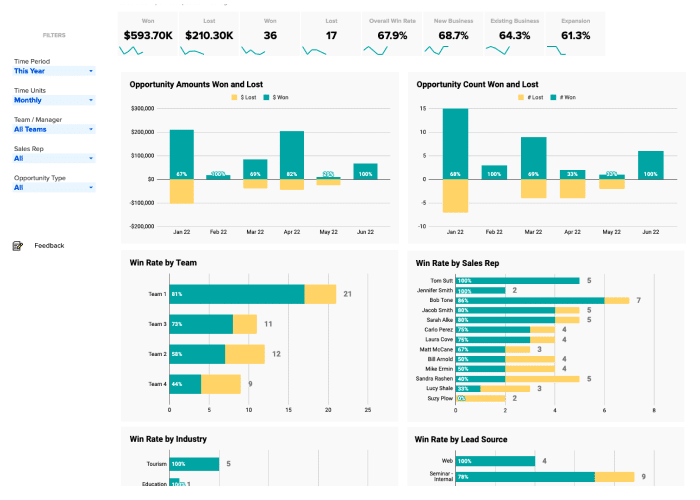
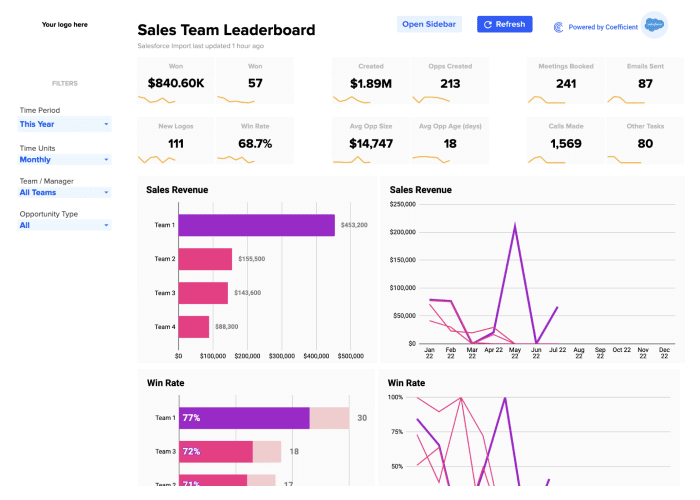
Sales performance dashboard templates track pipeline health, forecast accuracy, and rep performance. Core KPIs: total pipeline value, weighted forecast vs. target, win rate, average deal size, deals created, and quota attainment.
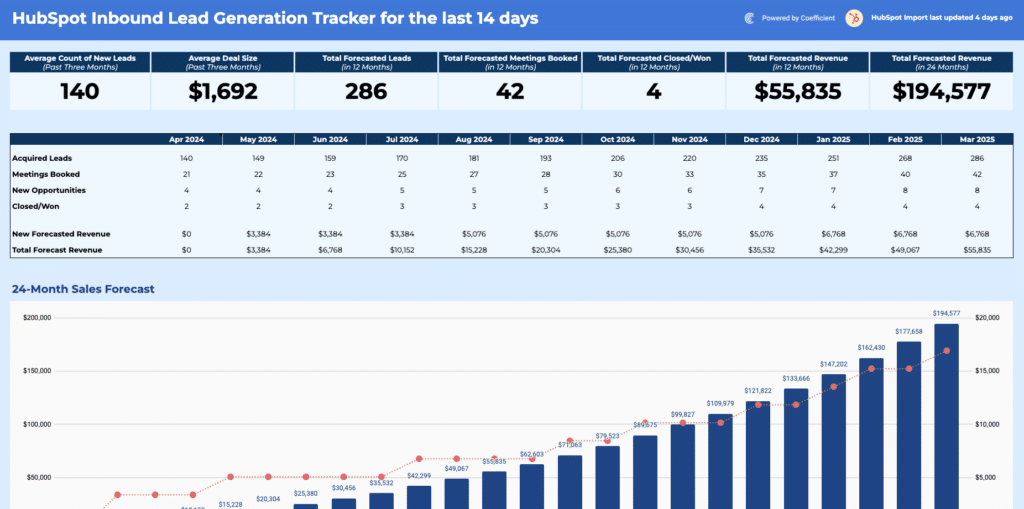
Templates include the HubSpot Pipeline Analysis Template, HubSpot Sales-to-Target Template, HubSpot Sales Operations Dashboard Package, Salesforce Sales Operations Package, Salesforce Sales Opportunity Template, Salesforce Sales Team Leaderboard, and the 12-Month Sales Forecast Template. These connect to live CRM data from Salesforce and HubSpot.
Financial and accounting dashboard templates
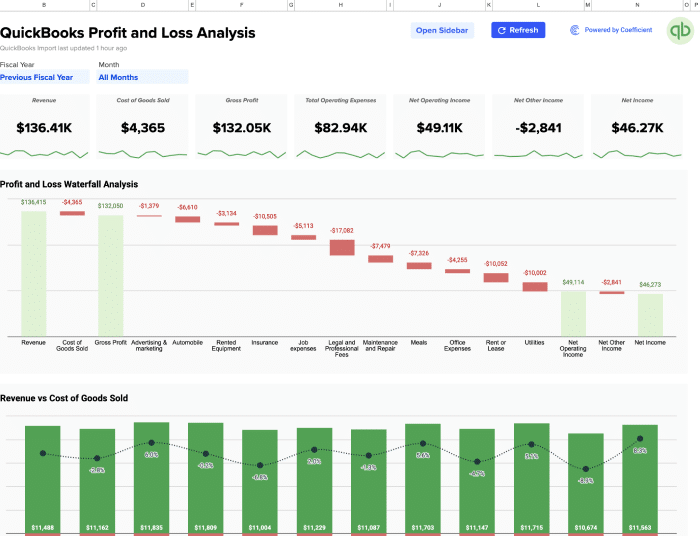
Financial performance dashboard templates cover P&L reporting, cash flow, budget performance, and scenario modelling. Core KPIs: gross revenue, gross margin, net income, budget vs. actuals by department, operating cash flow, and accounts receivable.
Templates include the QuickBooks Profit and Loss Template, QuickBooks Price Volume Mix Analysis Template, QuickBooks What-If Scenario Analysis Template, and the Startup Financial Model Template. These connect to live data from QuickBooks and NetSuite.
Marketing performance dashboard templates
Marketing Excel dashboard templates track channel efficiency, campaign performance, social media buzz and pipeline contribution. Also used as project management dashboards to monitor campaigns. Core KPIs: sessions by source, leads generated, cost per acquisition, MQL volume, email click-through rate, and return on ad spend. Use the Marketing filter above the gallery to browse all available marketing templates for Excel.
Operations and project dashboard templates
Operations metrics dashboard templates track task completion, resource allocation, project budget vs. actuals, and issue resolution time. These templates are typically updated manually on a daily or weekly basis. Use the connector filters in the gallery above to browse templates connected to project management and operations tools.
Using Excel dashboard templates without a Coefficient account
Every Excel dashboard template in this library is fully usable as a standalone static dashboard — no Coefficient account or connection required. Download any template, open it in Microsoft Excel on desktop or web, and start entering your own data. All charts, pivot tables, formulas, and KPI layouts work immediately.
Connecting to Coefficient is an optional step that adds live data refresh from external systems. If you use QuickBooks and want the financial dashboard to update automatically when transactions are recorded, Coefficient's Excel connector handles that. If you prefer to manage data manually or paste in CSV exports, the template works identically — same structure, same visuals, same formulas. Coefficient is the automation layer that sits on top of a dashboard that already functions out of the box.
Frequently Asked Questions
Do I need a Coefficient account to use these Excel dashboard templates?
No. Every template works as a fully functional static dashboard in Microsoft Excel without any account or connection. Download the template, open it in Excel, and enter your data directly — all charts, formulas, and KPI layouts work immediately. Connecting to Coefficient is optional and adds automated live data refresh from your source systems. The dashboard structure and visuals are identical whether used statically or with a live connection.
What types of Excel dashboard templates are in this library?
This library covers KPI and strategic dashboards, sales and CRM dashboards (Salesforce, HubSpot), financial and accounting dashboards (QuickBooks), marketing performance dashboards, and project and operations dashboards. Use the By Function and By Connector filters above the gallery to narrow down to the templates most relevant to your use case.
Can I use these Excel dashboard templates without connecting to an external system?
Yes. All templates work with manually entered data. You can type numbers directly into the data tab, paste from CSV exports, or copy from another source. The charts and dashboard display update based on whatever data you provide. Live system connections through Coefficient are available but entirely optional.
How do I make an Excel dashboard template update automatically?
Install the Coefficient Excel add-in, connect to your data source like Salesforce, QuickBooks, HubSpot, or any of 150+ supported systems and set a refresh schedule. The dashboard updates on that schedule without anyone opening the file manually. Email alerts for key metric changes are also available.
What is the difference between an Excel dashboard template and a Google Sheets dashboard template?
Both use the same structural approach — pivot tables, charts, and formula-driven KPIs — but differ in platform strengths. Excel is better for complex calculations and larger datasets that benefit from desktop processing power. Google Sheets is better for real-time collaboration and browser-based access with no software install. Most templates in this library are available in both formats — Google Sheets versions are here.
Can I customise these Excel dashboard templates?
Yes. All templates are fully editable in Excel. You can change colors and chart types, add or remove KPI cards, rename metrics, adjust column structures, and modify formulas to match your team's categories and targets. Customisations carry forward if you later connect to a live data source through Coefficient.
Are these Excel dashboard templates free?
Yes. Every template is free to download and use as a static dashboard. Connecting to live data through Coefficient requires a Coefficient account — free plan available, paid plans from $49/month with no per-user fees.
Browse the templates in the gallery above or connect your first data source free and have a live Excel dashboard running today.